














 Email
Email SMS
SMS Whatsapp
 Web Push
 App Push
 Audience Sync for Ads
 Popups
 Channel A/B Testing
  Control groups Analysis
 Frequency Capping
 Funnel Analysis
 Cohort Analysis
 RFM Analysis
 Signup Forms
 Surveys
 NPS
NPS Landing pages personalization
  Website A/B Testing
  PWA/TWA
 Heatmaps
 Session Recording
 Wix
Wix Shopify
 Magento
 Woocommerce
 eCommerce D2C
  Mutual Funds
 Insurance
 Lending
  Recipes
  Knowledgebase
 Developer Docs
 Product Updates
 App Marketplace
 Academy
 Ebooks
 Case Studies
 Blog
Blog Templates
 Afreen Sheikh
Every product team decides what to build next, which features deserve more investment, and what to fix and improve. Those decisions influence customer experiences and business growth. Some of those decisions come from data.
Product analytics provide data insights. It tracks product usage, identifies behavioural patterns and measures the impact of every product change. The change includes revealing high-performing products or features, the points where customers drop off, the successful journeys, etc. Product and marketing teams use such analytics to improve decision-making when it comes to engagement, adoption and retention.
This guide explains product analytics, how it works, the metrics that matter, how to choose the right product analytics platform and how NVECTA enables product analytics into customer intelligence
What Is Product Analytics?
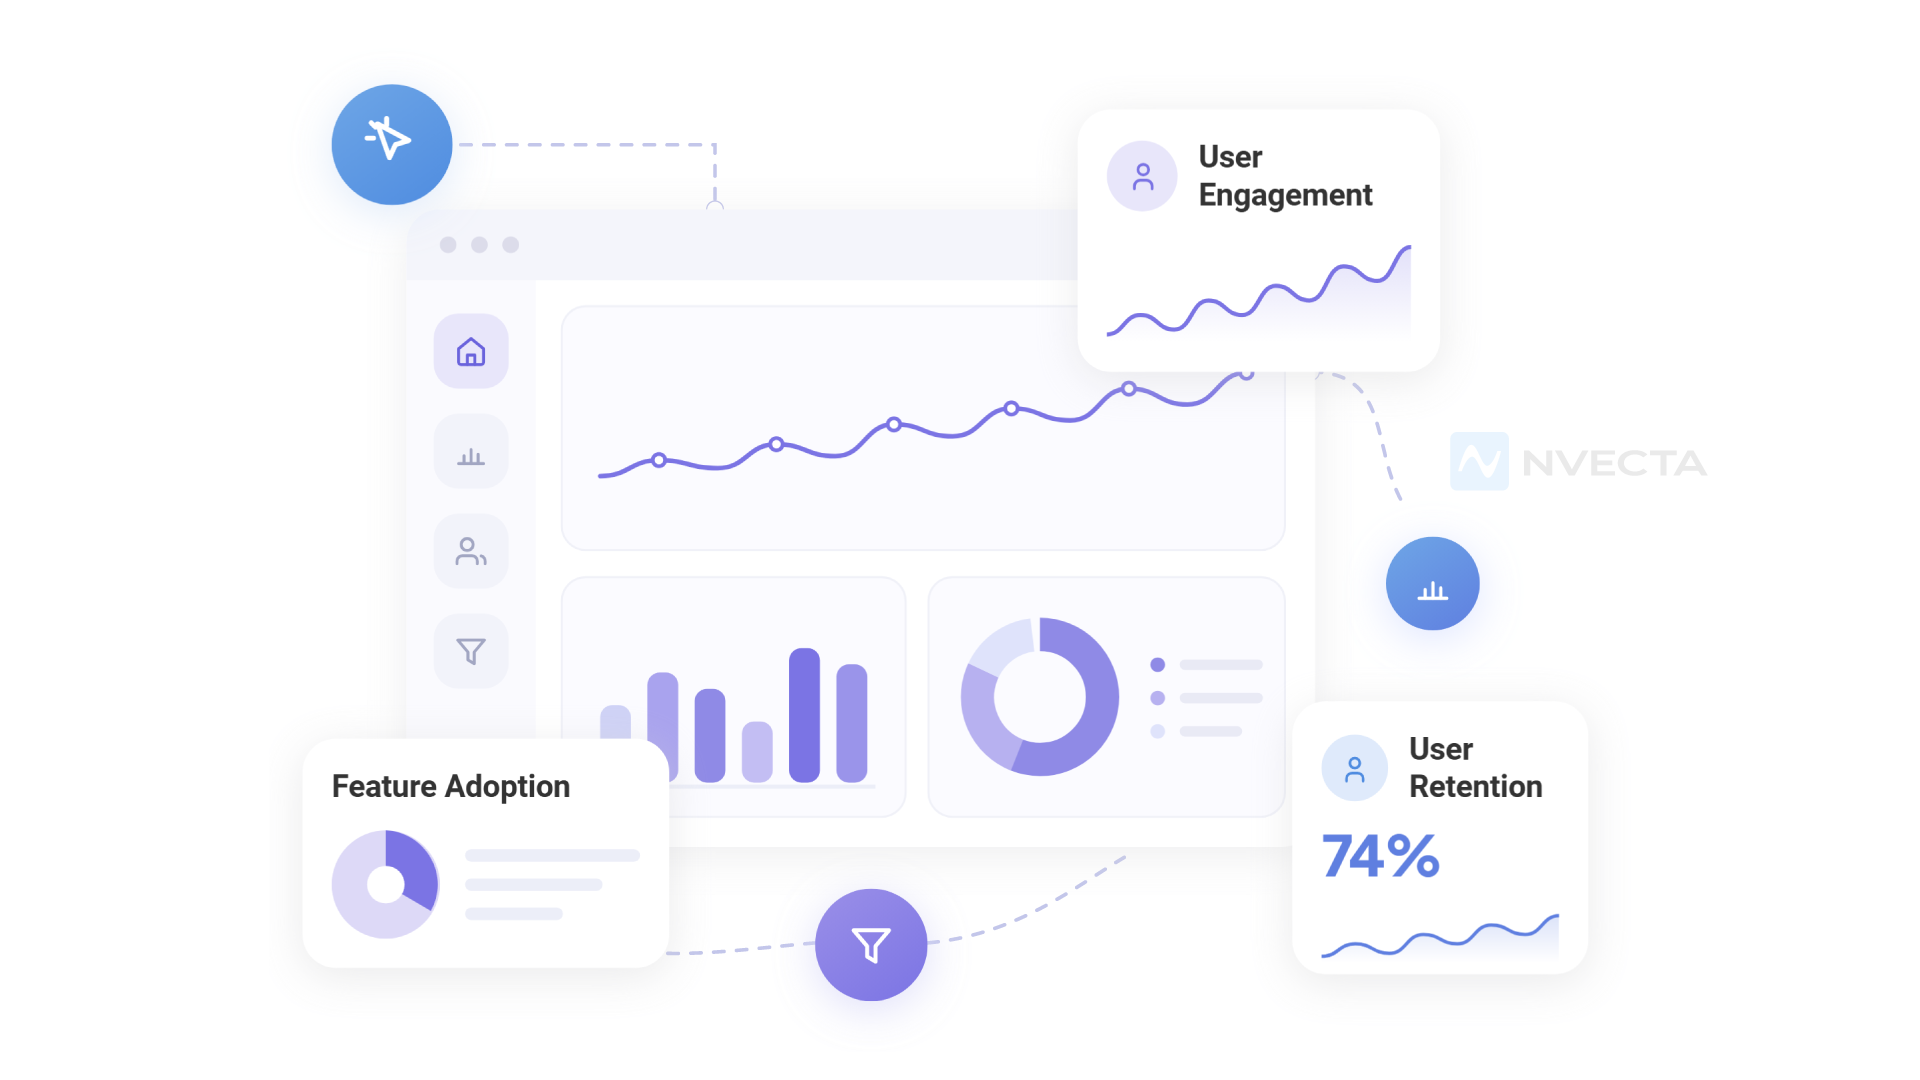
Product analytics is the practice of collecting, tracking and analysing data on how people use a digital product, the buttons they click, the screens they open, and the exact point where they drop off and disengage.
Key Data Sources
Three sources feed a product analytics system. Event data captures individual actions, such as clicks or form submissions. User properties describe who took the action, their plan or role. Session data ties those events into one visit, so a team can see a real path through the product.
Let us take an example for better understanding: Take a SaaS app where half of the new signups never finish onboarding. Without product analytics, a team might guess the trial length is wrong or that the emails aren’t compelling enough. With it, marketers see the exact spot/journey stage where users stop and fix that specific problem instead of guessing at ten possible ones.
Why Product Analytics Matters?
Data-driven decisions built on real-time behavioural patterns consistently outperform those built on assumptions and guesswork, since they show exactly which products or features drive conversions and retention.
Improve Product Adoption
A product or feature can be invisible for months. Behavioural and usage data identify early disengagement and low adoption, before it affects the entire customer journey.
Increase Retention and Reduce Churn
Users who stay tend to show a pattern in week one: a specific action repeated twice, for example. Teams can spot that pattern and accelerate retention strategies.
Align Product, Marketing, and Growth Teams
These teams often optimise different metrics while the overall business performance stays flat. Product analytics gives one shared view of user behaviour, activity and metrics, so that they work in the same direction and toward the same outcome.
How Product Analytics Works
Product analytics works through four connected steps: collecting events, unifying customer data, analysing behaviour, and turning insights into product action.
Collect Product Events
Every click, feature open, and in-app action gets logged as an event, tagged with a user profile, timestamp, and details like what channels or devices are used.
Unify Customer Data
Events collected across web, mobile, and other interaction channels merge into a single customer profile, so that a user who browses on a phone and buys on a laptop shows up as a single customer, not two.
Analyze Customer Behavior
Merged event data gets organised into funnels, cohorts, and segments, showing exactly where users drop off and which products correlate with the people who stay.
Turn Insights Into Action
A pattern only matters once it changes something in the product. Using insights to optimise product through- a simplified screen, a shortened signup flow, or a feature that finally gets reworked.
Key Product Analytics Metrics and Techniques
A few core metrics and techniques do most of the work in a product analytics practice, and each one answers a slightly different question about how customers use a product or move throughout the journey.
Activation Rate
Activation rate measures the share of new users who reach a meaningful first moment, not just the ones who created an account. A low rate usually points to a rough first few minutes.
Feature Adoption
Feature adoption tracks the parts of a product that earn repeat use against the ones tried once and dropped. High trial with low repeat use signals a value problem, not a discovery one.
Retention and Churn Rate
Retention measures the users who return after day one, seven, and thirty, and churn counts the users who are likely to leave. Together, they show whether a product delivers lasting value or just a good first impression.
Funnel Analysis
Maps a defined conversion sequence, like signup to first purchase, and shows exactly where people fall out of it. With this, teams can find specific points of friction and fix them accordingly.
Cohort Analysis
Group users by shared traits or acquisition dates, such as signup date, so a team can compare how behavioural changes affect new users against old ones, giving a clear view of drop-offs, campaign ROI performance and later optimise CLV.
Path Analysis
Traces the actual journey stages customers move through. Evaluate real navigation and planned user journey to make changes.
User Segmentation
Segment an audience based on shared traits, actions, subscription plan, acquisition source, purchase history, or demographics. These groups improve journey stages, user experiences and campaigns.
Product Analytics vs Web Analytics vs Marketing Analytics
These three analytics categories often get grouped, but each measures a separate layer of the business.
| Aspect | Product Analytics | Web Analytics | Marketing Analytics |
|---|---|---|---|
| Purpose | Understand behaviour inside the product | Track site traffic and visits | Measure campaign performance |
| Data collected | Feature usage, in-app events, session behaviour | Pageviews, sessions, bounce rate | Clicks, impressions, ad spend |
| Primary users | Product and engineering teams | Marketing and SEO teams | Marketing and growth teams |
| Key metrics | Retention, activation, feature adoption | Bounce rate, sessions, pageviews | CAC, ROAS, click-through rate |
| Best use case | Fixing onboarding or reducing churn | Improving page speed and content reach | Improving ad targeting and budget |
Web analytics can show how many users visit a product page each month or quarter. Marketing analytics can show which campaigns drive engagement and signups. Neither can tell you whether those visitors became active users or churned within a week because the product failed to meet their expectations. That question, the one that determines whether your investment was worth it, is what product analytics can answer.
How to Choose a Product Analytics Platform
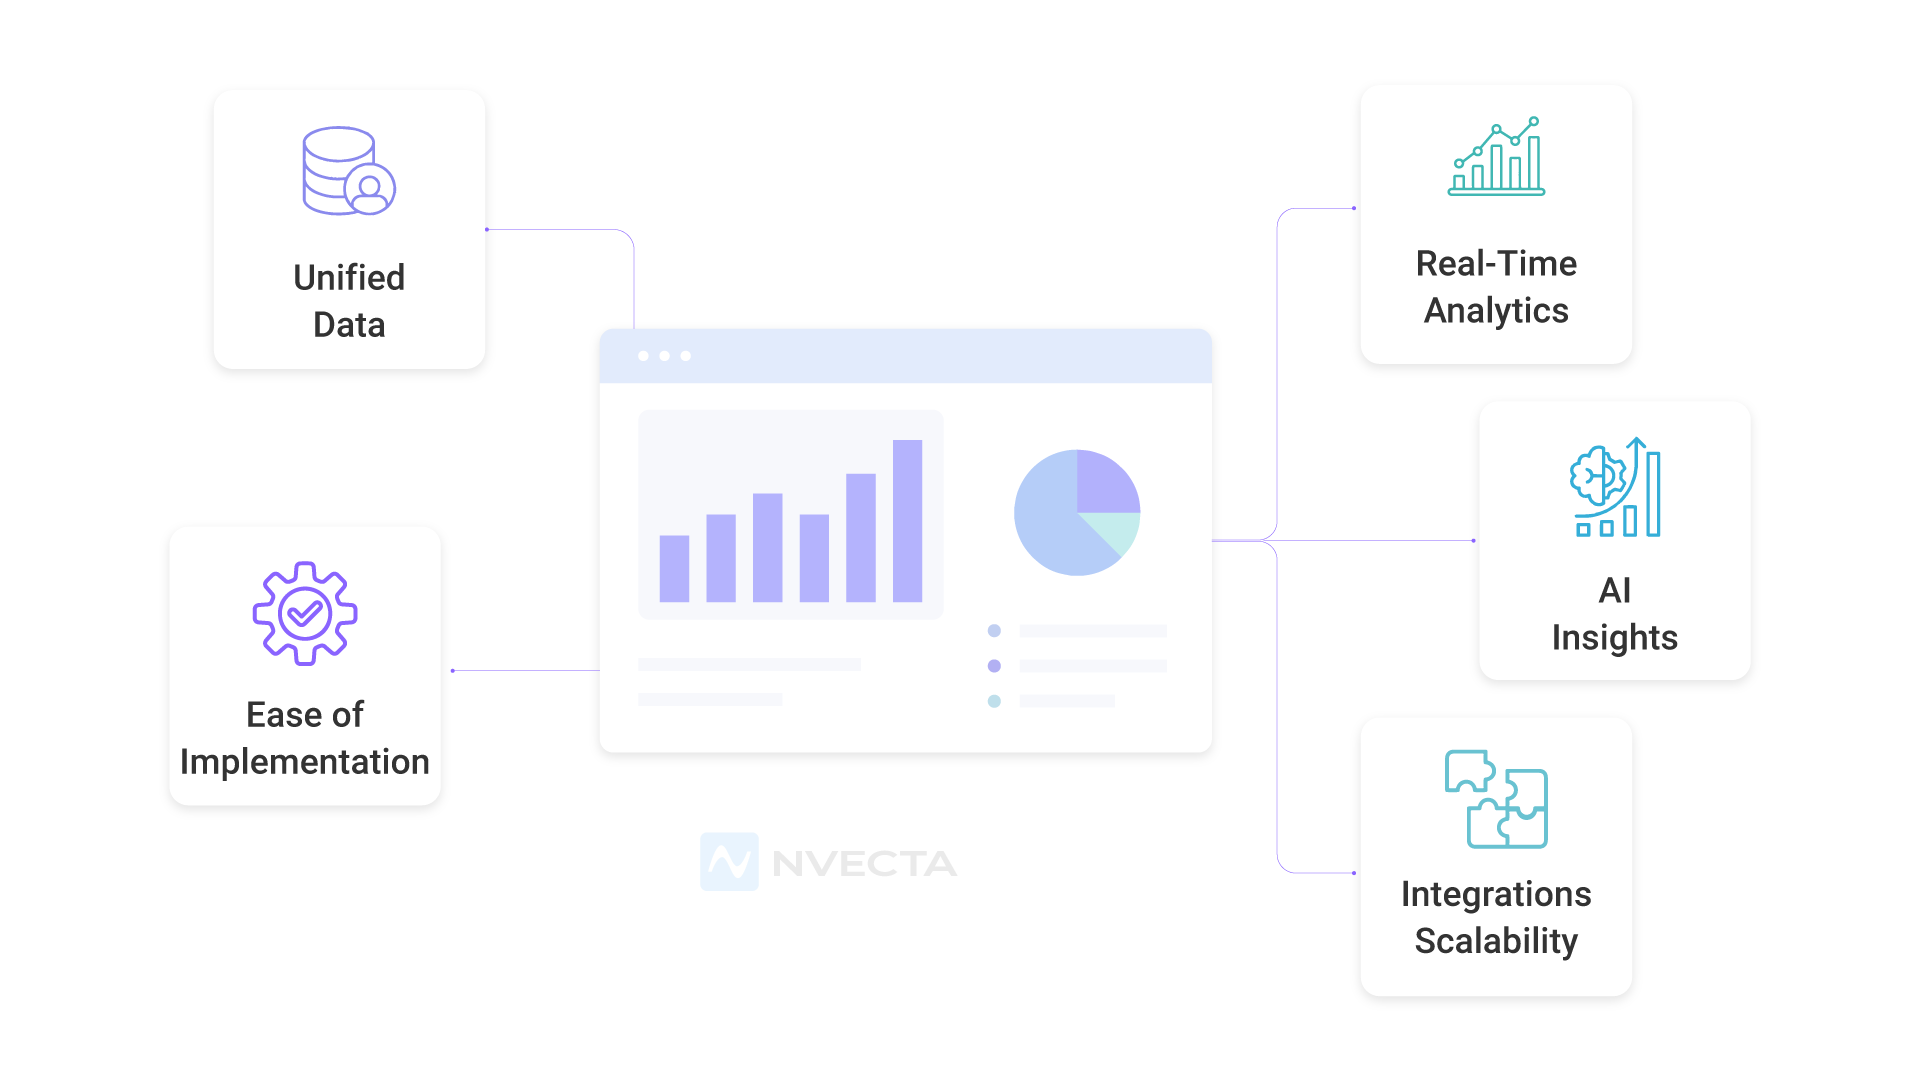
Choosing the right platform means looking past dashboards and charts, toward whether it connects in-product behaviour to the rest of your customer data in one unified system.
Unified Customer Data
Look for a platform that reads behaviour next to who the customer actually is, since a usage spike means something different for a new visitor than an active customer.
Real-Time Analytics
Choose a platform that surfaces what’s happening now, not a day later, so a broken payment flow or a sudden error spike gets caught while it’s still fixable.
AI-Powered Insights
A platform worth picking points out what changed and why on its own, instead of handing over a raw chart and leaving the interpretation entirely to whoever’s reading it.
Integrations and Scalability
Pick a platform built to handle rising event volume, since one designed for light traffic can buckle exactly when the business can least afford a migration.
Ease of Implementation
Choose a platform where adding one new event doesn’t need an engineering sprint, or teams quietly stop tracking new things, and the data set goes stale.
Best Practices for Implementing Product Analytics
Getting real value from product analytics depends on a few careful considerations of how a team sets goals, tracks events, and acts on findings.
Define Clear Business Goals
Start from a specific target, like raising day seven retention from twenty per cent to thirty, instead of tracking everything and hoping something useful shows up later.
Track Meaningful Events
Keep the event list short and tied to a real question. A long list nobody ever queries adds noise, not clarity.
Maintain High Data Quality
One team calling something Sign Up and another calling it Signup Completed quietly breaks a funnel long before anyone notices the numbers are off.
Combine Product and Customer Data
A usage drop from someone who just filed a support ticket tells a different story than the same drop from someone who’s been quietly steady for months.
Turn Insights Into Action Quickly
An insight sitting untouched in a dashboard for a month is worth far less than one that someone actually acted on the same week.
How NVECTA Turns Product Analytics Into Customer Intelligence
Most product analytics platforms answer one question: What happened inside the product? NVECTA CDP answers the next one: What should happen next? NVECTA turns product analytics into customer intelligence by keeping in-product behaviour and full customer history inside one unified profile. Product analytics explains customer behaviour. Customer intelligence explains customer value. It adds context to product event, transactional, and behavioural data and outcomes, paving the way for better decision-making and experiences.
Update Customer Profiles with Real-Time Product Behaviour
NVECTA tracks web & app insights revealing how the user engages with the product?. It collects every click, product usage, behavioural pattern, purchase history, campaign activity, support tickets and updates- is tracked into the same customer profile.
Funnel, Cohort, and RFM Analysis
NVECTA provides businesses with multiple analyses- Funnel analysis reveals the exact step or stage where the workflow lags. Cohort analysis surfaces long-term retention, churn risks, and high-performing segments. RFM analysis assigns scores as per recency, frequency and monetary value to sort high-spending customers, at-risk customers, users likely to convert, and to surface long-term customers and rare visitors.
AI Decisioning and Customer Scoring
NVECTA’s AI Decisioning reads the user profile, analyses real-time data and produces a number for each customer: a churn risk score, a purchase intent score, and an engagement score. A support team no longer waits for a customer to complain before knowing something’s wrong; the score flags it first.
Next-Best Action Recommendations
NVECTA provides Next-best action turns that score into one specific move like a retention email, a discount, an in-app prompt, or no outreach at all if the model shows engagement would hurt more than help.
Journey Orchestration
Journey Orchestration takes the recommended action and builds it into a sequence across channels, email, SMS, WhatsApp, or a message inside the product itself. A single trigger, a drop in feature use, for example, can set off a three-step sequence instead of one isolated email that gets ignored.
Native A/B Testing
NVECTA runs A/B tests inside the platform through experimentation of different variation campaigns to different segments. A redesigned checkout flow, a shortened signup form, or a new onboarding screen gets measured against the metric it targets before it rolls out to everyone, not after.
In-Product Nudges and Walkthroughs
Nudges & Walkthroughs step in at the exact screen where session data shows customers hesitate or quit. A tooltip pointing at a confusing field, or a short product walkthroughs triggered after two failed attempts, catches someone in the moment, and not after they’ve already left.
Conclusion
A dashboard full of charts doesn’t guarantee business growth; someone still has to connect what it shows to the customer behind it and decide what happens next. That’s the real value in product analytics, not the charts, but the decisions they make possible once behaviour and customer data are processed.
NVECTA builds that connection from the start: product behaviour, AI Decisioning, and full customer profiles inside a single CDP, so teams act on the metrics to automate operations and reduce manual work.
Make smarter product decisions with AI-powered customer intelligence using NVECTA CDP.
Frequently Asked Questions
What Is Product Analytics Used For?
A product analytics tool supports businesses in spotting friction points and optimising workflows for better customer experiences, conversion and retention. By tracking multiple metrics, it reveals numbers for recurring patterns in user behaviour in terms of activity, transaction, inactivity, etc.
How Does Product Analytics Work in Practice?
A platform logs every click and in-app action as an event, tied to a user profile. Those events get organised into funnels, cohorts, and segments, turning raw clicks into a pattern a team can look into. From there, the pattern becomes a change to the product, a screen simplified, a step removed.
Is Product Analytics the Same as a Customer Data Platform?
No, though the two work well together. Product analytics focuses on behaviour inside an app or site. A CDP unifies that behaviour with purchase history, campaigns, and support records into one profile. NVECTA runs both from a single platform, so nothing gets tracked in two disconnected places.
What Tools Are Used for Product Analytics?
Most platforms combine event tracking, funnel and cohort analysis, session recordings, and segmentation into one dashboard. It connects that behaviour to the rest of a customer’s data instead of showing numbers on its own, since a single click carries less meaning without knowing who made it.
Can Small Businesses Use Product Analytics Too?
Yes, and the smaller the team, the more it matters, since there’s less room to build the wrong feature. A small brand doesn’t need enterprise-scale data, just a short list of meaningful events tied to one clear goal, like improving week one retention or cutting drop-off.
