














 Email
Email SMS
SMS Whatsapp
 Web Push
 App Push
 Audience Sync for Ads
 Popups
 Channel A/B Testing
  Control groups Analysis
 Frequency Capping
 Funnel Analysis
 Cohort Analysis
 RFM Analysis
 Signup Forms
 Surveys
 NPS
NPS Landing pages personalization
  Website A/B Testing
  PWA/TWA
 Heatmaps
 Session Recording
 Wix
Wix Shopify
 Magento
 Woocommerce
 eCommerce D2C
  Mutual Funds
 Insurance
 Lending
  Recipes
  Knowledgebase
 Developer Docs
 Product Updates
 App Marketplace
 Academy
 Ebooks
 Case Studies
 Blog
Blog Templates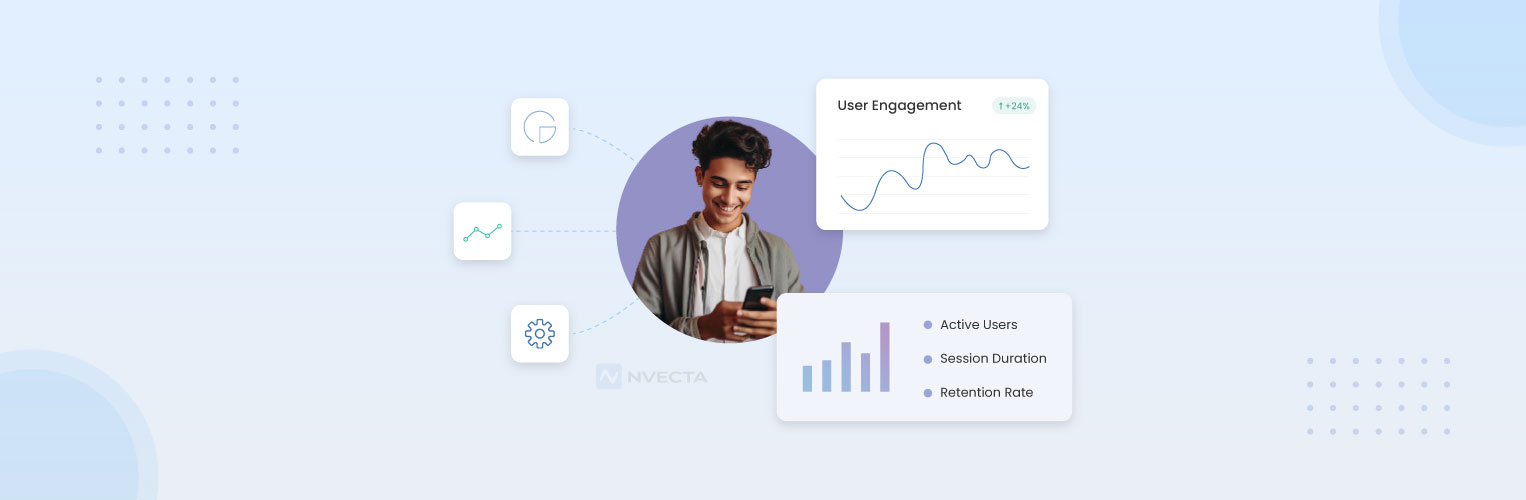
 Afreen Sheikh
User engagement measures how audiences interact with your product, website, or app over time. It involves tracking every user’s interaction to find out whether users derive value from the experience. It covers clicks, time spent, repeat visits, and every action a person takes from the time they reach your product, site or app.
Every business tracks user activity differently. An ecommerce brand evaluates frequency of visits and purchases; a bank looks at login frequency and transaction activity. A SaaS or subscription-based business tracks daily usage and feature adoption. The primary question stays the same: are people getting value from what you built, and do they come back for more?
This guide covers-
- What user engagement is, and why it matters
- How it is different from customer engagement, its core metrics worth tracking, and real-world use cases
- Strategies to improve user engagement
- How NVECTA CDP strengthens effective user engagement
What Is User Engagement?

User engagement is the process of analysing the level of interaction, involvement, and connection a user builds over time with a product, website or an app. It shows up in clicks, page views, session length, feature use, and how often someone returns.
A user does not need to buy anything to be engaged. Not necessarily user needs to make a purchase to be called engaged; they just need to act. Common signs of engagement include:
- Visiting your site or app more than once
- Spending real time on a page or screen
- Clicking through to other pages or features
- Using specific tools inside your product
- Sharing content or referring others
People often confuse user engagement with customer engagement. They are related terms, but not the same thing.
| Aspect | User Engagement | Customer Engagement |
| Focus | How users interact with a product, website, or app | How customers interact with a brand throughout their relationship |
| Scope | Product usage and digital behavior | Marketing, sales, product, service, and support interactions |
| What it measures | Actions such as sessions, clicks, feature use, and content views | Actions such as purchases, communication, support interactions, and renewals |
| Primary goal | Increase product adoption and meaningful usage | Build stronger relationships, retention, and loyalty |
| Key metrics | DAU, MAU, session frequency, feature adoption, engagement rate | Retention rate, repeat purchases, CLV, churn, customer satisfaction |
Both matter. But user engagement usually comes first. If people never engage, they never become customers.
Why User Engagement Matters
User engagement matters because it shows whether a product creates real value before that value ever reaches a revenue report.
- Works as an early warning system- A drop in engagement shows up weeks before churn happens or a revenue loss appears in financial reports, giving a business time to respond while a customer can still be won back.
- Protects lifetime value- Users who stay engaged spend more over time, since regular leads naturally upgrade or move for a repeated purchase.
- Sharpens product decisions- Usage data shows a business what people use or engage with more often, so that product teams work on refining or developing the features that deliver more value.
- Lowers acquisition costs- Engaged users refer others and build organic trust, which reduces how much a business needs to spend on paid channels to grow.
- Stabilises revenue planning. Consistent engagement patterns give leadership a reliable base to forecast around.
Key Metrics for Measuring User Engagement
The right metrics depend on your product, but a few metrics work for almost any business. Here is what each one reveals.
Daily Active Users and Monthly Active Users
DAU and MAU count how many unique users show up in a day or a month. Divide DAU by MAU, and you get a stickiness ratio; a rough measure of how often people return. A ratio near 50% means people use your product almost every day. A ratio near 10% means most users show up once a month and forget about you the rest of the time.
Session duration
This tracks how long a person stays active in one visit. Longer sessions usually mean people find enough value to keep exploring. But context matters. A long session on a banking app might mean someone is stuck, not engaged.
Retention rate
Retention rate tracks what percentage of users come back after a set period, like a week or a month. Cohort-based retention, where you group users by signup date and track them over time, shows whether engagement holds up as your product changes.
Feature adoption
This measures how many users try and keep using a specific feature. High signup numbers mean nothing if nobody touches your core features after week one. Feature adoption shows whether people use your product the way you built it to be used.
Churn rate
Churn rate is the percentage of users who stop using your product over a given period. It moves in the opposite direction of engagement. When engagement drops, churn almost always rises a few weeks later.
Net Promoter Score
NPS asks users how likely they are to recommend your product. It adds a layer that behaviour data alone cannot give you: how people feel, not just what they click.
| Metric | What it shows | Formula |
| DAU/MAU | How often users return | DAU ÷ MAU |
| Session duration | Depth of engagement per visit | Total session time ÷ sessions |
| Retention rate | Users who return after a set period | Returning users ÷ total users |
| Feature adoption | Real use of specific features | Users of feature ÷ total users |
| Churn rate | Users lost over time | Lost users ÷ starting users |
| NPS | Willingness to recommend | % Promoters minus % Detractors |
Proven Strategies to Improve User Engagement
Stronger user engagement requires a deeper understanding of users. For that, you need to track user actions, spot what keeps them active, fix drop-offs, and use real data to create better experiences. These eight strategies drive more meaningful user action.
Build a single view of every user
Businesses collect data through multiple tools to track user activity across channels and devices. Build a unified profile of every user by connecting all the touchpoints. This way, you get to see a complete view of each user. It eliminates duplicate records, and you can accurately find which channel brought a customer, what action they did last, etc.
Segment by real behaviour, not assumptions
Creating demographic segments is less effective these days. Create real-time behaviour-based segments that begin with tracking live user activity and adding users to it. It further moves users based on their behaviour shifts. This way, your messaging gets sharper without extra work.
Personalise in real time
A message sent three days after someone abandons a cart lands too late. The right moment matters as much as the message. With real-time personalisation, you can act in time to engage users based on their recent activity.
Remove friction from key workflows
Most drop-off happens during signup, checkout, or onboarding. Find where people quit these flows and optimise that exact step. A single extra form field can irritate a user, leading to their switching to your competitor.
Automate behaviour-triggered re-engagement
A fixed weekly email misses people who go quiet on day two and people who are still active on day six. Trigger re-engagement outreach based on what a user does or stops doing, and your timing improves without more manual work.
Predict disengagement before it happens
By the time someone stops opening your app, the signs were there for weeks already. Fewer logins and shorter sessions show up early. Catching these patterns gives your team time to step in before the user leaves for good.
Close the feedback loop in the moment
Asking for feedback three weeks after a bad experience gets you a shrug. Asking right after it happens gets you a real answer. Short prompts placed at the moment of action get far higher response rates than end-of-quarter surveys.
Keep experience consistent across channels
Ensure consistent messaging across channels. A user easily notices one message in email and a different one in the app, leading to loss of interest and trust. Use a system that delivers offers, discounts, tone, and timing aligned, so that consistency is maintained every time users switch channels.
How NVECTA Helps You Improve User Engagement in 2026
NVECTA is an AI-powered customer data platform that enables user engagement. It turns strategies into real engagement with its smart, extensive tracking and analysis system-all through a single platform.
Natural language querying
Ask a question in plain English, like “which users stopped opening the app this month,” and get an answer with no SQL and no wait for a data team.
Unified, real-time customer profiles
Every touchpoint- web, app, CRM, and offline- feeds into one profile per person, updated as new activity comes in.
Predictive engagement and churn scores
The platform uses churn prediction and predictive AI to spot users likely to disengage or convert. Scores are generated automatically from behaviour patterns, without any manual analysis.
Personalisation across channels
Messaging adapts to a user’s most recent activity across web, app, and email, using one setup that covers every channel.
Next best action recommendation
NVECTA suggests the next best action for every user considering their profile data and recent behaviour activity. This fastens operations and reduces manual analysis.
Campaigns that improve over time
The system learns from what works and adjusts targeting on its own, so rules do not stay static for months.
NPS and sentiment tracking
NVECTA captures Net Promoter Score alongside behaviour data, so your team sees how someone feels next to what they did, all inside the same user profile.
Works with your existing warehouse
NVECTA connects directly to your existing warehouse. There is no need to create copies or export data. Your data stays where it already lives.
Built-in consent management
Preferences get captured and applied automatically across channels, which keeps compliance part of the workflow rather than a separate project.
Setup built for different industries
Configurations exist for BFSI, SaaS, ecommerce, retail, travel, real estate, telecom, and automotive businesses, matching how each industry works toward engagement.
Conclusion
User engagement is an important term for businesses in 2026. It is the clearest signal you have about whether people find real value in what you built, long before that shows up in revenue or churn reports.
Improving it takes more than a dashboard. You need a full picture of each user across every channel, and a way to act on insights the moment they change.
Mere tracking engagement does nothing; you need an effective platform that does the tracking part and implements the above strategies to improve it.
NVECTA connects your customer data, predicts where engagement is slipping, and helps your team respond while there is still time to change the results.
See how NVECTA can help your team turn engagement data into action.
Book a demo today.
Frequently Asked Questions
What is user engagement?
User engagement tracks how people connect with your product and whether it provides enough value to them. Clicks, time spent, repeat visits, and feature use are all considered to build insights on engagement, so that you can make optimisations for better experiences and business outcomes.
How is user engagement different from customer engagement?
User engagement covers anyone who interacts with your product, website or app, paying or not. Customer engagement narrows the focus to people who have already become your customers, and you track their relationship with your brand. One measures activity. The other measures loyalty built over repeat purchases.
What are the best user engagement metrics to track?
DAU and MAU show return frequency. Session duration shows depth per visit. Retention rate shows the returning users over a specific period of time. Feature adoption shows real product use. Churn rate spots users who are likely to leave. Measure these together, and you get a complete picture of user engagement.
How do you measure user engagement?
Pick actions that signal value in your product: a login, a purchase, a completed task. Track how often users repeat that action and how many return over weeks. NVECTA brings this data into one profile per user, so patterns show up fast.
How do you improve user engagement?
Fix friction in signup and onboarding first; that is where most people quit. Personalise messages based on real behaviour. Automate outreach triggered by what a user does, not a fixed schedule. Small, targeted changes beat one big redesign every time.
Why does user engagement drop?
Poor onboarding, frequent or irrelevant messages, and slow load times lead to lower user engagement. Such shortcomings slowly drive users away due to loss of interest. You can monitor metrics, find frictions, and make optimisations to grow.
How does NVECTA help improve user engagement?
NVECTA connects every touchpoint into one customer profile, flags users likely to disengage, and personalises outreach for every user using automation and AI features.
