














 Email
Email SMS
SMS Whatsapp
 Web Push
 App Push
 Audience Sync for Ads
 Popups
 Channel A/B Testing
  Control groups Analysis
 Frequency Capping
 Funnel Analysis
 Cohort Analysis
 RFM Analysis
 Signup Forms
 Surveys
 NPS
NPS Landing pages personalization
  Website A/B Testing
  PWA/TWA
 Heatmaps
 Session Recording
 Wix
Wix Shopify
 Magento
 Woocommerce
 eCommerce D2C
  Mutual Funds
 Insurance
 Lending
  Recipes
  Knowledgebase
 Developer Docs
 Product Updates
 App Marketplace
 Academy
 Ebooks
 Case Studies
 Blog
Blog Templates
 bhivesh
App uninstall rate measures the share of users who delete a mobile app over a certain time period. The possible reasons include slow onboarding, a rough first session, and notifications or alerts that are repetitive or carry no value.
An uninstall is not a sudden decision. Before someone removes an app, their behaviour changes first, like sessions grow shorter, certain screens stop getting opened, and notifications go unnoticed. These shifts appear days before an uninstall happens.
Most teams notice this problem once the uninstalls increase, and by that point the user has already left. Therefore, you need to prioritise behavioural tracking, identify shifts, and respond while users remain active.
This guide covers-
- What are app uninstall rates, and how do you calculate them?
- Reasons for uninstalls and how to reduce the rates?
- A 30-day strategy for app retention
- How do AI and customer data help manage uninstalls?
- How does NVECTA help reduce uninstall rates?
What Is App Uninstall Rate?
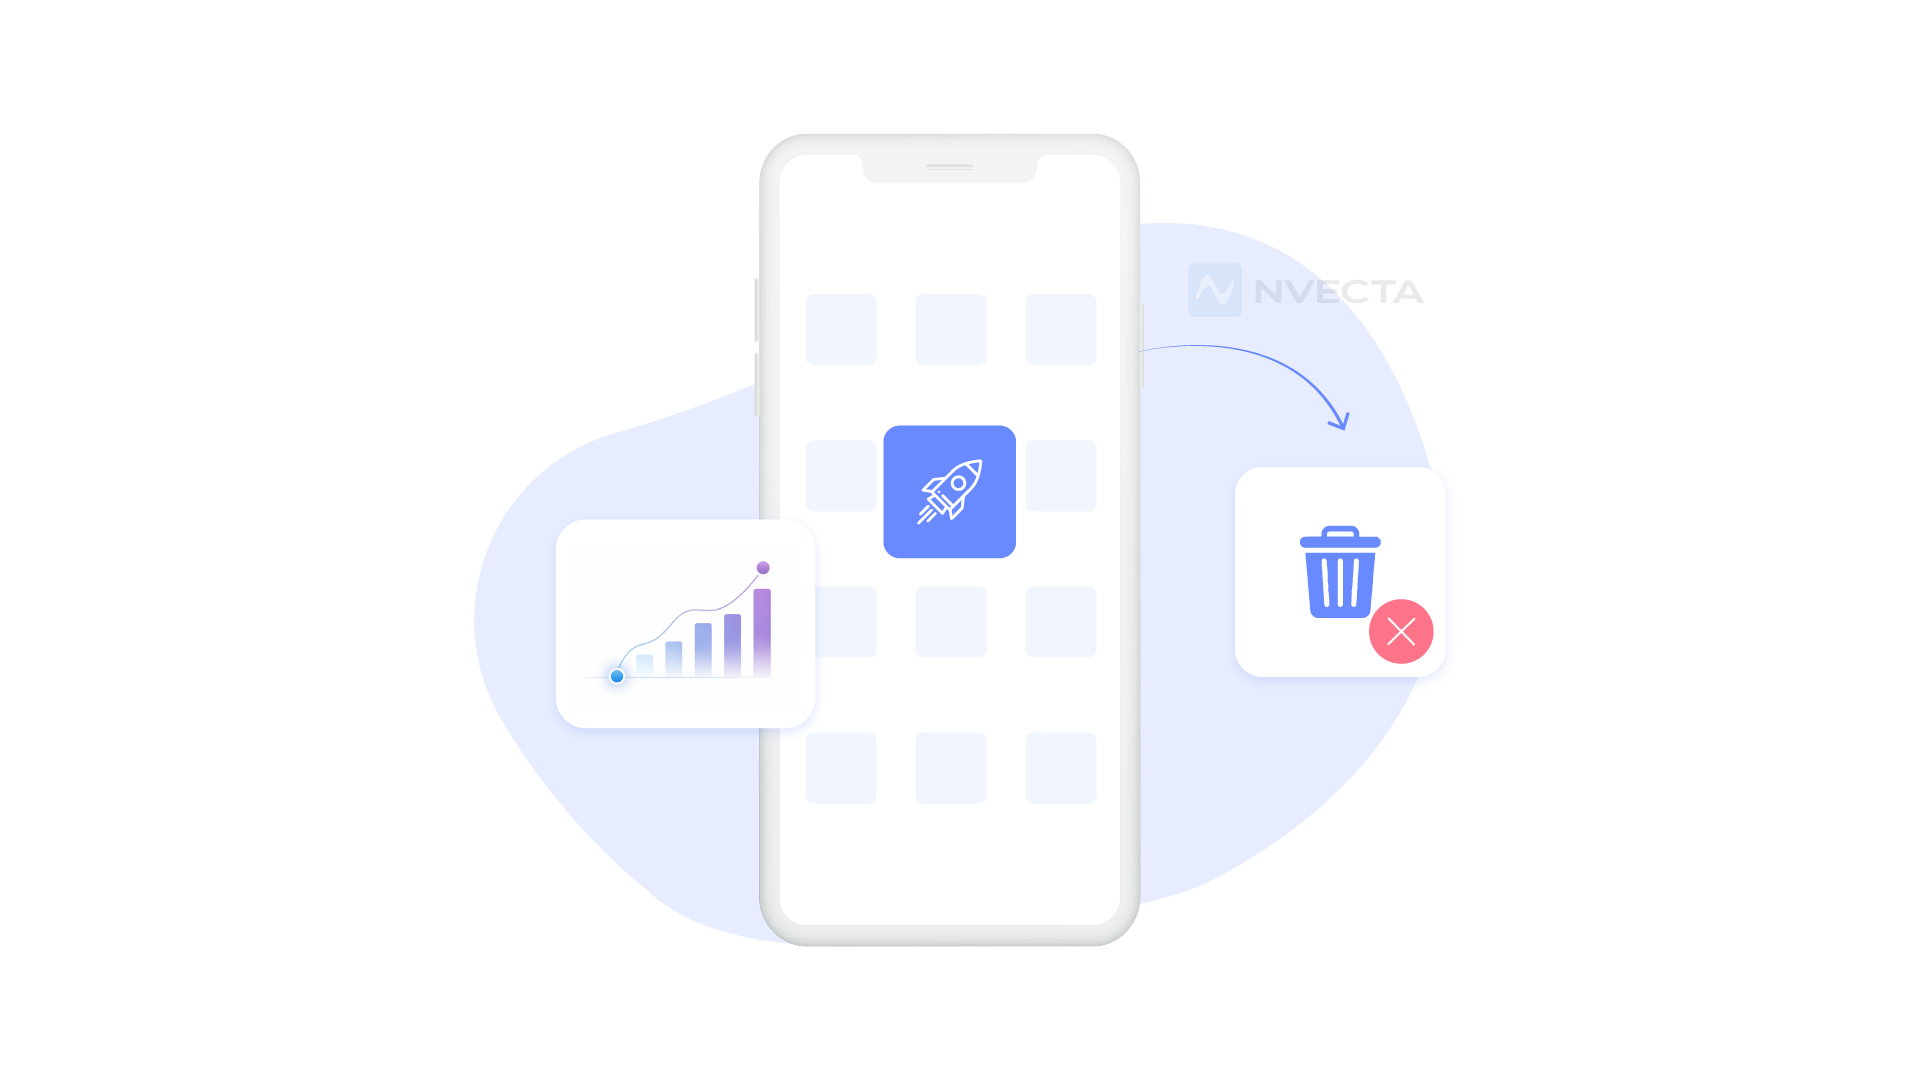
App uninstall rate is the percentage of users who remove a mobile app from their device over a defined period. It reflects a completed decision to leave- one of the clearest signals of how well an app matches what users expected.
It is distinct from churn rate, which tracks users who stop engaging or paying without deleting the app, and from retention rate, which tracks who continues using it.
How to Calculate App Uninstall Rate
| App Uninstall Rate = | Number of Uninstalls Total Number of Installs | × 100 |
If 1,000 users install your app in a given month and 280 uninstall it,
| 280 1000 | × 100 |
Your uninstall rate for that month is 28%.
Always measure against a fixed window, such as Day 1, Day 7 or Day 30, so the figures retain their comparability across successive evaluation periods.
App Uninstall Rate vs Retention Rate vs Churn Rate
| Parameter | App Uninstall Rate | Retention Rate | Churn Rate |
| Definition | Users who delete the app | Users who remain active after a defined period | Users who stop using the app during a defined period |
| What it shows | Users who have removed the app | Users who continue using the app | Users who have become inactive |
| Measurement Window | Day 1, Day 7, Day 30 | Day 1, Day 7, Day 30 | Weekly, monthly, or defined lifecycle period |
| User Status | App removed from device | App remains in use | App may remain installed, but user activity declines or stops |
| Recoverability | Requires reinstall or another acquisition path | Users are already active | Users may return through re-engagement |
| Primary Signal | Final exit action | Continued product value | Declining engagement |
| Strategic Role | Lagging indicator of user loss | Core retention health metric | Early warning signal for potential user loss |
These four metrics describe different aspects of the same behaviour. A user can disengage weeks before they actually uninstall, so you need to assess which metrics are relevant for your recent targeted goals. You can track all of them for better results.
Why Do Users Uninstall Apps?
There is rarely a single cause. Slow onboarding, a difficult first session, notifications with no clear value, and a mismatch between advert and app all appear in uninstall data. These factors show up in user behaviour before the uninstall itself.
Poor Onboarding and Slow Time to Value
New users form an impression within the first few screens. A long sign-up form, an onboarding flow users cannot skip, or permission requests that arrive before value appears; each adds friction at the point where trust must form.
Irrelevant or Excessive Notifications
Notification behaviour follows a clear pattern; users disable notifications first, then uninstall the app within days. A notification with no value teaches the user to ignore the app. Uninstall follows once notifications are turned off.
A notification carrying no value doesn’t just get dismissed; it trains the user that opening your app is optional. Muting is the warning shot, and it’s visible in your data. Notification norms have also shifted over the past two years in ways that make older frequency playbooks risky, which is covered in more detail in these push notification trends.
Poor App Performance and Technical Issues
Performance issues account for a large share of uninstalls. A crash during the first session can undo weeks of marketing investment. Slow load times and unresponsive screens count as reasons to leave, not minor faults.
Low Feature Adoption
Users install an app to solve a specific problem. If the feature that solves it stays hard to find within the first few visits, users conclude it does not exist and move to an alternative that makes it clear.
Friction During Purchase or Checkout
For transactional apps, ecommerce, travel and fintech included, checkout is the decisive point for friction. A payment screen with excess fields, slow loads, or silent failures gives users a direct reason to uninstall.
Privacy and Permission Concerns
Requests for camera, contacts or location access without context raise concern rather than reassurance. Many users uninstall rather than grant access with no clear purpose.
Lack of Personalisation
An app that offers the same experience to every user feels relevant to none of them. Generic content and static home screens push users toward disengagement, and removal follows once storage space becomes a factor.
Acquisition and Product Experience Mismatch
A common pattern: adverts promise instant results, the app opens onto a sign-up wall. This difference between advertised results and app delivery accounts for a meaningful share of first-day uninstalls.
Each cause leaves measurable signals before the uninstall, like fewer sessions, reduced feature use, and unopened notifications. The next section covers early signal detection, not reaction after the uninstall rate rises.
How to Reduce Your App Uninstall Rate
Three changes affect uninstall rate the most: a shorter path to real value for new users, a fix for the exact screen where most users drop off, and engagement built around in-app behaviour rather than broad demographic categories. Most of this impact occurs within the first session and first week, where most uninstalls start.
Improve the First User Experience
Reduce onboarding to the minimum number of steps required. Delay permission requests until the feature that needs them is in use. Users should reach something of genuine value within the first minute, not after several screens into a tutorial.
Find and Fix Drop-Off Points
Review the funnel screen by screen, not as a single aggregate figure. In most cases, one specific step accounts for the majority of drop-off. Identifying and fixing that step typically has more impact than addressing several smaller issues at once.
Personalise Engagement Around User Behaviour
Behavioural data is a stronger basis for messaging. A user who viewed a product without purchasing requires a different message from one who abandoned onboarding partway through. Treating both users identically reduces the effectiveness of either message.
Control Notification Frequency and Relevance
Increasing notification volume does not reliably increase engagement, and beyond a certain point it tends to reduce it. Opt-out rate is the clearest indicator here. A rising opt-out rate usually means notifications are too frequent, not relevant enough, or both.
Re-Engage Users Before They Go Inactive
A nudge after three or four inactive days performs far better than the same message a month later. By then you aren’t preventing anything; you’re running a win-back campaign against someone who has already replaced you. If you’re building that sequence, these customer re-engagement tactics cover the timing and message structure in more depth.
Fix Product Friction With Behavioural Data
Look at where users hit errors, abandon a feature or slow down before quitting a task. These patterns point to exactly what to fix first, ranked by how many users they affect.
Match Retention Strategies With User Intent
Different behaviour needs a different response. A generic push notification will not fix a checkout problem.
| User behaviour | Response |
| Abandoned onboarding | Contextual reminder to finish setup |
| Viewed product, did not buy | Targeted product reminder |
| Stopped using a key feature | Short feature walkthrough |
| Abandoned checkout | Cart recovery message |
| Declining sessions | Re-engagement journey |
| High churn risk | Personalised retention offer |
Test one change at a time. If you shorten onboarding and send a win-back message in the same week, you will not know which one moved the number.
Build a First 30 Day Strategy for App Retention
A first-thirty-day retention plan moves through five stages. Get users to real value on day zero, drive activation over the next few days, build habits through the first week, then watch closely for signs of drop-off from day eight onward.
| Timeframe | Focus |
| Day 0 | Get users to their first moment of value |
| Days 1 to 3 | Drive activation of your core feature |
| Days 4 to 7 | Build repeat usage into a habit |
| Days 8 to 14 | Watch for declining engagement |
| Days 15 to 30 | Identify churn risk and re-engage |
Most uninstalls happen in the first week, so this window deserves more attention than the rest of the month combined. By day fifteen, you are no longer preventing an uninstall. You are trying to win back a user who has already lost interest.
How AI and Customer Data Can Help Reduce App Uninstall Rate
Traditional analytics reveal what happened last month. AI and unified customer data shift retention work from reporting what already happened to predicting what is about to happen. Teams move from isolated app events to full customer context, and from scheduled campaigns to actions triggered the moment behaviour changes.
From Reporting Uninstalls to Predicting Churn
A monthly uninstall report tells you what already went wrong. A churn score tells you which users are heading that way while there is still time to act.
From App Events to Complete Customer Context
App behaviour on its own is only part of the picture. Combine it with purchase history, support tickets and email activity, and the same user’s risk level becomes far clearer.
From Static Segments to Dynamic Behavioural Segments
A segment built once and left alone becomes outdated within weeks. A segment that updates as behaviour changes always reflects who is actually at risk today.
From Scheduled Campaigns to Real-Time Retention Actions
A weekly email batch reaches everyone at the same time, regardless of where they are in their journey. A real-time trigger reaches a user the moment their behaviour signals risk.
From Individual Channels to Connected Customer Journeys
Push, email and SMS working separately often repeat the same message or miss the moment entirely. Connected journeys respond to one signal across every channel a user actually checks.
How NVECTA Helps Reduce Your App Uninstall Rate
NVECTA is an AI-powered customer data platform. It connects app behaviour with customer data across every channel, tracks changing engagement patterns, scores churn risk and triggers retention journeys in real time. Teams can step in while a user is still recoverable, not after they have already gone.
Unify App Behaviour with the Full Customer Profile
NVECTA brings app activity together with web behaviour, email engagement, purchase history and support interactions into one profile per user. You get a complete view, not just the picture from app data alone.
Identify Behavioural Signals Before Uninstall
Session frequency, feature usage, inactivity and event sequences all feed into a single view of risk. NVECTA flags the shift early, while there is still room to act.
Predict Users at Risk of Churn
NVECTA scores each user’s churn risk from real behaviour, before the uninstall event happens. That score updates as new activity comes in.
Create Dynamic Segments Based on User Behaviour
A segment like “completed onboarding but has not used the core feature in three days” builds itself and stays current. Users move in and out automatically as their behaviour changes, so the list you act on today is never a month old.
Trigger Real-Time Retention Journeys
The moment a risk signal fires, NVECTA can activate a message across push, email, SMS, in-app or WhatsApp, whichever channel that user actually responds to. It does not wait for the next scheduled send.
Measure Retention Across the Customer Journey
NVECTA closes the loop from behaviour to signal to segment to action, then tracks the result through engagement, retention and revenue. You see exactly which interventions work.
Conclusion
Reducing your app uninstall rate starts before the uninstall happens. Track behaviour, find the friction, spot the risk early, personalise the response and measure what actually affects the uninstall rates.
To attain this, businesses need to choose the right platform that does all these operations and manages the uninstall rates.
NVECTA CDP is built to track every user activity and generate insights, so that teams can act in time to engage users before the uninstall happens.
See how NVECTA turns behaviour signals into timely action to reduce app uninstall rate. Book a demo now.
Frequently Asked Questions
What is app uninstall rate?
App uninstall rate shows the percentage of users who remove the app after install. Teams track it across Day 1, Day 7 and Day 30 windows.
How do you calculate app uninstall rate?
Divide uninstalls by installs for the same period, then multiply by 100. Use a fixed window each time for accurate comparisons.
What is a good app uninstall rate?
A good rate depends on category. Many apps lose near half their users in thirty days. Benchmark against your category and acquisition source, not a single industry average.
Why do users uninstall apps?
Main causes include slow onboarding, poor performance, irrelevant notifications and a mismatch between promise and delivery.
How do I reduce my app uninstall rate?
Shorten onboarding, fix the biggest drop-off points in your funnel, personalise messages around real behaviour and control notification frequency.
Can a CDP help reduce app uninstall rate?
Yes, a customer data platform can help. It brings app, web and support data into one profile, flags early churn signals and triggers retention actions in real time, ahead of the uninstall.
