













 Email
Email SMS
SMS Whatsapp
 Web Push
 App Push
 Audience Sync for Ads
 Popups
 Channel A/B Testing
  Control groups Analysis
 Frequency Capping
 Funnel Analysis
 Cohort Analysis
 RFM Analysis
 Signup Forms
 Surveys
 NPS
NPS Landing pages personalization
  Website A/B Testing
  PWA/TWA
 Heatmaps
 Session Recording
 Wix
Wix Shopify
 Magento
 Woocommerce
 eCommerce D2C
  Mutual Funds
 Insurance
 Lending
  Recipes
  Knowledgebase
 Developer Docs
 Product Updates
 App Marketplace
 Academy
 Ebooks
 Case Studies
 Blog
Blog Templates
 Afreen Sheikh
Collecting data is only the first step; extracting value from it matters more. Businesses prioritise data collection, but when it comes to connecting that data and using it effectively to enhance user experiences, marketing decisions, and product decisions, they often fall short. They work with an incomplete picture and move forward with guesses and assumptions.
The result you see is inconsistent messages, missed opportunities and decisions that create conflicts across teams.
Customer analytics studies data scattered across multiple sources and processes it into insights like what customers do, what they prefer, how engaged they are, and how much value they bring in.
This guide covers-
- What customer analytics means, how it works, its four types,
- common use cases, the data it uses
- The key metrics, and how to choose the right customer analytics platform
- How NVECTA enables customer analytics
What Is Customer Analytics?
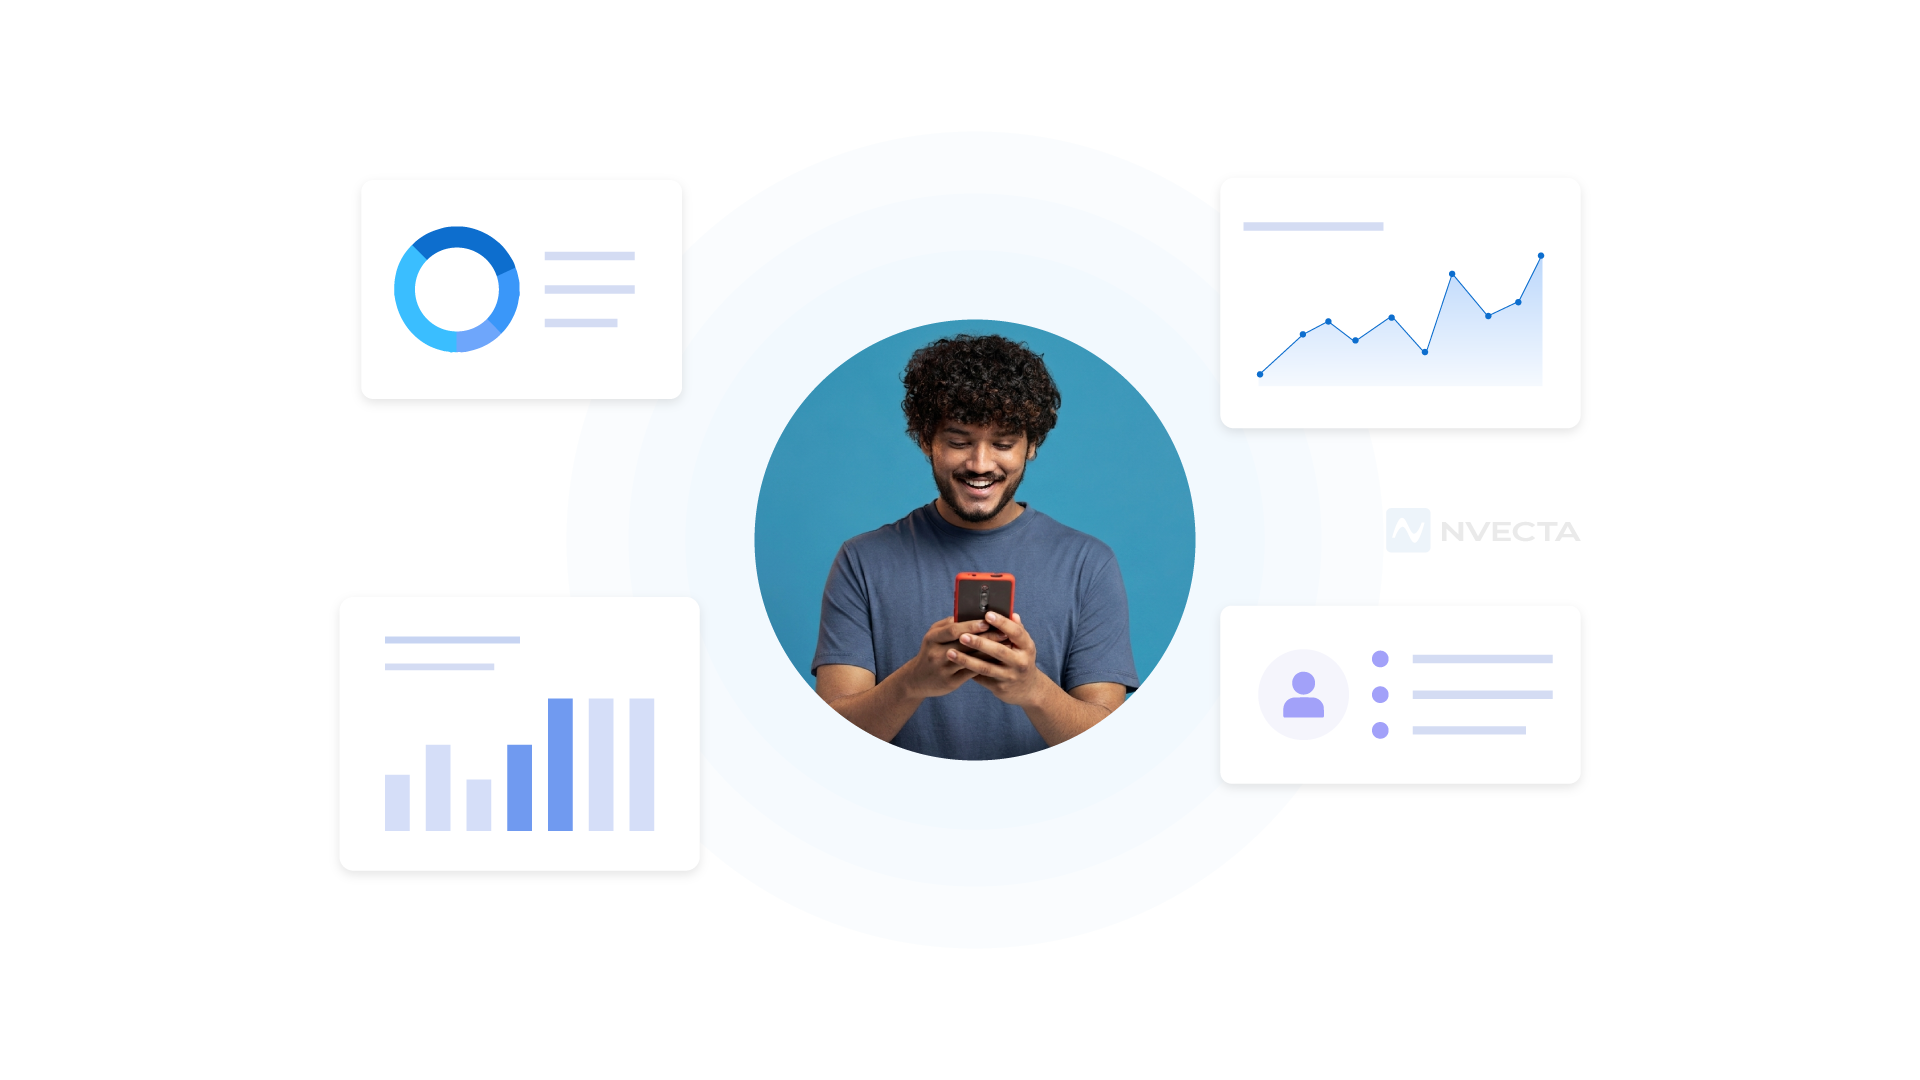
Customer analytics is a process that captures, processes and interprets data to understand customer behaviour, preferences, and expectations. Businesses use these metrics to refine experiences, improve retention, and grow revenues.
Customer analytics evaluates behaviours. It looks at how customers move throughout the journey across various touchpoints, like a website or app, clicks, email opens, etc. It tracks purchases, support requests, email opens, and product usage across every session.
It also finds customer value over time. A complete analysis of purchase history, spread across months or years, shows whether a customer will bring value in the future or is going to leave.
Customer Analytics vs Customer Data
These two terms get mixed up often, even inside data teams. These terms may sound similar, but they are not. Customer data is the raw input, like clicks, purchases, email opens, browsing, or any customer activity, whereas customer analytics is the processing of data to create actionable metrics.
Why Does Customer Analytics Matter?
Customer analytics matters as it resolves many important concerns of marketers, like understanding customer behaviour for better experiences, finding growth opportunities, reducing churn, and improving overall decisions.
Interpret Customer Behaviour
Customer analytics considers every action a customer takes- clicks, purchases, support tickets, responses to messages. It links all these interactions by a customer to find patterns and understand what led to a certain behaviour.
Elevate Customer Experience
Spot problems the customer faces during the customer journey at an earlier stage and optimise those steps to improve the experience. For example, a complex onboarding process or a slow checkout page becomes easy to spot, so that changes can be made.
Retention and Customer Value
Analytics like churn and CLV (Customer Lifetime Value) reveal customers at risk of leaving or who are likely to stay longer. Through these, teams use a retention campaign to deal with higher churn and loyalty engagement for customers who keep coming back.
Improve Business Decisions
Marketing, product, sales, and support teams all use the shared customer insight for their own decisions. This lets decisions be consistent, faster, and more efficient.
How Does Customer Analytics Work?
Customer analytics works through a series of connected steps, where data is gathered, then unified, analysed to create insights, and those insights are used for actions.
1. Collect Customer Data
The first step involves data collection from multiple touchpoints like websites, apps, CRM systems, transactions, ad campaigns, etc. A website shows intent. A CRM shows sales history. A support tool shows friction.
2. Unify Customer Data
Then the collected data is unified to create one customer profile. The records are matched across those systems to build true profiles.
Identity resolution resolves multiple customer identities, so that a single accurate record is made.
3. Analyse Customer Behaviour
Once unified, the system analyses data to find behavioural patterns. Youcan easily see purchase frequency, browsing habits, drop-off points, and engagement trends across weeks or months.
4. Generate Customer Insights
The patterns are then turned into customer insights. These numbers show current trends and associated risks. You can plan campaigns and messaging to optimise the business results.
5. Turn Insights Into Action
Finally, insights are then acted upon. For example, if lower conversion rates appear. Offers, discounts, changes in pricing, or product features are likely actions for better numbers.
Customer Analytics vs Marketing Analytics vs Product Analytics
Customer analytics, marketing analytics, and product analytics all utilise customer data, but each one answers different questions for multiple teams.
Customer analytics looks at the full customer relationship, whereas marketing analytics sees the marketing results from campaigns. Product analytics looks at how users interact with the product or app.
| Area of Comparison | Customer Analytics | Marketing Analytics | Product Analytics |
|---|---|---|---|
| Primary Focus | Understand customer behaviour and value | Measure marketing performance | Understand product usage and adoption |
| Core Question | What do customers do, need, and value? | Which marketing efforts drive results? | How do users interact with the product? |
| Key Data | Customer, behavioural, transactional, and engagement data | Campaign, channel, advertising, and conversion data | Product events, feature usage, and session data |
| Common Metrics | CLV, retention, churn, engagement | CAC, ROAS, CTR, conversion rate | Activation, adoption, retention, feature usage |
How Do They Work Together?
Each type gives teams a different view. Marketing analytics shows which campaign brings customers in. Product analytics shows what those customers do inside a product. Customer analytics joins both views and adds sales, support, and customer data. This gives teams one customer profile and a fuller picture of customer behaviour and value.
What Are the Types of Customer Analytics?
Customer analytics includes the 4 types: descriptive, diagnostic, predictive, and prescriptive. Each type answers different business questions.
Descriptive Analytics
These analytics reveal what happened. Reports and dashboards give purchase history, conversions, engagement and churn. Teams use such insights to assess past customer activity and spot performance trends.
Diagnostic Analytics
Diagnostic analytics explains why something happened. A conversion drop or churn spike needs more than a number. It analyses customer data and identifies the reason behind the shift.
Predictive Analytics
Predictive analytics forecasts what may happen next. AI models use past behaviour to flag churn risk, purchase intent, and customer lifetime value.
Businesses use predictive analytics to anticipate customer needs.
Prescriptive Analytics
Prescriptive analytics gives insights about what action should be taken next. It recommends the next best action for each customer based on current behaviour and intent.
It could be a retention offer, product recommendation, or personalised message that fits the customer journey.
What Does Real-Time Customer Analytics Mean?
Real-time customer analytics tracks live customer activity and updates customer profiles, so that teams can respond quickly when customer intent is still high.
For example, a customer adds items and abandons the cart. This activity is captured in real time, and a personalised message is triggered over the preferred channel.
Common Use Cases of Customer Analytics Industry-Specific
Every industry works on a different sales cycle and customer data. Customer analytics benefits multiple industries-
Ecommerce
- Capture browsing history and cart activity to predict purchase intent.
- Segment shoppers by order value and purchase frequency for precise targeting.
- Find reduced customer visits and abandoned carts for win-back emails.
- Personalise recommendations using live browsing and purchase history
SaaS
- Score product usage data to flag accounts at risk of churn
- Track feature adoption to guide onboarding sequences and upsell timing
- Segment users by usage depth to prioritise customer success outreach
- Use engagement trends to forecast renewal likelihood and expansion revenue
BFSI
- Analyse spending patterns to catch fraud and unusual account activity early.
- Segment customers by life stage to surface relevant product offers
- Use transaction history to score churn risk and credit exposure
- Track digital engagement to guide branch, app, and service investment
Healthcare
- Analyse patient engagement data to cut missed appointments and no-shows
- Segment patients by risk level to guide proactive outreach programs
- Track satisfaction survey data to spot gaps in the care experience
- Use enrollment trends to plan staffing and appointment scheduling ahead of time
Travel and Hospitality
- Forecast guest lifetime value to guide loyalty program investment decisions.
- Personalise offers based on past booking history and stay preferences
- Track engagement across booking channels to reduce abandoned reservations
- Use seasonal demand data to time promotions when guests actually book
What Data Does Customer Analytics Use?
Customer analytics uses behavioural, transactional, and engagement data related to a customer. These data types are a part of the unified customer profile. Marketers clearly see what is happening and what they should do next.
Behavioral Data
Behavioural data covers clicks, page views, and searches. It shows what a customer does at the moment.
Transactional Data
Transaction data covers orders, refunds, and payments. This is where real revenue comes from.
Customer Profile Data
Profile data covers account details and lifecycle stage. It shows if someone is a trial user or a paying one. It shows who the customer is, not just one action.
Marketing and Engagement Data
This data covers email opens, ad clicks, and replies. It shows how one customer reacts to your outreach. Not how the whole crowd performs on average.
Product Usage Data
Usage data tracks feature use and session length. It shows how a customer gets value from your product. You see which features people use daily. You see which ones they skip.
Customer Service and Feedback Data
Support tickets, NPS survey responses, reviews, and ratings show how a customer feels. They express their real emotions.
What are the Key Customer Analytics Metrics You Should Track?
Key metrics measure the current status and performance of strategies. It includes acquisition cost, conversion rate, retention rate, churn rate, lifetime value, average order value, and satisfaction scores. Choose and track the right metrics as per your business goals.
Acquisition Metrics
CAC(Customer Acquisition Cost)– Cost to acquire shows what you spend on one new customer.
Conversion rate measures the share of visitors who have completed a desired action like a purchase or sign-up.
Lead-to-customer ratio shows the percentage of visitors who actually became customers.
A high cost cuts your profit fast. A high conversion rate means your funnel works. A low rate points to friction somewhere in the path.
Engagement Metrics
Active users count (AUC) shows how many people use your product in a set span.
Session count shows how often one person comes back.
Feature use shows which parts of your product people touch.
A high number means customers stay longer. A low number often means the product lacks something.
Retention Metrics
Retention rate shows the share of customers who keep coming back over time.
Churn rate shows the share who walk away.
Repeat purchase rate shows how often a buyer comes back.
A high retention rate means real loyalty. A high churn rate means something drives people out fast.
Revenue and Value Metrics
Lifetime value shows the money one customer brings over time.
Average Order Value (AOV) shows what a buyer spends per purchase.
Revenue per customer shows the average per buyer.
A high lifetime value means customers stay and spend more. A low one means people leave fast, before they spend much.
Customer Experience Metrics
CSAT(Customer Satisfaction Score) reflects how happy a customer is with your product or service or an interaction.
NPS(Net Promoter Score) shows how likely a customer is to recommend your product, services or brand to others.
A high score on either means happy, loyal customers. A low score reflects people who may already plan to leave.
What to Look for in a Customer Analytics Platform?
A strong platform should be equipped with unified customer intelligence, real-time data processing, predictive technology and privacy and consent compliance.
- Unified Customer Data: Bring customer data from all sources under one true profile
- Identity Resolution: Match similar customer identities across devices and browsers.
- Behavioural Analytics: Tracks real funnels, cohorts, and full journey paths.
- Real-Time Analytics: Reacts to a new signal/activity the moment it happens.
- AI and Predictive Analytics: Scores leads and spots churn risks.
- Integrations and Data Activation: Supports easy integration with existing stack and gives warehouse-native data access, so teams can use customer insights across their tools.
- Privacy, Governance, and Scalability: Keeps data secure and ready to grow in future when more data comes in.
How NVECTA Enables Customer Analytics
NVECTA is an AI-powered customer data platform exclusively built to process customer data across sources, analyse it to give accurate insights, and most importantly, use those insights for automated actions. Teams act fast and grow revenue.
Unified Customer Profiles
NVECTA pulls data from your web, app, CRM, and support data into one customer profile. It even resolves multiple identities attached to a single buyer.
Real-Time Customer Analytics
NVECTA reads every click and event the moment it happens. Your team acts while the customer stays interested.
Behavioural Analytics
NVECTA tracks real clicks, pauses, and buys across the full journey. Your team sees true behaviour, so that they can take further actions based on behavioural activity.
Customer Journey Analytics
NVECTA tracks every step a customer takes, from first visit to purchase and later actions. Your team spots exactly where people stick around or leave.
AI-Powered Customer Insights
NVECTA’s AI finds patterns a human team would take weeks to spot manually. Insights show up quickly, so that teams can act in time.
Predictive Analytics
NVECTA spots churn risk and strong buying intent at a much earlier stage. Again, you can grab the opportunity and act with relevant engagement.
Intelligent Customer Segmentation
NVECTA groups customers by real behaviour and value. You can target each group with the right message as per their recent behaviour.
Next Best Action Recommendations
NVECTA even recommends the next best action for each customer, like an offer or a discount, or no message at all. Your team acts, tracks, and measures the action within the platform.
Conclusion
With growing customer expectations, frequent behavioural shifts, more data sources, and complex customer journeys, businesses are dealing with a lot of challenges.
Only Atheright’s customer analytics platform brings customer understanding and builds a steady growth path.
With NVECTA CDP, you can fully use customer data for better experiences, data-driven decisions, and revenue growth.
Enhance customer analytics with NVECTA’s AI-powered intelligence.
FAQs
What is customer analytics in simple terms?
Customer analytics means assessing customer data to see what they do and why. It shows what people buy. It shows who stays and who leaves. Teams use it to spot real patterns.
How are customer analytics different from marketing analytics?
Customer analytics focuses on the relationship between customers and your brand. That means sales, support, and product use. Marketing analytics tracks campaign results like clicks and spend. Marketing shows which channel actually performs. Customer analytics shows who the buyer is.
How does AI improve customer analytics?
AI finds patterns fast across a huge stack of customer data and journeys. It fastens the process to an extent that a human can’t do that in that time span. AI flags churn risk early. It scores leads by real intent. It suggests the next best move for each customer.
Is customer analytics similar to business analytics?
No. Business analytics covers your whole company: finance, supply chain, and daily work. Customer analytics is one part of that view. It looks only at how customers act, spend, and feel. Teams often use both, but each one covers different purposes.
