














 Email
Email SMS
SMS Whatsapp
 Web Push
 App Push
 Audience Sync for Ads
 Popups
 Channel A/B Testing
  Control groups Analysis
 Frequency Capping
 Funnel Analysis
 Cohort Analysis
 RFM Analysis
 Signup Forms
 Surveys
 NPS
NPS Landing pages personalization
  Website A/B Testing
  PWA/TWA
 Heatmaps
 Session Recording
 Wix
Wix Shopify
 Magento
 Woocommerce
 eCommerce D2C
  Mutual Funds
 Insurance
 Lending
  Recipes
  Knowledgebase
 Developer Docs
 Product Updates
 App Marketplace
 Academy
 Ebooks
 Case Studies
 Blog
Blog Templates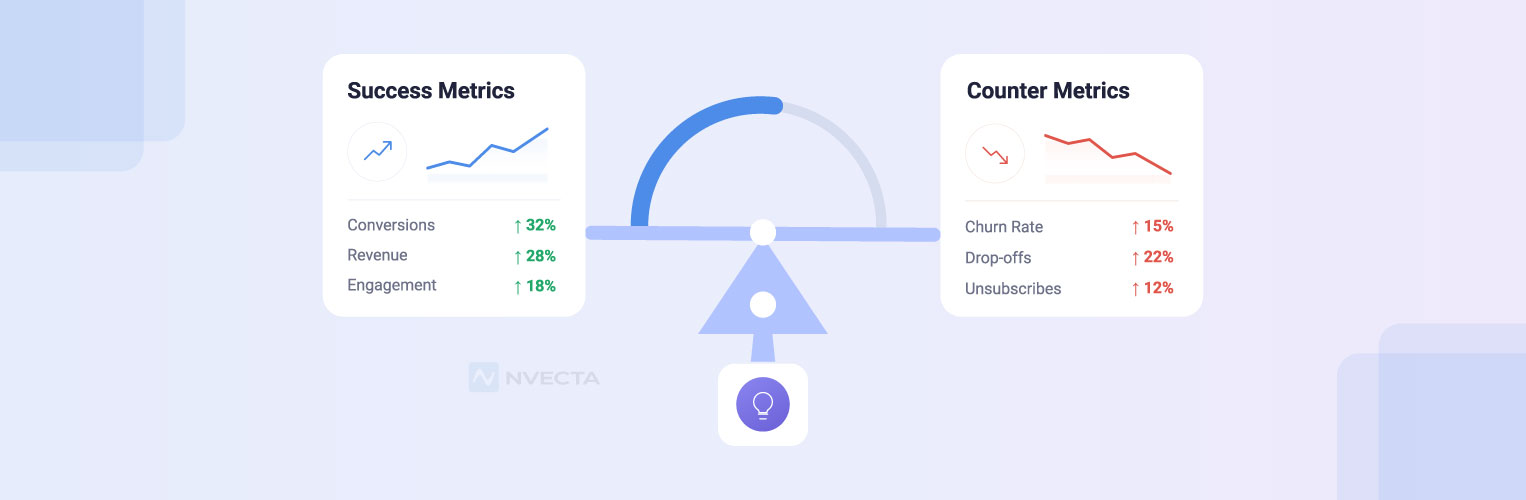
 Aparupa Saha
Most teams track success metrics religiously. Conversion rate went up, click-through improved, revenue per user climbed. Great. But almost nobody asks the follow-up question in the same breath: what got worse to make that happen? Success & counter metrics are how you answer it, and honestly, it’s the difference between a marketing team that reports good numbers and one that actually understands what’s happening to their customers.
NVECTA, an AI-powered customer data platform and engagement platform, builds this kind of paired measurement directly into how brands track performance, because a single metric moving in the right direction rarely tells the whole story.
What Are Success and Counter Metrics?
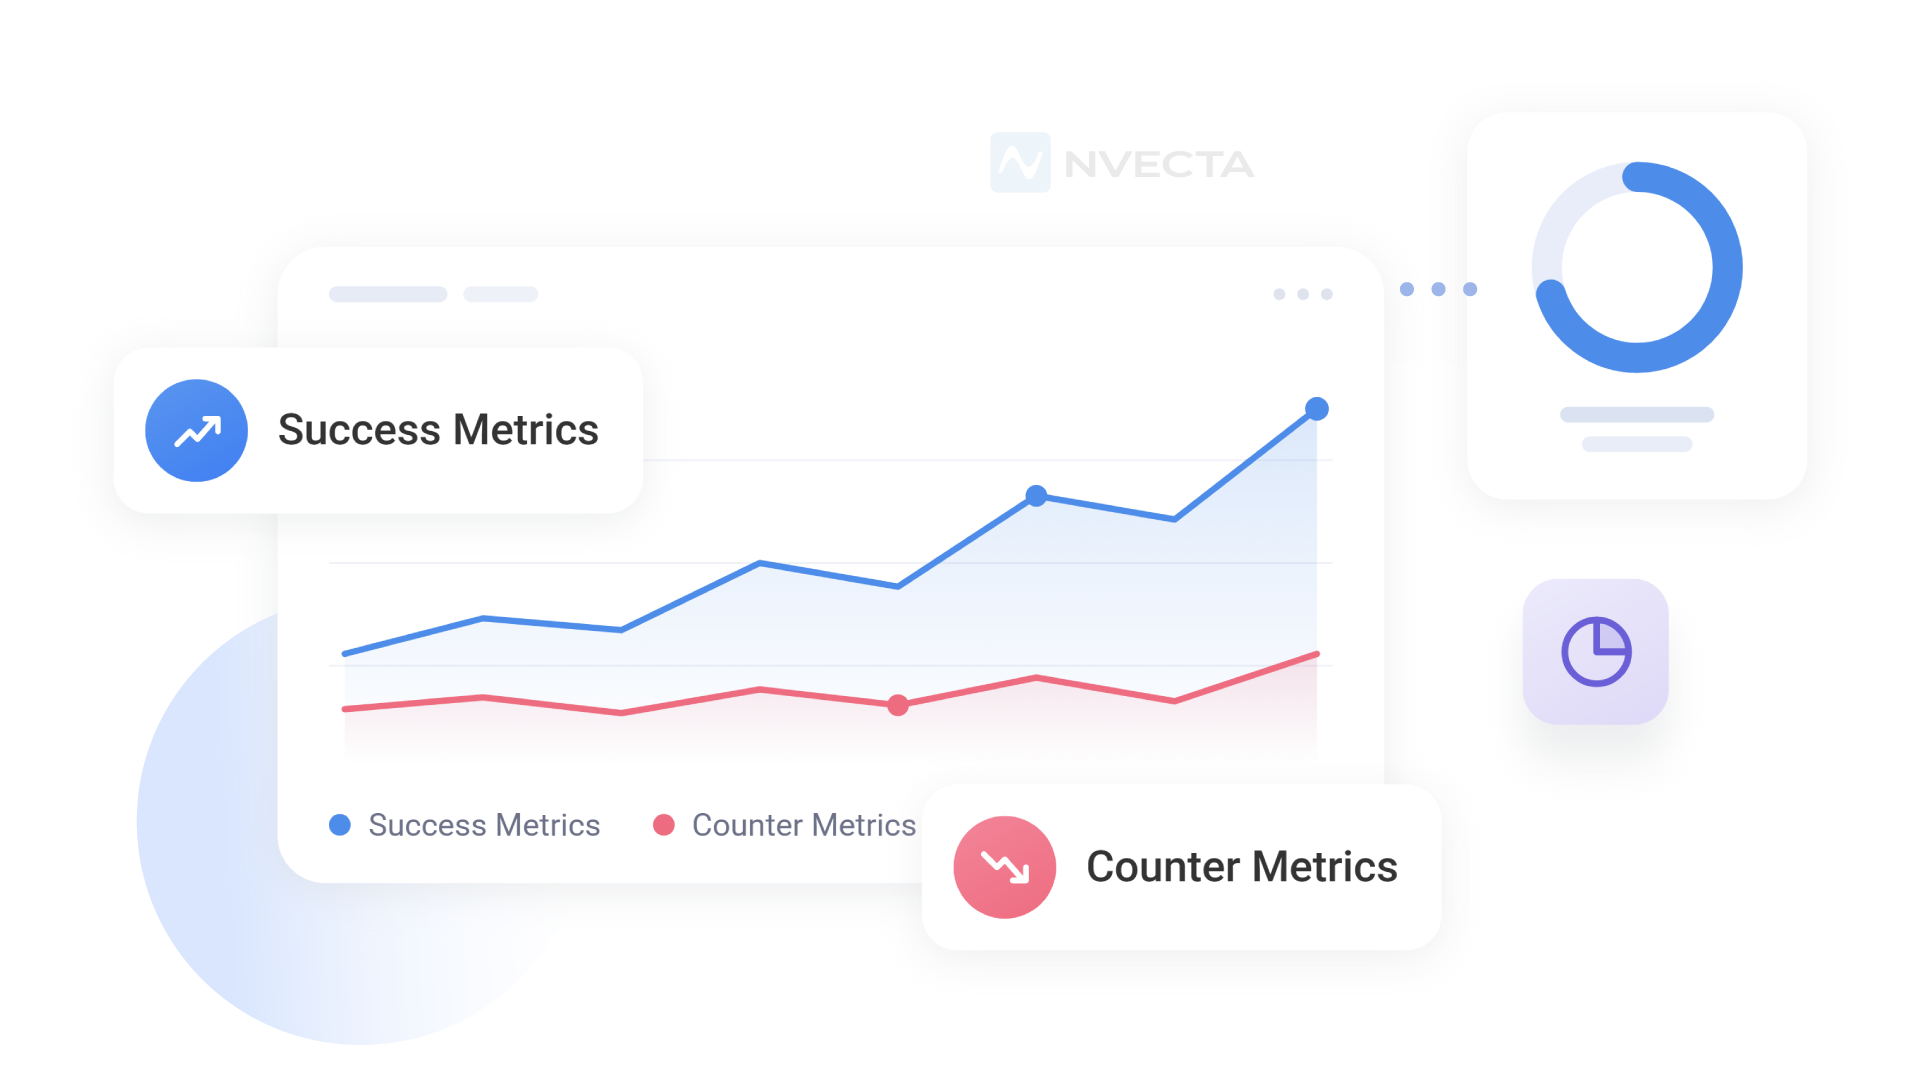
A success metric is the number you’re trying to move. Sign-ups, purchases, app opens, whatever the campaign was built to drive.
A counter metric is the number you’re watching to make sure you didn’t break something else while you were at it. Unsubscribe rate. Support ticket volume. Refund requests. Churn thirty days out.
Think about it this way. If a discount campaign triples short-term conversions but doubles the return rate, was it actually a win? On paper, sure.
In the P&L, maybe not. Teams that only look at the success side of the ledger end up celebrating wins that quietly cost them somewhere else, and by the time that cost shows up, it usually gets attributed to a completely different problem.
This isn’t a new idea in product analytics circles, where guardrail metrics have been standard practice in A/B testing for years. Marketing teams, though, have been slower to adopt the habit, partly because most legacy tools weren’t built to bring the two signals together in one place.
Why Counter Metrics Get Ignored
A few reasons, and none of them are great excuses.
First, counter metrics are often slower to show up. A conversion spike is visible same-day. A dip in your customer retention rate caused by that same campaign might not surface for six to eight weeks, well after the campaign has been marked “successful” and archived.
Second, they usually live in a different dashboard, owned by a different team. Marketing owns conversion. Support owns tickets. Retention owns churn. Nobody’s job is to connect all three back to a single campaign trigger, so the connection just doesn’t get made.
Third, and this one’s uncomfortable to admit: nobody wants to be the person who points out that their own campaign caused a downstream problem. Incentive structures reward the headline number, not the side effects.
Success and Counter Metric Examples
Here’s how this typically breaks down across common marketing and product scenarios.
| Success Metric | Paired Counter Metric | What It’s Protecting Against |
|---|---|---|
| Conversion rate | Return/refund rate | Short-term sales that erode margin |
| Click-through rate | Unsubscribe rate | Engagement gains that burn the list |
| Sign-up rate | 30-day churn | Growth that doesn’t stick |
| Average order value | Cart abandonment on next visit | Upsell pressure that backfires |
| Push notification open rate | Notification opt-out rate | Frequency fatigue driving users away |
| Discount redemption | Full-price purchase rate | Discount dependency |
| Support automation resolution rate | CSAT on automated tickets | Speed at the cost of quality |
None of these pairings is a fixed rule. The right counter metric depends on the channel, the industry, and honestly, on what’s gone wrong at your company before. If unsubscribe rate is your counter metric, it’s worth knowing which email marketing metrics tend to move alongside it, since open and click rates rarely shift on their own.
A BFSI brand watching the loan application completion rate probably needs a counter metric around application quality or default risk, not just unsubscribe rate. An eCommerce brand pushing flash sales needs to watch return rate and full-price cannibalisation, and a round of funnel analysis will usually show you which step the damage is landing on.
How to Build a Success and Counter Metrics Framework
A workable framework usually has four parts.
- Pick one primary success metric per initiative. Not five. One. Trying to optimise for everything at once is how teams end up optimising for nothing. If you already track a wider set of marketing automation KPIs, pick your success metric from that list rather than inventing a new one.
- Assign at least one counter metric before the campaign launches, not after someone notices a problem. If you’re deciding what to watch after the fact, you’ve already lost the ability to catch it early.
- Set a threshold, not just a direction. “Watch the return rate” is vague. “Flag if return rate exceeds 12%, up from a 7% baseline” gives someone a clear trigger to act.
- Review both metrics on the same cadence, in the same room. If success metrics get a weekly standup and counter metrics get reviewed quarterly, they’re not really paired at all. This is also where you find out whether the campaign moved the number that matters, which is the whole point of any attempt to measure marketing ROI properly.
Success and Counter Metrics Example: A Lending Campaign
Say a lending platform runs a campaign to push pre-approved loan offers to a segment of existing customers. Success metric: application completion rate. Sounds good if that number jumps 20%.
But if the counter metric, say approved-to-funded ratio or 90-day default rate, drops at the same time, the campaign didn’t actually create value. It created volume, and volume without quality in lending is a liability, not a win.
Teams that track both signals catch this within the first reporting cycle. Teams that don’t only find out when the numbers surface in a quarterly risk review, and by then it’s a much bigger conversation.
How NVECTA Handles Success and Counter Metrics
NVECTA’s engagement platform ties success and counter metrics together at the campaign level, not as an afterthought bolted onto a separate reporting tool.
When a marketer sets up a campaign through NVECTA’s Marketing Automation or AI Co-Marketer modules, they can define a paired counter metric right alongside the primary goal, whether that’s unsubscribe rate, return rate, or a custom event pulled from the customer data platform.
The AI Agents layer then monitors both signals in real time and flags threshold breaches automatically, so a team doesn’t have to wait for a monthly report to catch a campaign that’s quietly doing damage.
For BFSI and lending clients especially, this pairing matters: NVECTA’s CDP unifies application, funding, and risk data in one place, which means a completion-rate win and a default-rate spike get surfaced together, not three departments and six weeks apart.
Frequently Asked Questions
What’s the difference between a counter metric and a vanity metric?
A vanity metric looks good but doesn’t tie to real business outcomes, like raw impressions. A counter metric is chosen specifically because it can move in the opposite direction when your success metric moves in the right direction. They’re not the same category at all.
Do I need a counter metric for every single campaign?
Not necessarily for small, low-risk tests. But for anything touching pricing, discounts, notification frequency, or financial products, yes, pretty much always.
How do I choose the right counter metric?
Start by asking what could plausibly get worse if this campaign works exactly as intended. That question usually points you straight to the right metric.
Can counter metrics slow down campaign approval?
A little, but that’s kind of the point. A few extra minutes defining a threshold up front beats discovering a problem eight weeks into a bad campaign.
Is this the same as guardrail metrics in product analytics?
Very similar concept, different origin. Guardrail metrics came out of product and experimentation teams; counter metrics apply the same logic to marketing and lifecycle campaigns.
How does NVECTA surface counter metric breaches?
Through the AI Agents layer, which monitors paired metrics against set thresholds and sends alerts when a counter metric crosses its limit, rather than waiting for a scheduled report.
What industries benefit most from this framework?
BFSI, insurance, and lending see the sharpest impact because the cost of an unnoticed counter metric breach, such as a default rate spike, is significantly higher than in most eCommerce scenarios. That said, eCommerce brands running frequent discount campaigns benefit just as much.
