














 Email
Email SMS
SMS Whatsapp
 Web Push
 App Push
 Audience Sync for Ads
 Popups
 Channel A/B Testing
  Control groups Analysis
 Frequency Capping
 Funnel Analysis
 Cohort Analysis
 RFM Analysis
 Signup Forms
 Surveys
 NPS
NPS Landing pages personalization
  Website A/B Testing
  PWA/TWA
 Heatmaps
 Session Recording
 Wix
Wix Shopify
 Magento
 Woocommerce
 eCommerce D2C
  Mutual Funds
 Insurance
 Lending
  Recipes
  Knowledgebase
 Developer Docs
 Product Updates
 App Marketplace
 Academy
 Ebooks
 Case Studies
 Blog
Blog Templates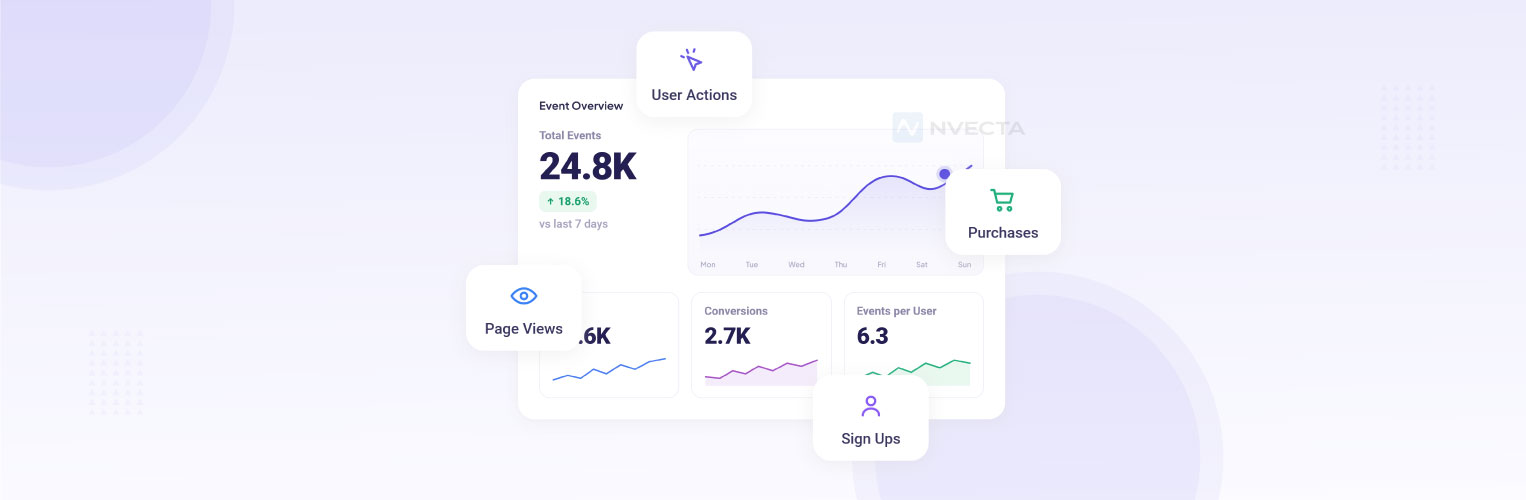
 Afreen Sheikh
Every click, purchase, login, and transaction a customer makes is worth tracking. Each action conveys something to you about how they engage with your product and where the experience can get better.
Most companies collect this data and still can’t answer a basic question: what did the customer do right before they left, bought, or gave up? A retailer sees a cart get abandoned. A bank sees an application drop off mid-form. The click stream that explains why sits unused.
Event analytics fixes that. It tracks the specific actions behind a conversion or a drop-off, whether that’s a product added to cart, a payment step completed, or a login on a new device, so teams can see the path a customer followed.
In this blog, we will cover-
- What event analytics mean, how it works and why it matters
- Benefits, key metrics, common industry-specific use cases
- And finally, how NVECTA CDP enables event analytics
Key Takeaways
- Event analytics tracks specific user actions and their behavioural traits, not just traffic or page views.
- A clean event taxonomy is what separates useful analytics from a stack of unusable data.
- Product, marketing, and customer success can all run on the same event data instead of separate reports.
- NVECTA turns event streams into automated segments and churn predictions in real time.
What Is Event Analytics
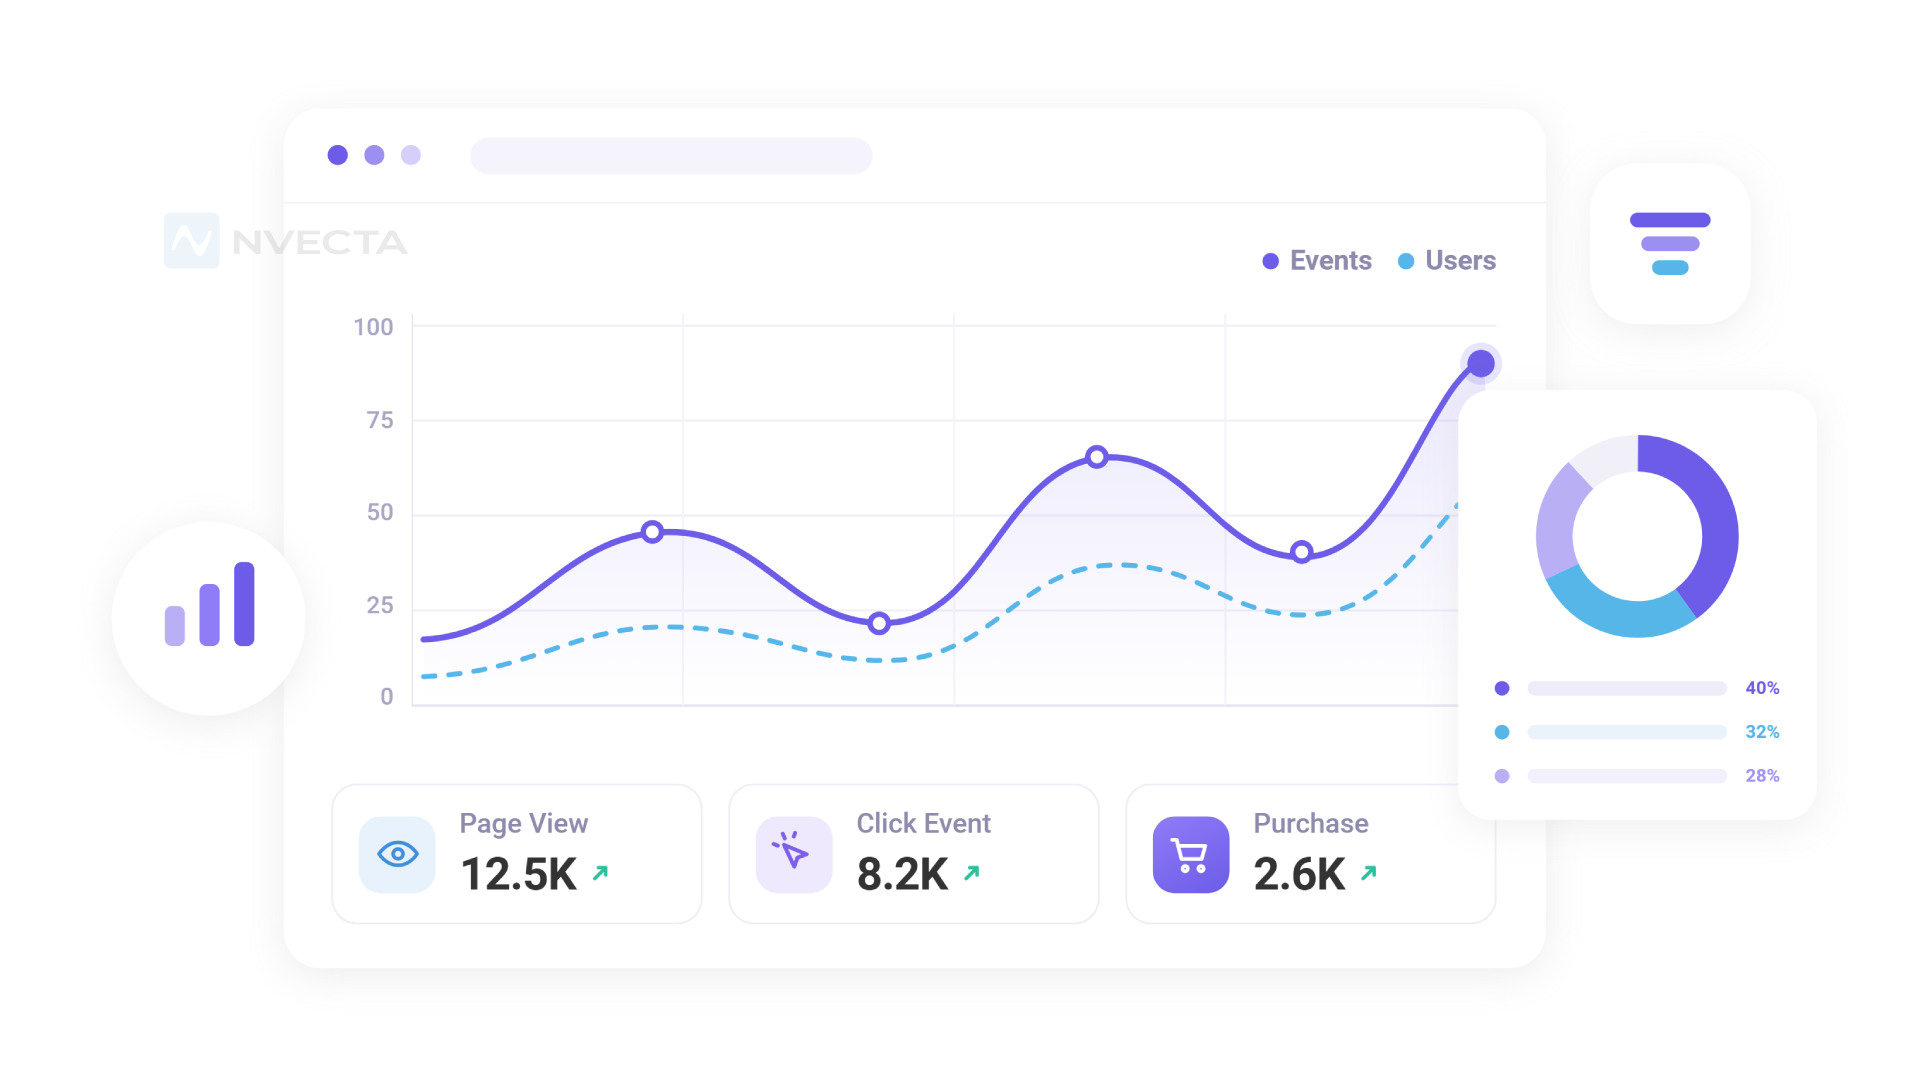
Event analytics is a method that tracks and analyses customer actions, also called events, across digital and offline touchpoints to identify how customers interact and what led to such action. A signup, a button click, a plan upgrade, a cart addition: each one is an event.
Every customer action has a purpose and is a step in the customer journey. Individually, these events give limited value, but together they reveal the path a customer followed before they converted, left or returned.
Event analytics connects these interactions into insights that serve two things: to understand customer behaviour and make data-driven decisions when it comes to retention, conversions and personalisation.
Event analytics evaluate the sequence of customer actions rather than displaying traditional analytics that focus on aggregate metrics like page views or sessions. Such an approach answers crucial business questions like-
- Which actions lead to conversions?
- Where do customers leave the journey?
- Which features encourage repeat usage?
- Which campaigns generate meaningful engagement?
- Which behaviours indicate purchase intent or churn risk?
Types of Customer Events
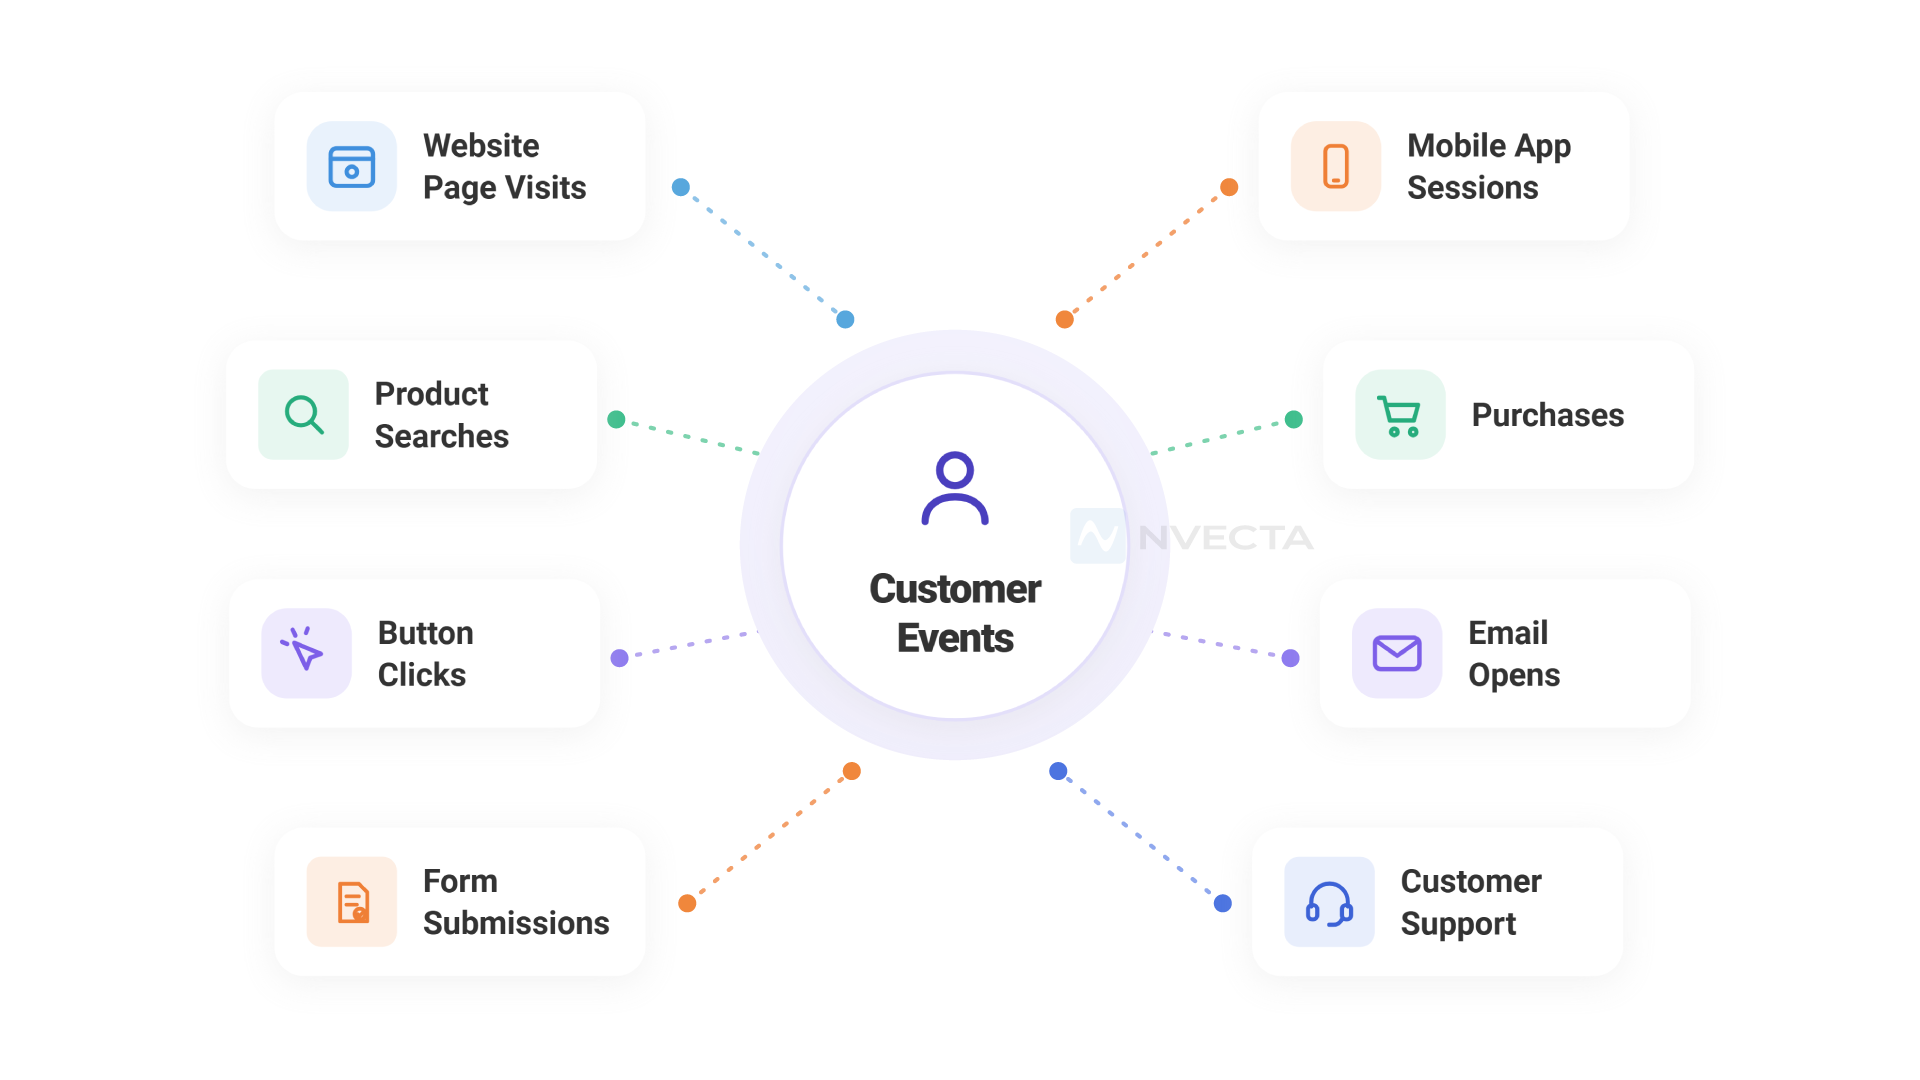
The most common events include:
- Website page visits
- Product searches
- Button clicks
- Form submissions
- Mobile app sessions
- Product feature usage
- Purchases
- Subscription renewals
- Email opens
- Customer support requests
Why Event Analytics Matters
Event analytics matters as it replaces the usual guesswork and assumptions with real insights, so that teams can find what customer actions lead to conversion, churn or growth. They can even act quickly instead of waiting for an effect on revenues.
Understand Customer Intent
Instead of assuming why a customer churned, teams can trace the exact series of actions that came before it. Decisions are built on what customers actually did, and not on any assumption.
Early Churn Prediction
A drop in a core event, like a frequent buyer stopping purchases or a drop in the usage of an app feature, becomes an early warning sign for churn well before a complete disenagemnet or cancellation request arrives. That lead time gives support and success teams the chance to step in and engage such users who are on the verge of disenagement.
Event Data Drives Revenue Attribution
Once a business knows which actions inside the product precede an upgrade, it can design the experience to guide more customers toward those same actions. That link is a direct lever for expansion revenue and net revenue retention.
A Unified Customer Profile Aligns Every Team
Product, marketing, and customer success can work from the same event data instead of using separate, conflicting reports. A shared view speeds up decisions and cuts down on debate over whose numbers are right.
Event Analytics vs Product Analytics vs Customer Journey Analytics
Event analytics is the foundation layer. Product analytics and customer journey analytics are two different lenses used to read that same layer.
Product analytics answers questions related to a single product like which features get used, where users drop off in a flow, and how a cohort’s retention curve looks in its first ninety days. Customer journey analytics shows the past data related to the product, connecting events across email, ads, support, and billing into one continuous timeline per customer.
| Category | What It Tracks | Best For |
| Event Analytics | Individual user actions and properties | Raw behavioural data collection |
| Product Analytics | Feature usage and engagement within a product | Improving product decisions |
| Customer Journey Analytics | Behaviour across channels and touchpoints over time | Understanding the full customer lifecycle |
Here’s the part teams miss: none of these operates without the other two. A retention curve in product analytics is built from event data. A customer journey timeline is a string of events connected across channels. Choose your metric based on the question you’re trying to answer, as each serves different purposes.
How Event Analytics Works: Step by Step
Event analytics runs as a continuous loop, not a one-time setup. Each new interaction adds context, refining how accurately you understand and respond to customer behaviour.
Collect Customer Events
Collect real-time customer interactions across touchpoints such as a click on your website, a tap in the app, a call logged in the CRM, a payment cleared, a support ticket opened. Collecting all of it under one shared event schema is what turns scattered data into a single, usable record.
Build Unified Profiles and Resolve Identities
Customer events then get logged into one customer profile. Such profiles capture interactions a customer does over multiple devices and channels. With identity resolution, there is only one true profile of a single customer, and every action is updated onto the respective profile.
Analyze Customer Behavior
Once everything is into one profile, customer events are analysed, and patterns start showing up like where a journey stops, which paths lead to a sale, which cohorts stick around, and which quietly fade. This is where a business stops reacting to churn and starts spotting it early.
Activate Customer Insights
None of this matters if it stays trapped in a dashboard. Activation is what turns a pattern into an action. Use insights to build targeted customer segments, adjust an onboarding flow, or send a message the moment a customer shows real intent, etc.
Key Benefits of Event Analytics
These are the outcomes teams see once event tracking is set up well.
Retention improves because you can act early.
Behavioural drop-offs appear at an early stage, giving teams a lead time measured in weeks instead of getting a cancellation email with no warning.
Roadmap decisions get cheaper to make
Teams stop building features on a hunch and instead build around what usage data already confirms users want.
Support and success teams work less.
A dip in a core usage event routes an account to outreach before it turns into an angry ticket or a lost renewal.
Marketing targets behaviour, not guesses
Design marketing campaigns to target user behaviour and see an increase in conversion and retention rates.
Better predictions
With Historical event patterns and real-time user activity, the system gives better predictions about users who are likely to convert or churn.
Event Analytics Use Cases Across Industries
Event analytics answers a different question depending on the business asking it. Here’s what it solves across five industries.
Ecommerce
- Product discovery: Browse and search events show what shoppers actually want before they ever add to cart.
- Cart abandonment: A Cart Abandoned event catches a sale before it’s lost for good.
- Repeat purchases: Back-to-back category purchases flag loyalty forming in real time.
SaaS
- Feature adoption: Usage events show which features earn their place in the product.
- Activation: One key event predicts which trial users are about to convert.
- Retention: A dip in core usage events warns of churn weeks before cancellation.
- Power users: Heavy usage events flag accounts ready for expansion, not just support.
Banking and Financial Services
- Digital onboarding: Drop-off events show exactly where an application stalls.
- Transaction journeys: Sequenced events separate routine banking activity from something worth a second look.
- Fraud signals: A new device event paired with a large transfer flags risk instantly.
Healthcare
- Appointment booking: Event Scheduling tool reveals where patients abandon the booking flow.
- Patient engagement: Reminder and follow-up events show who’s staying on track and who’s going quiet.
- Portal usage: Login and activity events show whether a portal is actually being used.
Travel and Hospitality
- Booking journeys: Step-by-step booking events show exactly where travellers hesitate.
- Loyalty: Repeat booking events predict who’s likely to come back.
- Upselling: In journey events, flag the right moment to offer an upgrade.
Event Analytics Metrics You Should Track
These metrics turn raw events into numbers a team can act on and report against.
| Metric | What It Measures | Why It Matters |
| Activation rate | Share of new users completing a defined first value action | Shows whether onboarding works |
| Feature adoption rate | Share of users engaging with a specific feature over time | Tells you if a release earned its place in the product |
| DAU/MAU ratio | Daily active users divided by monthly active users | A direct read on how sticky the product is |
| Retention rate | Share of users still active after a set period | The clearest signal of long-term product value |
| Time to value | Time between signup and a user’s first meaningful outcome | Shorter times usually mean stronger onboarding |
Track these on a recurring cadence, weekly or monthly depending on your usage volume. A single snapshot tells you whether your strategies are working or not. A trend line tells you whether things are improving.
How NVECTA Enables Event Analytics
NVECTA CDP turns raw event data into a live, unified view of every customer, then uses those captured events to generate insights that support across marketing, product, and sales with manual efforts.
Capture Events in Real Time
Every click, transaction, and login, from web, mobile, app, or a branch and call centre, is captured the moment it happens, with its properties and identifier attached. That’s the event data everything else runs on.
Build Dynamic Segments From Customer Events
A segment groups customers who share a behaviour. NVECTA rebuilds those groups the instant a tracked event changes, moving a customer into a new segment automatically, without anyone touching a spreadsheet.
Predict Customer Intent From Event Patterns
NVECTA scores churn risk and buying intent from the sequence of events in a profile, not the latest one. A single page view means little. Repeat visits and a paused checkout together mean far more.
Recommend the Next Best Action
A predicted score matters if it leads to an action. NVECTA pairs a customer’s event history with the action most likely to move them forward: an offer, a follow-up, a nudge, not a guess.
Trigger Journeys From Customer Events
A single event- a cart abandoned, an application stalled, a login from a new device- can start a journey across email, SMS, ads, or an in-app message, without anyone setting it up by hand.
Turn Event Data Into Customer Intelligence
Every capability above updates the same underlying profile. Each event resolves through one identity graph and adds to what NVECTA already knows about that customer, governed by PII controls from the point of collection onward.
Conclusion
Event analytics is how teams read what customers actually do, not what they say they will do in a survey. Its value depends on the setup: a clear event taxonomy, consistent tracking, and metrics tied to real business questions.
NVECTA handles the collection, identity resolution, and activation layer, so your team spends time acting on the data instead of wrangling it.
Want to see what your own event data reveals? Book a demo now.
Frequently Asked Questions
What is event analytics in simple terms?
It’s tracking specific actions users take in a product, like a click or a purchase, so you can understand behaviour instead of guessing at it.
What is the difference between event analytics and web analytics?
Web analytics tracks where traffic comes from and which pages get visited. Event analytics tracks what a user does once they’re there.
How do I build an event taxonomy that won’t fall apart?
Start with a short list of events tied to real business questions, agree on one naming convention across teams, and document each event’s properties before anyone starts tracking.
How does event analytics help reduce churn?
It catches a drop in core usage well before a cancellation, giving your team time to reach out instead of finding out after the fact.
Is event analytics part of a customer data platform?
Yes. A CDP like NVECTA uses event data as one of its core inputs, combining it with other customer data for a single, complete profile.
