














 Email
Email SMS
SMS Whatsapp
 Web Push
 App Push
 Audience Sync for Ads
 Popups
 Channel A/B Testing
  Control groups Analysis
 Frequency Capping
 Funnel Analysis
 Cohort Analysis
 RFM Analysis
 Signup Forms
 Surveys
 NPS
NPS Landing pages personalization
  Website A/B Testing
  PWA/TWA
 Heatmaps
 Session Recording
 Wix
Wix Shopify
 Magento
 Woocommerce
 eCommerce D2C
  Mutual Funds
 Insurance
 Lending
  Recipes
  Knowledgebase
 Developer Docs
 Product Updates
 App Marketplace
 Academy
 Ebooks
 Case Studies
 Blog
Blog Templates
 Afreen Sheikh
Most businesses today work with a simple sales report that shows what was closed last month, and nothing more. That report cannot explain why one deal closed, and an identical deal stalled. It cannot show the finance team which customer segment is about to churn, or the marketing team which channel converted buyers. It just shows the impressions.
One of the bigger challenges in 2026 is that customer journeys stretch out across more channels and more people. A single customer does multiple actions over different channels and devices. Like a customer may click an ad, sign up for a trial, go silent for two weeks, and only convert after a support call resolves their doubts. Each activity forms a part of the revenue path, but most businesses only ever see a few signals with traditional manual reporting methods.
Revenue analytics solves that by bringing in all of those signals to form one connected view of the business. Where a business previously had five teams working from five different spreadsheets, revenue analytics unites them to track how revenue enters the business, slows down, and quietly leaks out.
This guide covers-
- What revenue analytics is, why it matters, how it works, and its core metrics
- Its use cases across industries, common challenges, and how to choose the right platform
- How NVECTA enables revenue analytics
What Is Revenue Analytics?
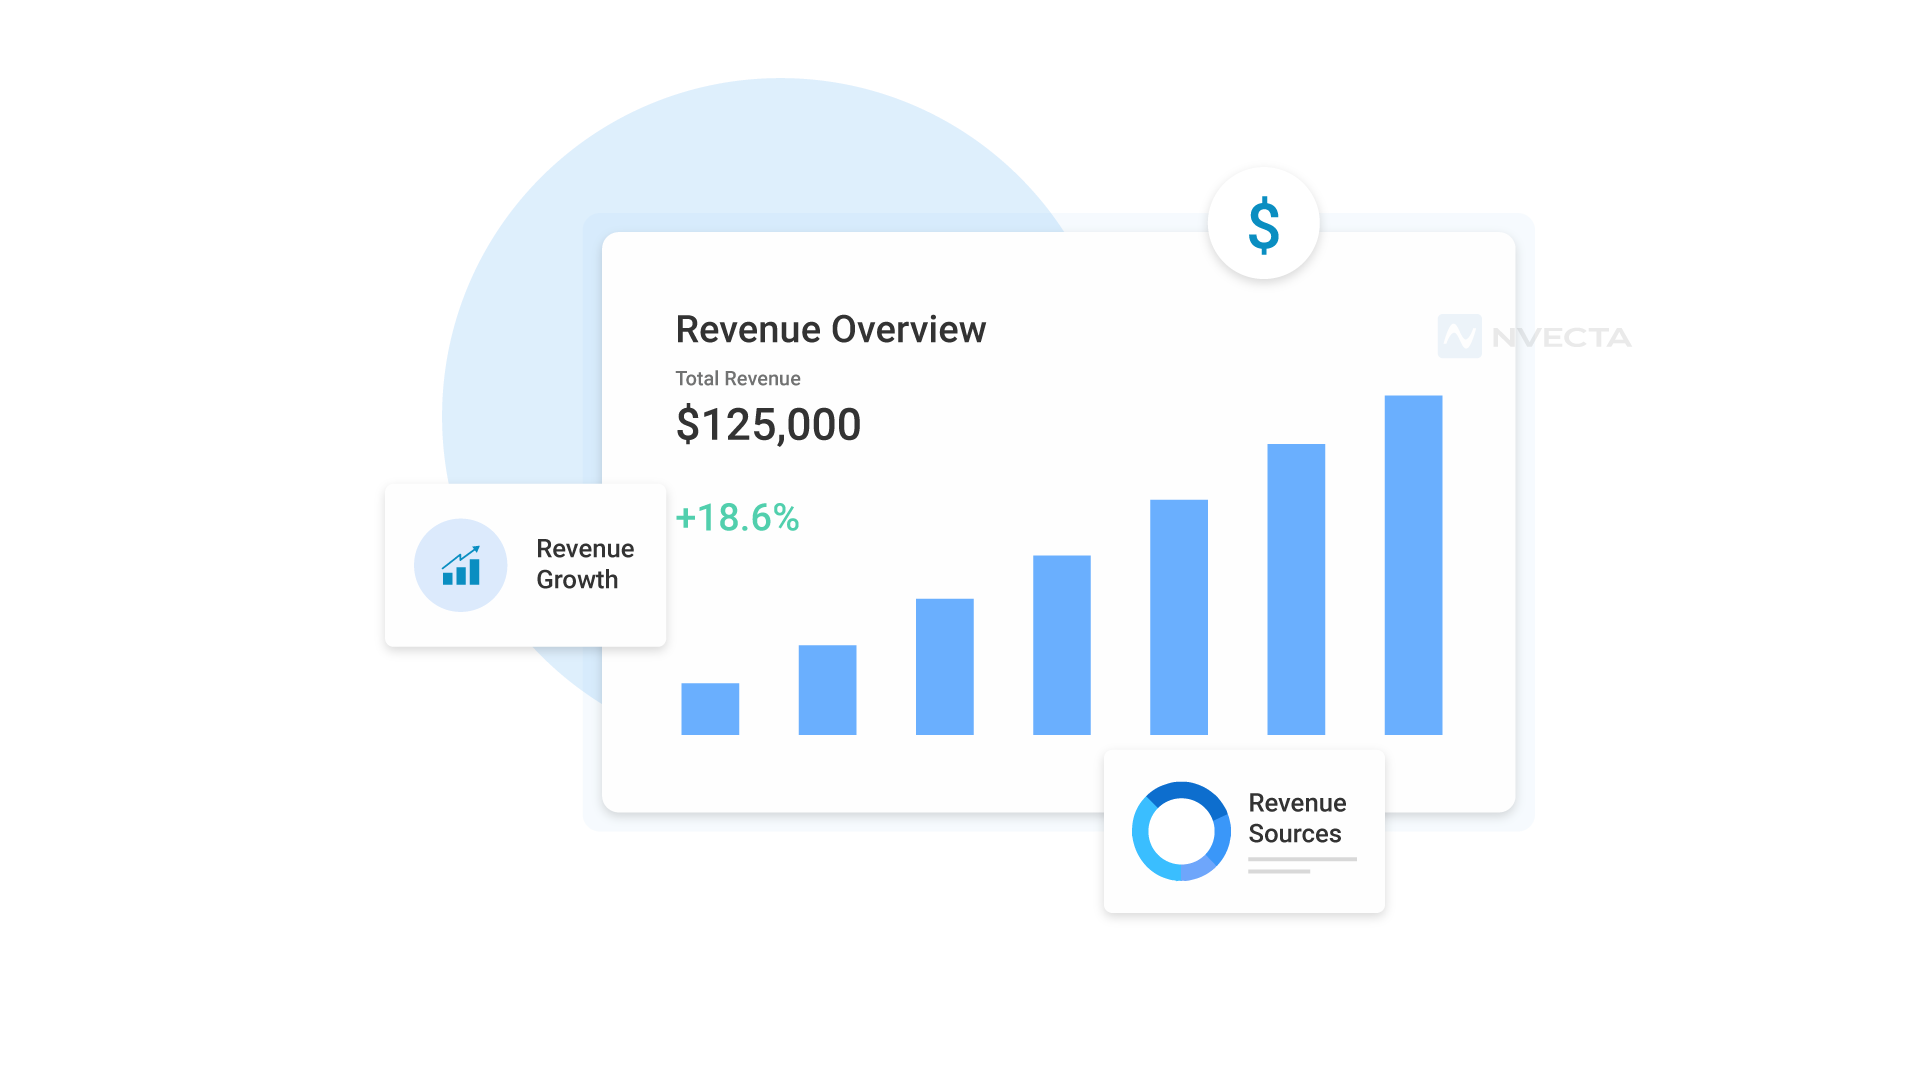
Revenue analytics involves collecting and analysing revenue operations to improve profitability and growth over time. It includes every activity that touches revenue, like sales calls, product use, ads, and support chats, etc. It lets teams identify which segment or channel brings in more customers, customers who engage often or customers who are about to leave.
It reviews the historical revenue data along with the real-time reporting and applies predictive modelling, so that businesses can spot revenue leakages and what leads to them. Teams take actions like changes in pricing, discounts, offers, sales execution, and retention strategies to increase revenues.
It includes tracking metrics like MRR and ARR, Customer Lifetime Value, Customer Acquisition Cost, LTV-to-CAC ratio, Churn Rate, Net Revenue Retention, Revenue Per Segment, and Pipeline Velocity and Conversion Rate.
Revenue Analytics vs Customer Analytics vs Product Analytics
Revenue analytics reveals where money comes from, what drives sales, and which customers add the most value. Customer analytics looks at who buyers are, what they purchase, and what brings them back. Product analytics tracks how people use a product, which features get used most, and where users drop off.
| Revenue Analytics | Customer Analytics | Product Analytics |
| Measures revenue and its key drivers | Analyses customer behaviour and preferences | Measures product use and feature performance |
| Shows revenue trends, sources, and gaps | Shows customer segments, needs, and patterns | Shows feature adoption and drop-offs |
| Helps spot revenue opportunities and risks | Helps improve targeting, retention, and personalisation | Helps improve product experience and adoption |
| Uses revenue, transaction, customer, and channel data | Uses customer profile, purchase, and engagement data | Uses product events, sessions, and feature data |
Why Revenue Analytics Matters in 2026
Revenue analytics connects customer behaviour with revenue. That link shows a business what drives sales, what a customer is worth, and why buyers return.
- See what drives revenue: Customer actions, purchases, and revenue connect across the full buyer journey, so a team can spot which touchpoints matter most.
- Find high-value customers: Spot buyers who spend more, purchase often, and stay loyal. Cross-sell, upsell, and repeat purchase opportunities are easy to locate.
- Find growth chances: Spot cross-sell, upsell, and repeat purchase opportunities through customer data.
- Create better experiences: Use revenue and customer data for relevant offers and messages.
- Reduce revenue loss: Spot churn signals, low activity, and a drop in purchases before an actual revenue fall, while a team still has time to act.
Core Revenue Analytics Metrics Businesses Should Track
These are the numbers that show if revenue is healthy or at risk.
MRR (Monthly Recurring Revenue) and ARR(Annual Recurring Revenue)- Monthly and yearly recurring revenue show the steady income a business can count on. A rising number looks good on its own. Break it into new, expansion, and lost revenue. That gives you the real story.
Customer Lifetime Value (LTV)- Lifetime value shows the total money a customer brings over the full relationship. The focus shifts from one sale toward the long-term value a business gets when that customer stays.
Customer Acquisition Cost (CAC) and LTV to CAC ratio – CAC shows what it costs to acquire a customer. Compare it to LTV to see which buyer was worth the cost. A ratio under 3 to 1 means a business spends too much for too little return.
Churn rate and net revenue retention- Churn shows how much money a business loses over a specific period of time. Net revenue retention shows if growth from current buyers beats that loss. A business can lose buyers and still grow if retention and expansion stay strong.
Revenue per segment -Not every buyer group earns the same. Split revenue by plan, industry, or channel. You will see which groups deserve more focus, and which ones drain resources.
Pipeline velocity and conversion rate- Velocity shows how fast deals move from first touch to close. Conversion rate shows what share of deals turn into real money. Together, they show where deals slow down or stall.
How Revenue Analytics Works
Revenue analytics uses a systematic step-by-step workflow so that raw data becomes useful and appropriate action can be taken. From raw data to real action.
Collect data to create unified customer profiles.
Bring CRM, product usage events, billing history, marketing data, and procurement tools like Suplari Spend Analytics into one place to create a unified financial and customer profile. Data from every touchpoint, across devices, is linked to the same person and duplicate identities are resolved, so accurate profiles are formed.
Create segments and evaluate behaviour patterns.
Sort customers by value, risk level, or lifecycle stage, then build models that predict what each group is likely to do next.
Track metrics against real business goals
Set clear targets for the numbers that matter most, and check in often, not just once a quarter when it is too late to adjust course.
Show what is likely to happen next, before it happens. This is where predictive models flag a customer who is about to churn or a deal that is about to stall, while there is still time to act on it.
Turn insight into action right away.
Push that insight into a campaign, an alert, or a task inside the tool a rep already uses daily, rather than a waiting slide inside a quarterly deck that nobody reopens.
Missing any of these steps weakens everything that follows. Poor identity matching in step two, for example, means every single metric calculated afterwards measures the wrong group of people entirely.
Revenue Analytics Across Different Business Types
Revenue analytics helps each business model track the numbers that matter most. The right metrics change with each model, since SaaS earns through subscriptions, ecommerce through purchases, and marketplaces through transactions and commissions.
SaaS and subscription businesses
Revenue here repeats every month, so keeping it matters most. Teams track MRR, expansion revenue, and early churn signs, like a drop in product use.
Ecommerce and retail
Revenue comes from one-time customers and repeat customers. The focus shifts to order size, repeat rate, and how each channel adds to sales.
Travel
Revenue mixes one-time bookings with ongoing plans. Teams need one view across bookings, use, and renewals. That view helps catch churn before a buyer switches to a competitor.
Common Revenue Analytics Challenges and How to Avoid Them
Analytics are affected mainly because of two reasons: when the data lacks quality and is scattered across different touchpoints.
Data Quality and Accuracy
Bad data gives teams wrong revenue numbers and weak insights. Duplicate, missing, or old customer records also create a false picture of revenue and customer value.
How to avoid-
- Check data quality at each source.
- Remove duplicate and old records.
- Fix missing customer details.
- Set clear data rules.
- Review data quality on a regular basis.
Data Silos
Customer and revenue data often live in separate CRM, billing, ecommerce, and marketing systems. Lative addresses that gap by pulling CRM, billing, and marketing data into a single planning model, so RevOps sees one version of pipeline, capacity, and forecast instead of three that disagree. Teams then see pieces of the customer story instead of one clear picture.
How to avoid
- Bring customer data into one place.
- Connect CRM, billing, ecommerce, and marketing data.
- Match customer records across systems.
- Set shared data rules across teams.
- Give every team one clear customer view.
How to Choose a Revenue Analytics Platform
Choosing the right revenue analytics platform requires you to test it against certain feature requirements. Let’s see those in detail-
Easy data integration
Ask the vendor if the platform works on top of your data warehouse, or if you should copy and move your data. Look for easy integration and setup processes.
Real-time data processing
Can the platform process data in real time, or only on a set schedule? See that it updates live data.
Built-in AI
You must ask for AI features and whether they provide it built-in or charge extra for it.
Easy-to-use interface
See that the platform has an easy interface, so that teams can use it without any complex technical training.
Cross-team access
Pick a platform that supports access to shared revenue data across sales, marketing, product, and customer success teams.
Revenue Analytics With NVECTA
NVECTA is an AI-powered customer data platform that enables revenue analytics for various industries. It unifies sales, product, and customer data in one place. Teams track revenue and catch risk early. They act on real numbers, not guesses spread across five tools.
Unified Customer Profiles
NVECTA links every touchpoint back to one customer record. That means web visits, purchases, and support calls all connect. Sales, marketing, and finance read the same revenue number.
Real-Time Revenue Insights
Revenue numbers update the moment a deal closes, not once a month. A team spots a slowdown right away and reacts while the fix is still cheap.
Revenue Attribution
Every campaign and sales touch links back to the deal it helped close. Marketing finally sees which channel earns real revenue, and which one just burns budget.
Segment Revenue Analysis
Split revenue by plan, industry, or channel. Winners and losers show up fast this way. A team can shift budget toward what pays off.
Customer Journey Analytics
NVECTA maps the full path a buyer takes before they pay. That means every step, from the first ad click to the signed deal. Teams see exactly which steps drive revenue.
AI-Powered Revenue Insights
NVECTA reads through sales, product, and support data on its own. It flags patterns a person would likely miss. A rep gets a clear reason behind every number, not just a total.
Predictive Signals
NVECTA scores every account on its odds to expand, renew, or churn. These scores update before any of it shows up in a report. Teams step in early, while a deal can still be saved.
Direct Customer Activation
Spot a risky account, and NVECTA can trigger the next step right away. That might be an email, a discount, or an alert to a rep. No handoff between separate tools, no delay.
Warehouse-Native CDP
NVECTA reads straight from a business’s own warehouse. That could be Snowflake, BigQuery, or Redshift. Nothing gets copied or duplicated, so revenue numbers stay accurate and come from one single source.
Conclusion
Revenue analytics turns scattered numbers into a clear read on what drives growth. It shows where revenue comes from. It spots revenue risks in real time and gives actions to stabilise and expand it.
Most businesses are still busy manually connecting revenue data from five different tools. NVECTA links that data into one system, turning raw activity into smart AI insights that show the way to act in time.
Connect customer data, spot revenue opportunities, and grow with NVECTA.
Book a demo today.
Frequently Asked Questions
What is revenue analytics, in plain terms?
Revenue analytics tracks data related to sales, products, and customers to form insights on how a business earns revenue and where it can grow. NVECTA brings all of that into one live, comprehensive view for every team.
How is revenue analytics different from financial reporting?
A finance report reflects what revenue came in last month. Revenue analytics shows why it came in, which segment drove it, and what is likely to happen next quarter.
What tools are used for revenue analytics?
Most businesses use a combination of CRM, a data warehouse and a BI tool. Some now replace all three with one AI-driven CDP platform. With NVECTA CDP, you get all the features of these 3 platforms so that you can see accurate revenue analytics.
What is the meaning of revenue attribution?
Revenue attribution links a sale back to the marketing touch, sales call, or campaign that helped close it. It shows a business which channels or segments bought customers and revenues.
How do AI features enhance revenue analytics?
AI models score churn risk and purchase intent for every customer, then update those scores as new data arrives. NVECTA uses this to flag risk early, before it shows up in a report.
