


 Email
Email SMS
SMS Whatsapp
 Web Push
 App Push
 Popups
 Channel A/B Testing
  Control groups Analysis
 Frequency Capping
 Funnel Analysis
 Cohort Analysis
 RFM Analysis
 Signup Forms
 Surveys
 NPS
NPS Landing pages personalization
  Website A/B Testing
  PWA/TWA
 Heatmaps
 Session Recording
 Wix
Wix Shopify
 Magento
 Woocommerce
 eCommerce D2C
  Mutual Funds
 Insurance
 Lending
  Recipes
  Product Updates
 App Marketplace
 Academy
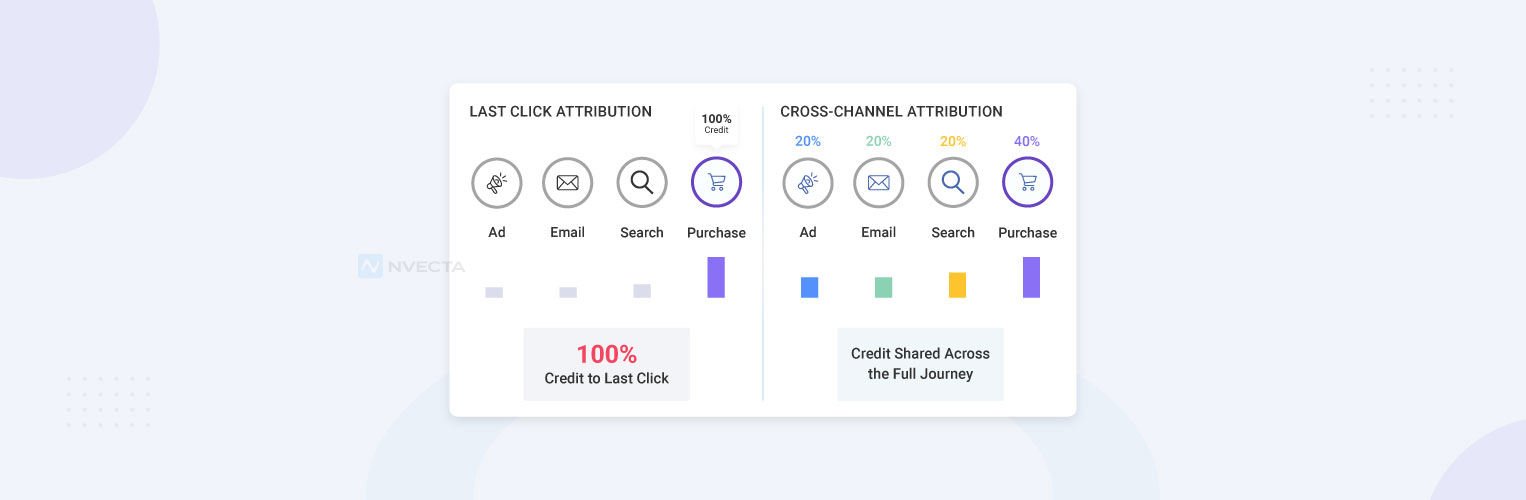
Last-click attribution gives 100% of the credit to whatever channel closed the sale. That sounds fair. It isn’t. In a world where a customer sees your Instagram ad, reads your blog, gets retargeted, opens an email, and only then searches your brand on Google, last click rewards the easy win and ignores the hard work that set it up.
This post walks through what attribution modelling actually is, why marketers are moving past last click, the main models you can use, the tools that help, and the mistakes that quietly drain budget.
Quick answer: What is Cross-Channel Attribution Modelling?
Cross-channel attribution modelling is how you decide which marketing touchpoints get credit for a sale or signup when a customer interacts with your brand across multiple channels.
Instead of crediting only the last click, modern attribution spreads credit across the full journey, so you can see what actually drives revenue and stop overpaying for channels that just close deals other channels created.
[Insert Image: A simple diagram of a customer journey with 5–6 touchpoints across paid, organic, email, and direct.]
Why I’m Writing This (and why you should care)
I’ll be honest. Most marketers I talk to know last click is broken. They still use it. Because it’s the default in Google Analytics, the default in Meta Ads Manager, and the default in nearly every dashboard their boss looks at.
The problem? Your top-of-funnel channels look terrible. Your branded search looks like a hero. And every quarter, somebody asks why YouTube and display “aren’t working,” when in fact they probably are — they’re just not the ones getting the trophy.
If your buyer journey crosses more than two channels, last click is lying to you. And the bigger your spend, the more expensive that lie gets.
What is Attribution Modelling?
Attribution modelling is the rule you use to assign credit for a conversion to one or more marketing touchpoints. It answers a simple question: when someone bought from you, which of your marketing efforts deserve the win, and how much?
There are two big buckets:
- Single-touch models — give 100% credit to one touchpoint (first click, last click, last non-direct click)
- Multi-touch models — split the credit across several touchpoints (linear, time decay, U-shaped, W-shaped, data-driven)
A single-touch model is easy to set up and easy to explain. A multi-touch model is closer to how people actually buy.
[Insert Screenshot: GA4 attribution settings panel showing model selection.]
Why Last Click is Quietly Wrecking your Marketing
Last click made sense in 2008. People searched, clicked, bought. Done.
Now? A B2B buyer might touch your brand 20+ times before signing. A DTC shopper might see your TikTok, Google you a week later, click a retargeting ad, and finally buy through an email coupon.
If you give all the credit to that email, you’ll think email is your best channel and pour more budget into it.
Then six months later, you wonder why new customer acquisition has stalled. It stalled because you cut the channels that were filling the top of the funnel.
Here’s a quick gut check. If your “direct” traffic and “branded search” make up most of your conversions, you’re probably under-investing in the channels that build brand awareness in the first place.
How Attribution Modelling Works (step by step)
You don’t need a data science team to start. You need a framework. Here’s the basic flow:
- Define your conversion event. A purchase, a demo booking, a free trial signup. Pick one and stick with it.
- Set a lookback window. Most teams use 30 or 90 days. Longer for B2B, shorter for impulse-buy ecommerce.
- Track every touchpoint. Use UTMs, server-side tracking, and a customer data platform or analytics tool that can stitch sessions across devices.
- Pick a model (or test a few). Start with last non-direct click as a baseline, then layer in a multi-touch model for comparison.
- Compare model outputs. Look at how channel credit shifts when you change the model. The deltas tell you where last click is misleading you.
- Reallocate budget based on incremental impact, not just attributed revenue. Run holdout tests if you can.
[Insert GIF: A budget pie chart shifting as the attribution model changes.]
The Main Attribution Models, Side by Side
| Model | How it works | Best for | Watch out for |
|---|---|---|---|
| First Click | 100% credit to the first touchpoint | Top-of-funnel channels, brand awareness analysis | Ignores everything that happens after |
| Last Click | 100% credit to the final touchpoint | Direct response, short sales cycles | Inflates brand search, email, retargeting |
| Last Non-Direct Click | Skips direct traffic, credits the last marketing touch | Default for many GA4 setups | Still single-touch, still incomplete |
| Linear | Equal credit to all touchpoints | Long, complex journeys where every step matters | Treats a banner impression like a sales call |
| Time Decay | More credit to touchpoints closer to conversion | Sales cycles where recency matters | Still under-credits awareness channels |
| Position-Based (U-shaped) | 40% to first, 40% to last, 20% spread between | Balancing acquisition and closing | Assumes middle touches matter equally |
| W-Shaped | Credit to first touch, lead creation, and final touch | B2B with clear funnel stages | Needs clean lifecycle data |
| Data-Driven (DDA) | Algorithm assigns credit based on actual behavior | Mature teams with enough conversion volume | Black box; hard to explain to leadership |
[Insert Image: A visual comparison of how 100% credit gets sliced under each model.]
Real Example: Why One Model Changes Everything
Say you sell project management software. A customer’s path looks like this:
- Day 1: Sees a LinkedIn ad → clicks
- Day 4: Reads a blog post via Google search → bounces
- Day 9: Opens a nurture email → clicks pricing page
- Day 12: Sees a retargeting display ad → ignores it
- Day 14: Searches your brand name → buys
Under last click, branded search gets 100% of the credit. LinkedIn gets nothing. Your blog gets nothing. Email gets nothing.
Under linear, each of the five touches gets 20%. LinkedIn finally gets some love.
Under W-shaped, LinkedIn (first), email (lead conversion), and branded search (final) split most of the credit. The display ad and blog get smaller slices.
Same customer. Same revenue. Wildly different stories. Now imagine multiplying that across 10,000 conversions.
That’s why model choice isn’t a nerdy detail. It changes which campaigns survive the next budget review.
[Insert Video: A 60-second explainer showing the same journey under three different models.]
Best Tools and Platforms for Cross-Channel Attribution
You don’t need to build this from scratch. A few options that actually work:
- Google Analytics 4 — Free, has data-driven attribution baked in, but limited to channels Google can see (so paid social often gets short-changed).
- HubSpot — Decent for B2B with built-in multi-touch models if you live in their CRM already.
- Adobe Analytics — Powerful, expensive, and steep to learn. Good for enterprise.
- Northbeam, Triple Whale, Rockerbox — Popular with DTC brands. Built to stitch paid social, paid search, and email into one view.
- Dreamdata, HockeyStack — Strong for B2B SaaS with long sales cycles and CRM-heavy reporting.
- NVECTA — Where we come in. NVECTA helps growth and marketing teams stop guessing by combining cross-channel tracking, multi-touch modelling, and incrementality testing in one place. If you’re tired of three dashboards telling you three different stories, this is the kind of setup that solves it.
[Insert Screenshot: A dashboard view comparing channel performance under last click vs. data-driven attribution.]
Common Attribution Mistakes (and how to dodge them)
A few traps I see all the time:
- Trusting one platform’s numbers as the source of truth. Meta will overclaim. Google will overclaim. They both want more of your budget.
- Ignoring view-through conversions entirely, or counting all of them. Both extremes are wrong. Find a middle ground based on your buyer journey.
- Switching models constantly. If you flip to a new model every quarter, you can’t tell what’s a real performance change and what’s just a measurement change.
- Treating attribution and incrementality as the same thing. They aren’t. Attribution tells you which touchpoints showed up. Incrementality tells you which ones actually caused the sale. You need both.
- Forgetting offline. If you do podcast ads, billboards, or events, those touchpoints don’t show up in pixel-based tracking. Use post-purchase surveys or geo holdout tests.
How to Pick the Right Model for your Business
There’s no universal best model. There’s a best model for your situation. A few quick rules of thumb:
- Short sales cycle, single channel? Last click is fine.
- Short sales cycle, multiple channels? Try position-based or time decay.
- Long sales cycle, multiple channels, lots of content? Go W-shaped or data-driven.
- Enough conversion volume (300+ conversions and 3,000+ paths per 30 days)? Use data-driven attribution. GA4 has a decent free version.
The honest answer: most teams should run two models in parallel. One conservative (last non-direct), one full-funnel (data-driven or W-shaped). When the two disagree, that’s where the interesting questions live.
Key Takeaways
- Last click is the default, not the right answer. It rewards channels that close, not channels that create demand.
- Cross-channel attribution spreads credit across the full buyer journey, so your reporting matches reality.
- Multi-touch models (linear, time decay, position-based, W-shaped, data-driven) each have trade-offs. Pick based on your sales cycle and data volume.
- Attribution is not the same as incrementality. Run holdout tests when you can.
- Tools like GA4, HubSpot, Triple Whale, Dreamdata, and NVECTA can do the heavy lifting so you don’t have to build a data warehouse from scratch.
- Pick a model, stick with it long enough to learn from it, and resist the urge to flip every time numbers move.
Quick Summary
Stop letting last click decide your budget. Map your customer journey, pick a multi-touch model that matches your sales cycle, and compare it against last click to see where the gaps are.
The goal isn’t perfect attribution — it doesn’t exist. The goal is a model that helps you make better decisions than the default one your dashboard ships with.
Ready to Fix your Attribution?
If your dashboards keep telling you a story that doesn’t match what your sales team or your bank account is saying, that’s not a small problem. That’s lost revenue dressed up as good news.
NVECTA helps marketing and growth teams build cross-channel attribution that actually reflects how their customers buy, with multi-touch modelling, incrementality testing, and clean reporting your CFO will believe.
Book a demo with NVECTA today and find out which channels are really driving your growth — and which ones have been getting credit they didn’t earn.
FAQ
What is cross-channel attribution modelling?
Cross-channel attribution modelling is the process of assigning credit for a conversion — a purchase, demo signup, or free trial — to the marketing touchpoints a customer interacted with before converting. Instead of crediting just one channel, multi-touch attribution distributes credit across the full buyer journey, giving you a more accurate picture of what’s actually driving revenue.
Why is last-click attribution a problem?
Last-click attribution gives 100% of the credit to the final touchpoint before a conversion, which almost always means branded search, retargeting, or email. The problem is that it ignores every channel that built awareness and consideration along the way. Marketers who rely on it tend to cut top-of-funnel spend because those channels “don’t show up” in their reports, then wonder why new customer acquisition drops six months later.
What is the difference between attribution and incrementality?
Attribution tells you which channels were present in a customer’s journey. Incrementality tells you which channels actually caused the sale. A channel can appear in every conversion path without being the reason someone converted. Incrementality testing, typically through holdout experiments, answers the harder question: would this customer have bought anyway, even without that channel?
Which attribution model is best for e-commerce?
For short-cycle eCommerce with multiple paid channels, position-based (U-shaped) or time decay models tend to work well. They balance credit between the channels that introduce customers and the ones that close them. If you have 300+ conversions and 3,000+ conversion paths per month, data-driven attribution in GA4 is worth using since it learns from your actual buyer behavior instead of applying a fixed rule.
How many touchpoints does the average customer have before converting?
It varies heavily by industry and product price. A DTC impulse purchase might involve 3 to 5 touchpoints. A B2B SaaS sale can involve 20 or more interactions across LinkedIn, content, email sequences, retargeting, and direct sales outreach. The higher the consideration level, the longer the journey and the more misleading single-touch attribution becomes.
What lookback window should I use for attribution?
Most eCommerce teams use a 30-day lookback window. B2B teams with longer sales cycles typically go with 90 days or more. The right window depends on how long it realistically takes your customers to move from first touch to conversion. Using a window that’s too short means early-funnel touchpoints get dropped from the model entirely.
Can I run two attribution models at the same time?
Yes, and it’s often a smart move. Running a conservative model, like the last non-direct click, alongside a full-funnel model, like data-driven or W-shaped, lets you spot where the two disagree. Those disagreements are where the last click is most likely misleading your budget decisions. The gap between models is where the real strategic insight lives.
How does NVECTA help with cross-channel attribution?
NVECTA’s AI-powered CDP combines cross-channel tracking, multi-touch attribution, and incrementality testing into a single platform, so marketing teams don’t have to reconcile three separate dashboards. It builds a unified view of each customer’s journey and surfaces which channels are genuinely contributing to growth versus just showing up at the finish line.