



 Email
 SMS
 Whatsapp
 Web Push
 App Push
 Audience Sync for Ads
 Popups
 Channel A/B Testing
 Control groups Analysis
 Frequency Capping
 Funnel Analysis
 Cohort Analysis
 RFM Analysis
 Signup Forms
 Surveys
 NPS
 Landing pages personalization
 Website A/B Testing
 PWA/TWA
 Heatmaps
 Session Recording
 Wix
 Shopify
 Magento
 Woocommerce
 eCommerce D2C
 Mutual Funds
 Insurance
 Lending
 Recipes
 Knowledgebase
 Developer Docs
 Product Updates
 App Marketplace
 Academy
 Ebooks
 Case Studies
 Blog
 Templates
 Dhruv Kalra
It’s the week before the Diwali sale, and you’ve got 4 lakh customers, a ₹10 lakh discount budget and one question from the founder: who actually needs the 20% coupon? Propensity modeling is how you answer that with something better than a hunch. It gives every customer a score for how likely they are to do one specific thing, such as buy this week, churn this quarter or upgrade to the annual plan.
The idea’s simple. The details are where it gets fiddly. Which outcome do you score? How do you know the model isn’t guessing? And what do you do with a 0.62? This guide walks through all of it with Indian examples, and shows how a customer data platform like NVECTA turns those scores into campaigns.
This guide covers-
- What propensity modeling is and how a score is built
- The main types of propensity models marketers use
- How to check a model before you trust it
- Where propensity stops and uplift modeling starts
- How NVECTA helps you act on propensity scores with AI
What Is Propensity Modeling?
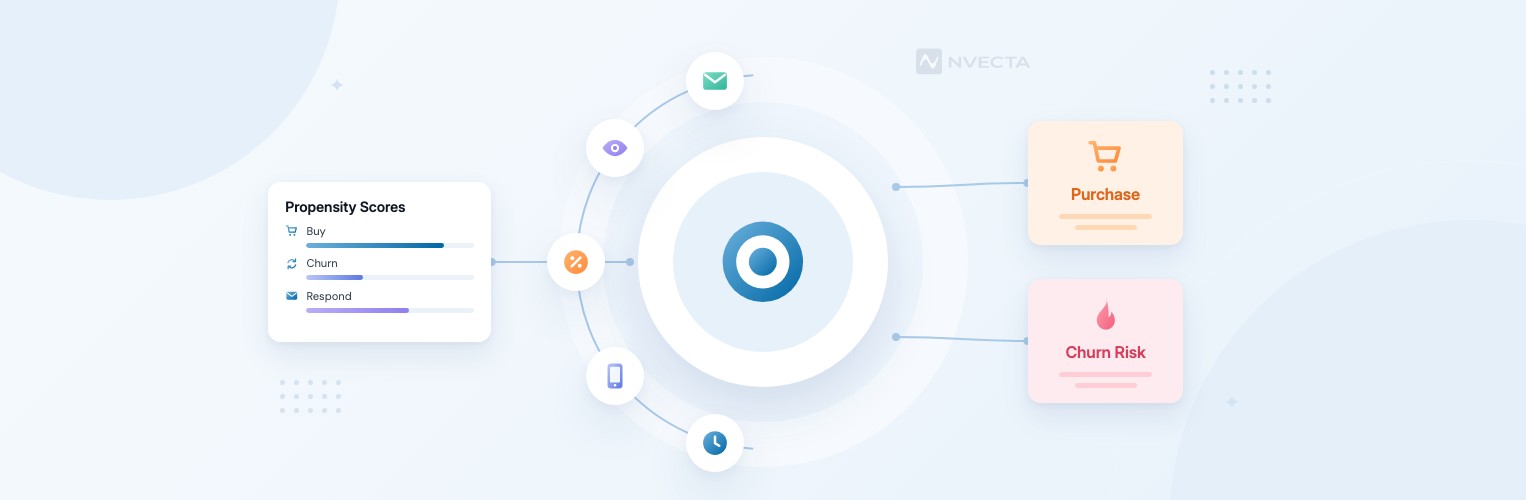
Propensity modeling is a way of predicting how likely each customer is to take one action within a set time. Will Rohan buy again in the next 14 days? Is Meera likely to cancel her SIP before March? The model looks at past behaviour and returns a score between 0 and 1 for each person.
A score of 0.8 doesn’t mean Rohan will definitely buy. It means that out of 100 customers who look like him, roughly 80 bought in the past. That’s a probability, not a promise, and we think most mistakes with propensity scores start when someone forgets the difference.
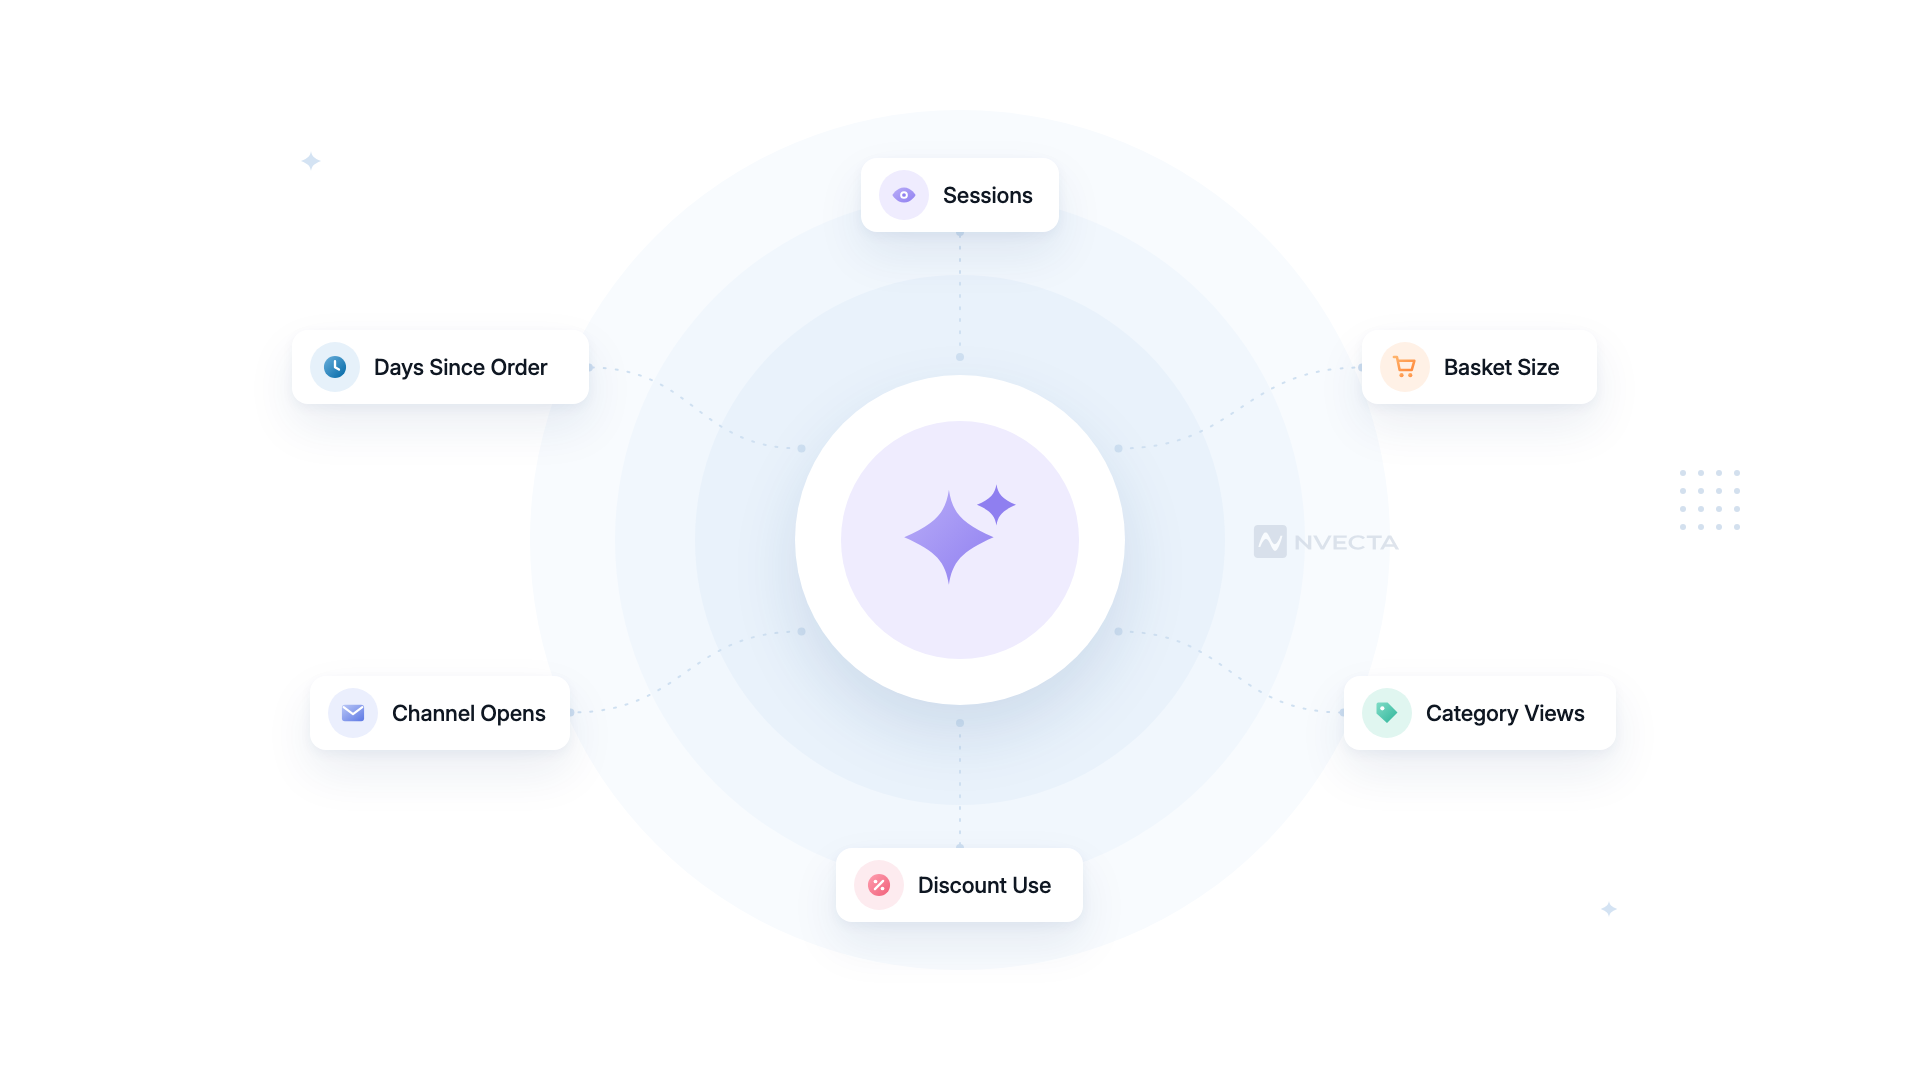
What goes into the model? Usually the boring stuff you already collect. Days since last order, number of sessions this month, whether someone opened the size chart twice, which payment method they used, how many push notifications they ignored. The model finds which of these signals moved together with the outcome in the past.
Propensity Score vs RFM Score
RFM grades customers on recency, frequency and monetary value, and it’s a great first cut. But it only looks backwards. A customer can sit in your “Champions” cell while quietly browsing a competitor, and RFM won’t notice until the orders stop. A propensity model can use those same RFM inputs alongside newer signals, then forecast one named outcome. If you haven’t built RFM segments yet, our older guide to RFM analysis is a sensible place to start.
Why Propensity Modeling Matters in 2026
Marketing budgets didn’t get bigger this year, but customer expectations did. So the pressure’s on spending each rupee and each message where it changes something.
You Stop Paying Discounts to People Who’d Buy Anyway
Picture a skincare brand sending a 15% code to everyone on its list. Customers who reorder every 40 days like clockwork get the code too, and they use it. That’s pure margin lost. A purchase propensity score lets you hold the code back from your top band and spend it on the middle, where a nudge might tip someone over.
Retention Gets Cheaper Than Acquisition
Winning a new customer can cost anywhere from 5 to 25 times more than keeping one, according to a Harvard Business Review piece on retention. That’s a wide range, and your number depends on your category. Still, a churn propensity score tells you who’s drifting while there’s time to do something about it.
Customers Expect Messages That Fit
McKinsey’s research on personalisation found 71% of consumers expect personalised interactions. And 76% get frustrated when they don’t get them. It’s a 2021 study, so we’d treat the exact numbers loosely, but nobody we know thinks expectations have gone down since.
Sales Teams Call the Right Leads First
Got 3,000 loan enquiries and a call centre that can handle 400 a day? Rank them by approval propensity and the first 400 calls go to applicants who uploaded PAN and salary slips, not the ones who stopped at the eligibility check. It’s the same logic behind a predictive lead scoring model, applied to a single outcome.
Types of Propensity Models
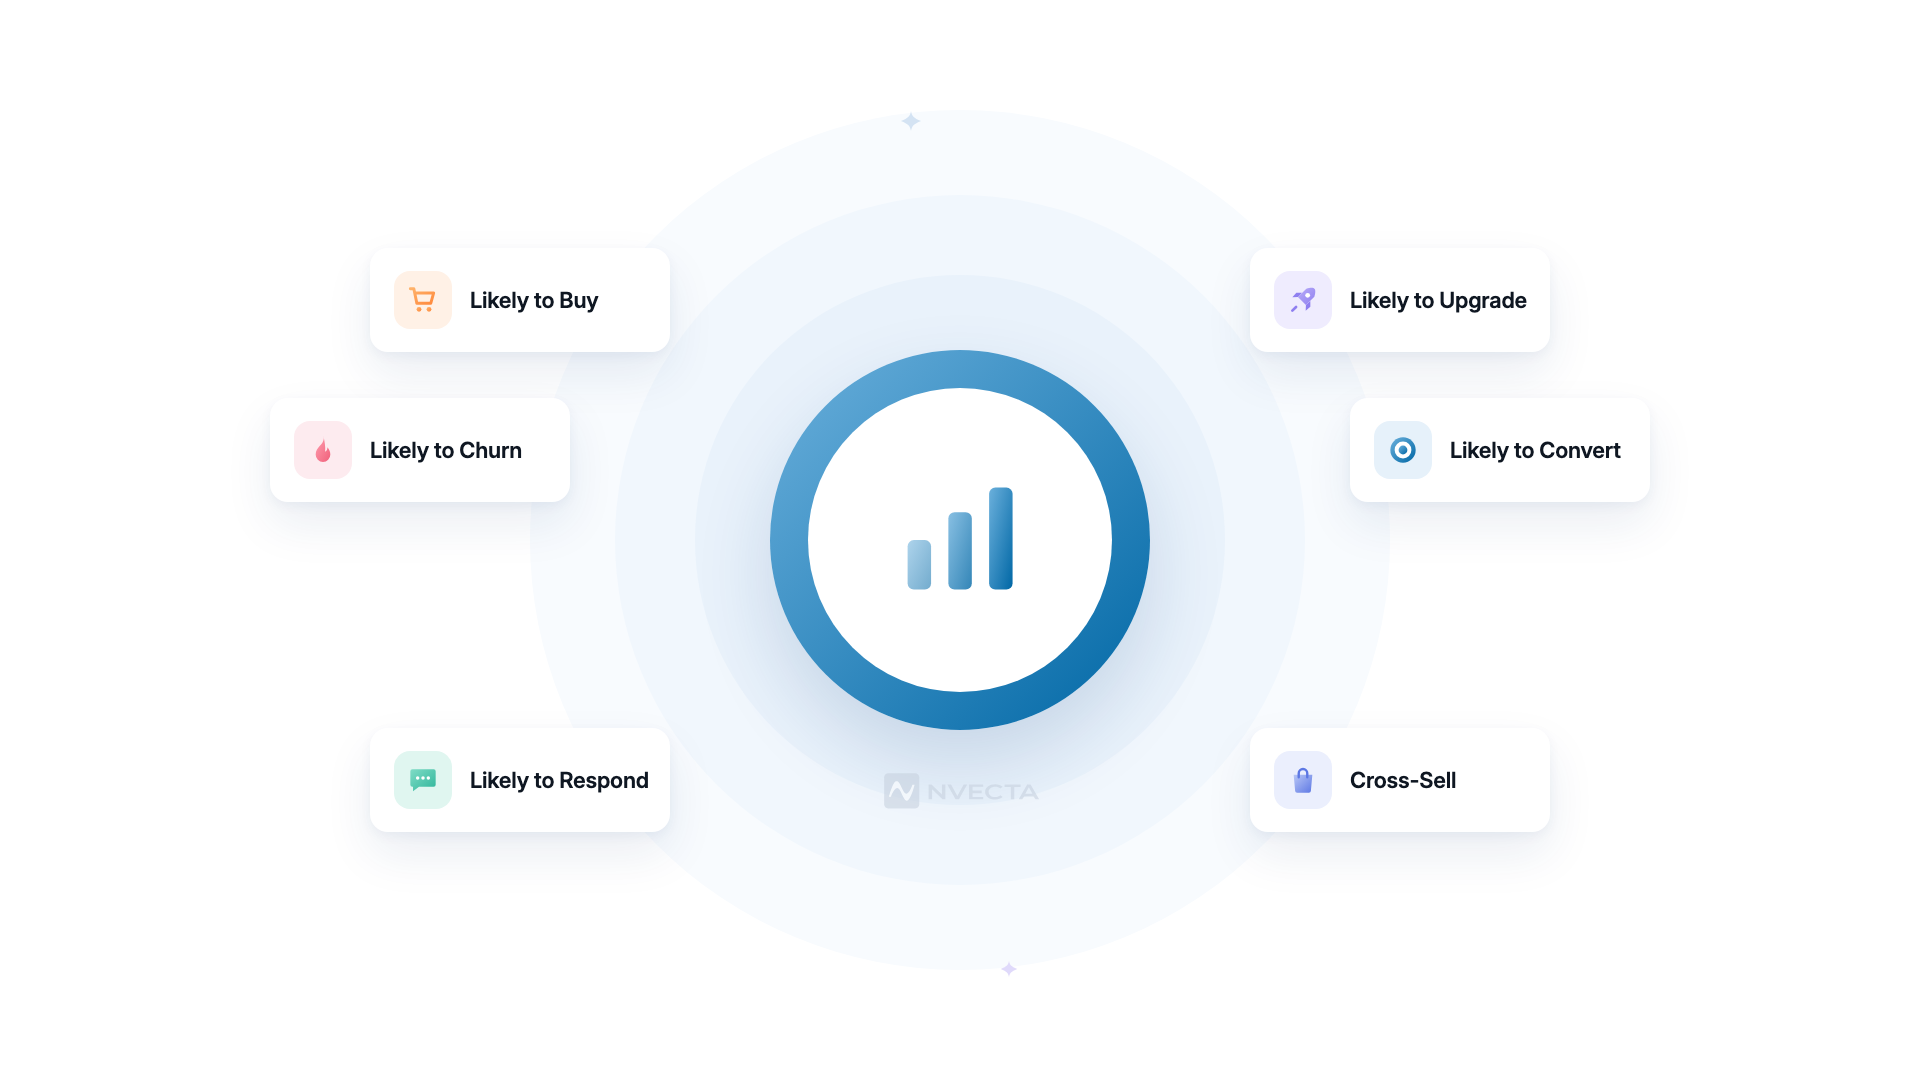
Each model answers one question. Trying to build a single “good customer” score usually gives you a score nobody trusts, so it’s better to pick the outcome first.
- Propensity to buy. Who’s likely to place an order in the next 7, 14 or 30 days? This is the one D2C brands build first.
- Propensity to churn. Who’s likely to cancel, uninstall or simply go quiet? For subscriptions, “quiet” needs a definition, such as no login in 21 days. Our guide to churn prediction goes deeper on the signals.
- Propensity to respond. Who’ll open, click or reply to a particular campaign? Handy when WhatsApp costs you per message.
- Propensity to upgrade or cross-sell. Who’s likely to move from a monthly to an annual plan, or add term insurance to a health policy?
- Propensity to convert. Which anonymous visitors or leads will complete signup, KYC or a first purchase?
You don’t need all five. If we had to pick two to start with, it’d be buy and churn, because almost every business has the data for them and the actions are obvious.
How Does Propensity Modeling Work?
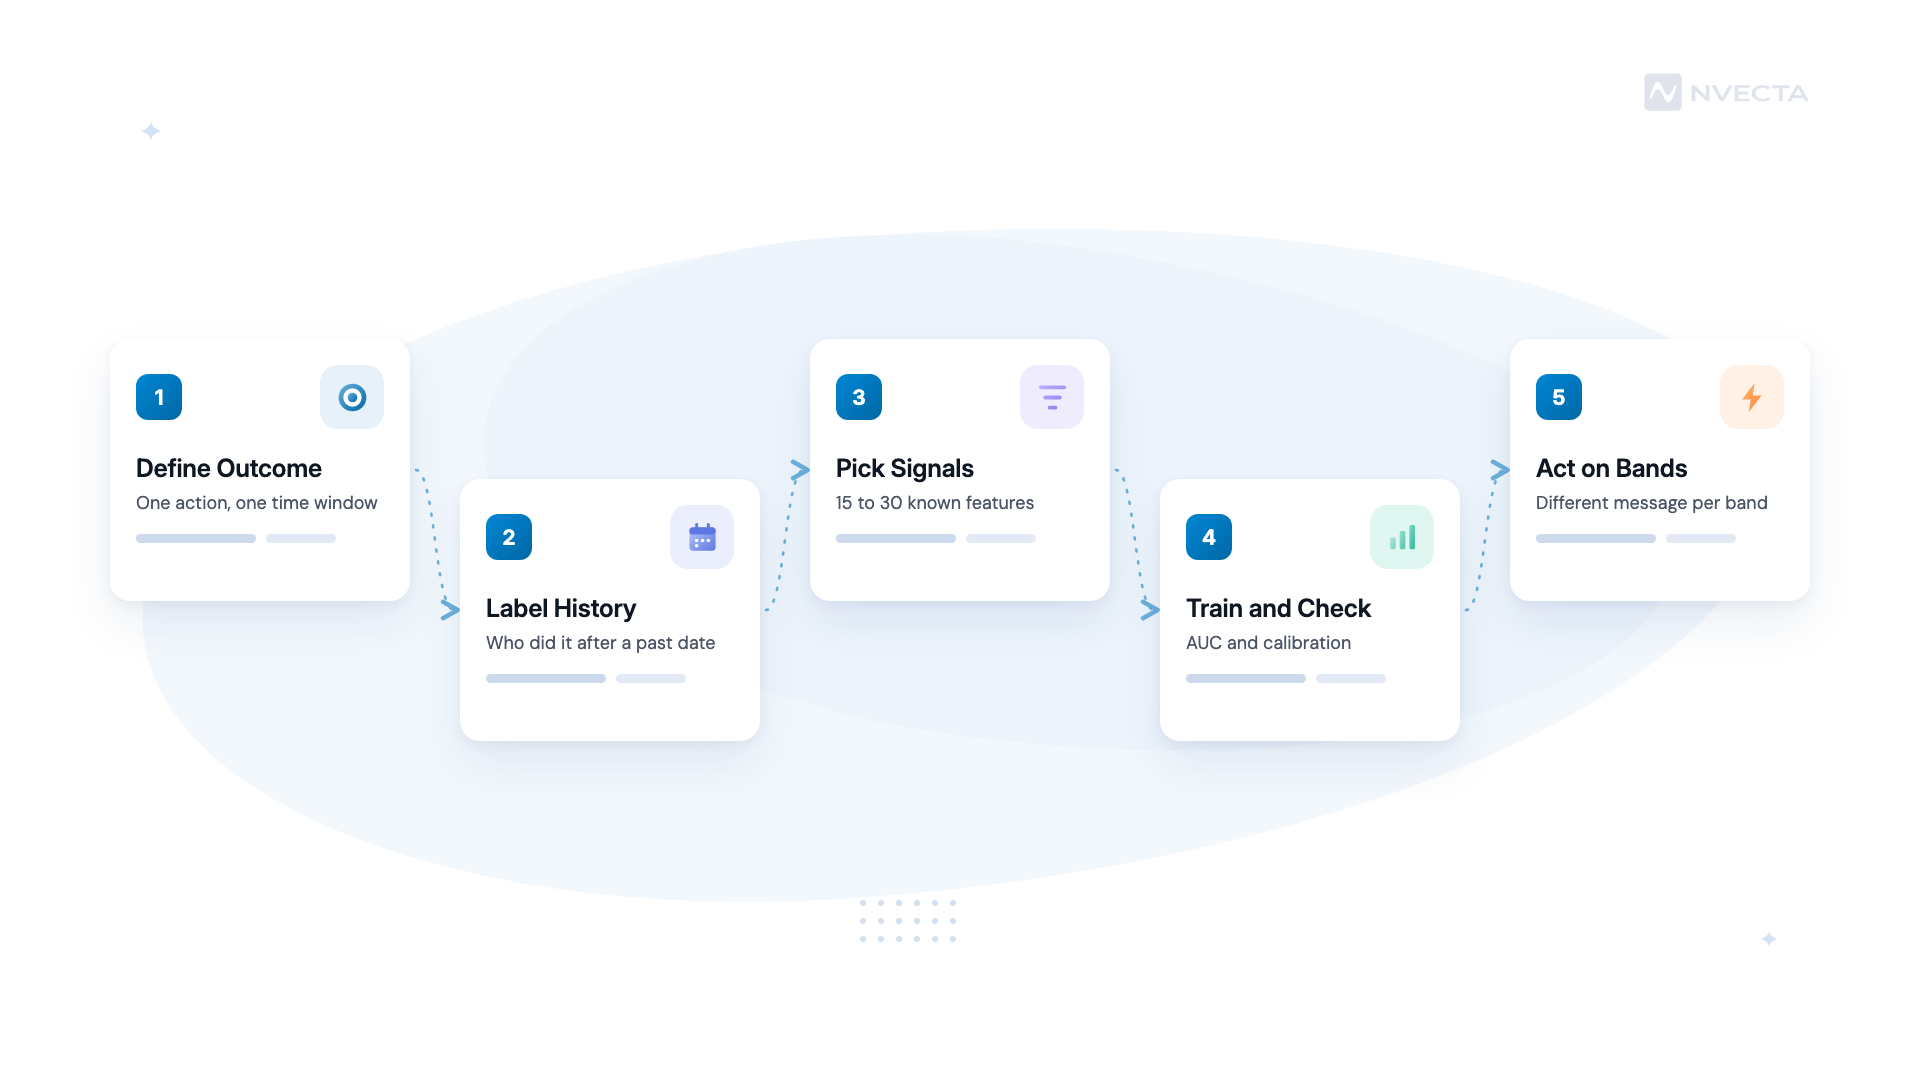
You can build a working propensity model in a few weeks with data you already have, and you probably won’t need a new tool to start. The six steps below are the order we’d follow.
Step 1: Define One Outcome and One Window
Write the outcome as a sentence a finance person would accept. “Places at least one paid order in the 14 days after the score date” is good. “Engages more” isn’t. The window matters a lot: a 7-day purchase window behaves very differently from a 90-day one.
Step 2: Build the Training Data
Take a snapshot of customers on a past date, say 1 August. For each one, record what you knew about them that day. Then check who placed an order between 2 and 15 August. That’s your label: 1 for yes, 0 for no, and it’s what the model learns from.
Watch for one trap. If any input was recorded after 1 August, such as a “last order date” that’s been updated since, the model will look brilliant in testing and fall apart in real life.
Step 3: Pick the Features
Start with 15 to 30 signals, not 300. Good ones tend to be recency of visits, order counts, average basket, category views, discount usage, channel opens and app versus web. Can’t decide whether a signal belongs? Ask whether you’d know its value on the score date. Add a few that only your business has, like “checked SIP top-up page” or “viewed the claim status screen”.
Step 4: Train a Simple Model First
Logistic regression is the usual starting point because you can see which inputs push the score up. Gradient-boosted trees often score a bit better, but they’re harder to explain to the CMO. Our honest take? Ship the simple one, then try the fancier model once the campaigns are running.
Step 5: Check It Before You Trust It
Two checks matter most. The first is ranking, usually measured with AUC. Google’s machine learning crash course explains it well: 0.5 is a coin toss and 1.0 is perfect. For marketing outcomes, anything above 0.7 is usually worth using.
The second is calibration. Do customers scored around 0.3 convert about 30% of the time? The scikit-learn guide to probability calibration shows how to plot this. A model can rank people well and still be badly calibrated, which matters the moment you start forecasting revenue from scores.
Step 6: Turn Scores Into Bands and Actions
Nobody runs a campaign for “customers scoring 0.47”. Split the scores into three or four bands, then give each band a different treatment. Sounds obvious? You’d be surprised how many scores never leave the analyst’s laptop. High band might get a new-arrivals email with no discount. The middle band gets the coupon. The bottom band gets nothing this week, which is a perfectly good decision.
Then rescore on a schedule. Weekly’s fine for most D2C brands, while a lending app tracking application drop-off may need daily scores, because a half-filled loan form goes cold within hours.
Propensity Modeling vs Uplift Modeling: Key Differences
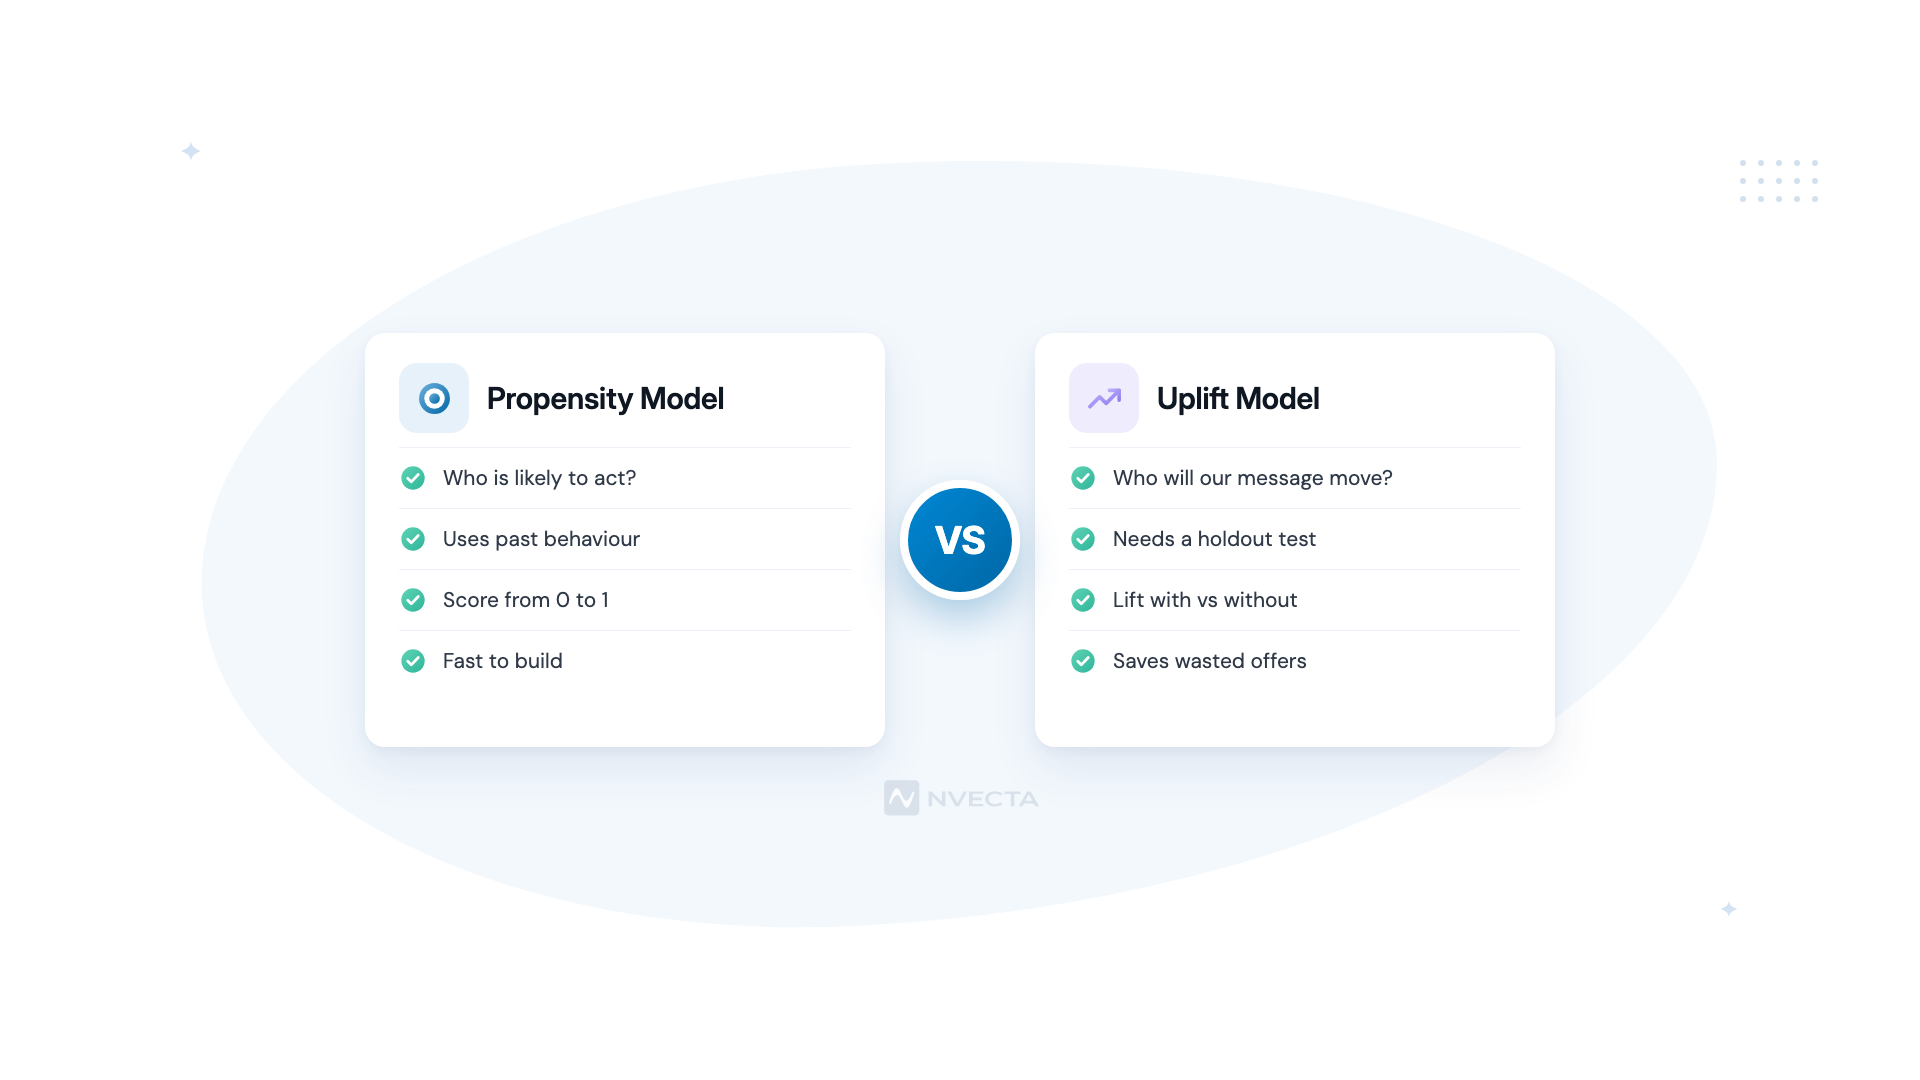
There’s a catch with any propensity score. It tells you who’s likely to buy, not who’s likely to buy because of your message, and those two lists overlap far less than you’d hope.
| Factor | Propensity Model | Uplift Model |
|---|---|---|
| Core Question | Who is likely to act? | Whose action will our message change? |
| Data Needed | Past behaviour and outcomes | A randomised test with a treated and a held-out group |
| Output | Probability of the outcome | Difference in probability with and without contact |
| Best For | Ranking, forecasting, prioritising leads | Deciding who to send a costly offer to |
| Main Risk | Spending on customers who’d act anyway | Needs larger audiences to give stable results |
| Effort | Low to medium | Medium to high |
Uplift modeling splits customers into four groups. Persuadables act only if you contact them. Sure Things act anyway, Lost Causes won’t act either way, and Sleeping Dogs act less if you contact them. That last group is real: think of a customer reminded about an auto-renewal who promptly cancels it.
Is it worth the extra work? Sometimes, very much so. A California Management Review article describes a retention campaign where uplift targeting cut the number of customers contacted by 80%, dropped costs from $400,000 to $80,000, and still raised contract renewals.
How Do They Work Together?
You don’t have to choose. Use propensity to shortlist people who are in play, then run a holdout group to see which bands really respond to the offer. Once you’ve run a few of those tests, you’ve got the data an uplift model needs.
Propensity Modeling Use Cases by Industry
Every industry has its own version of “who’s about to act?”. A few that come up often:
Ecommerce and D2C
- Rank shoppers by 14-day purchase propensity before a festive sale and keep coupons for the middle band.
- Score repeat-purchase likelihood for replenishable products such as protein powder or pet food.
- Suppress high-propensity buyers from paid retargeting so you’re not paying Meta to show ads to people already on their way back. A CDP such as NVECTA can push that exclusion list to your ad accounts for you.
BFSI
Ever noticed SIP cancellations spike the week after a market dip? A mutual fund house can score which investors are likely to stop, then send a calm explainer before the cancellation request lands. Insurers do the same with renewals, scoring policyholders 45 days before expiry. Lenders score half-finished applications by how likely someone is to complete KYC if reminded.
SaaS and Subscriptions
Trial-to-paid propensity is the obvious one. Score trial users on day 3, and the sales team gets a shortlist of accounts that invited teammates and connected an integration.
Common Mistakes With Propensity Scores
Most propensity projects don’t fail on the maths. They fail in the hand-off to marketing.
- Treating the score as certain. A 0.9 customer still doesn’t buy one time in ten.
- Never rescoring. A model trained before your app redesign may be quietly wrong six months later.
- Leaking future data into training, which makes test results look far better than reality.
- Sending the biggest discount to the highest scorers, who were most likely to buy without it.
- Skipping the holdout, so nobody can say whether the campaign changed anything.
That fourth one is the most expensive, and it’s surprisingly common.
How NVECTA Helps With Propensity Modeling
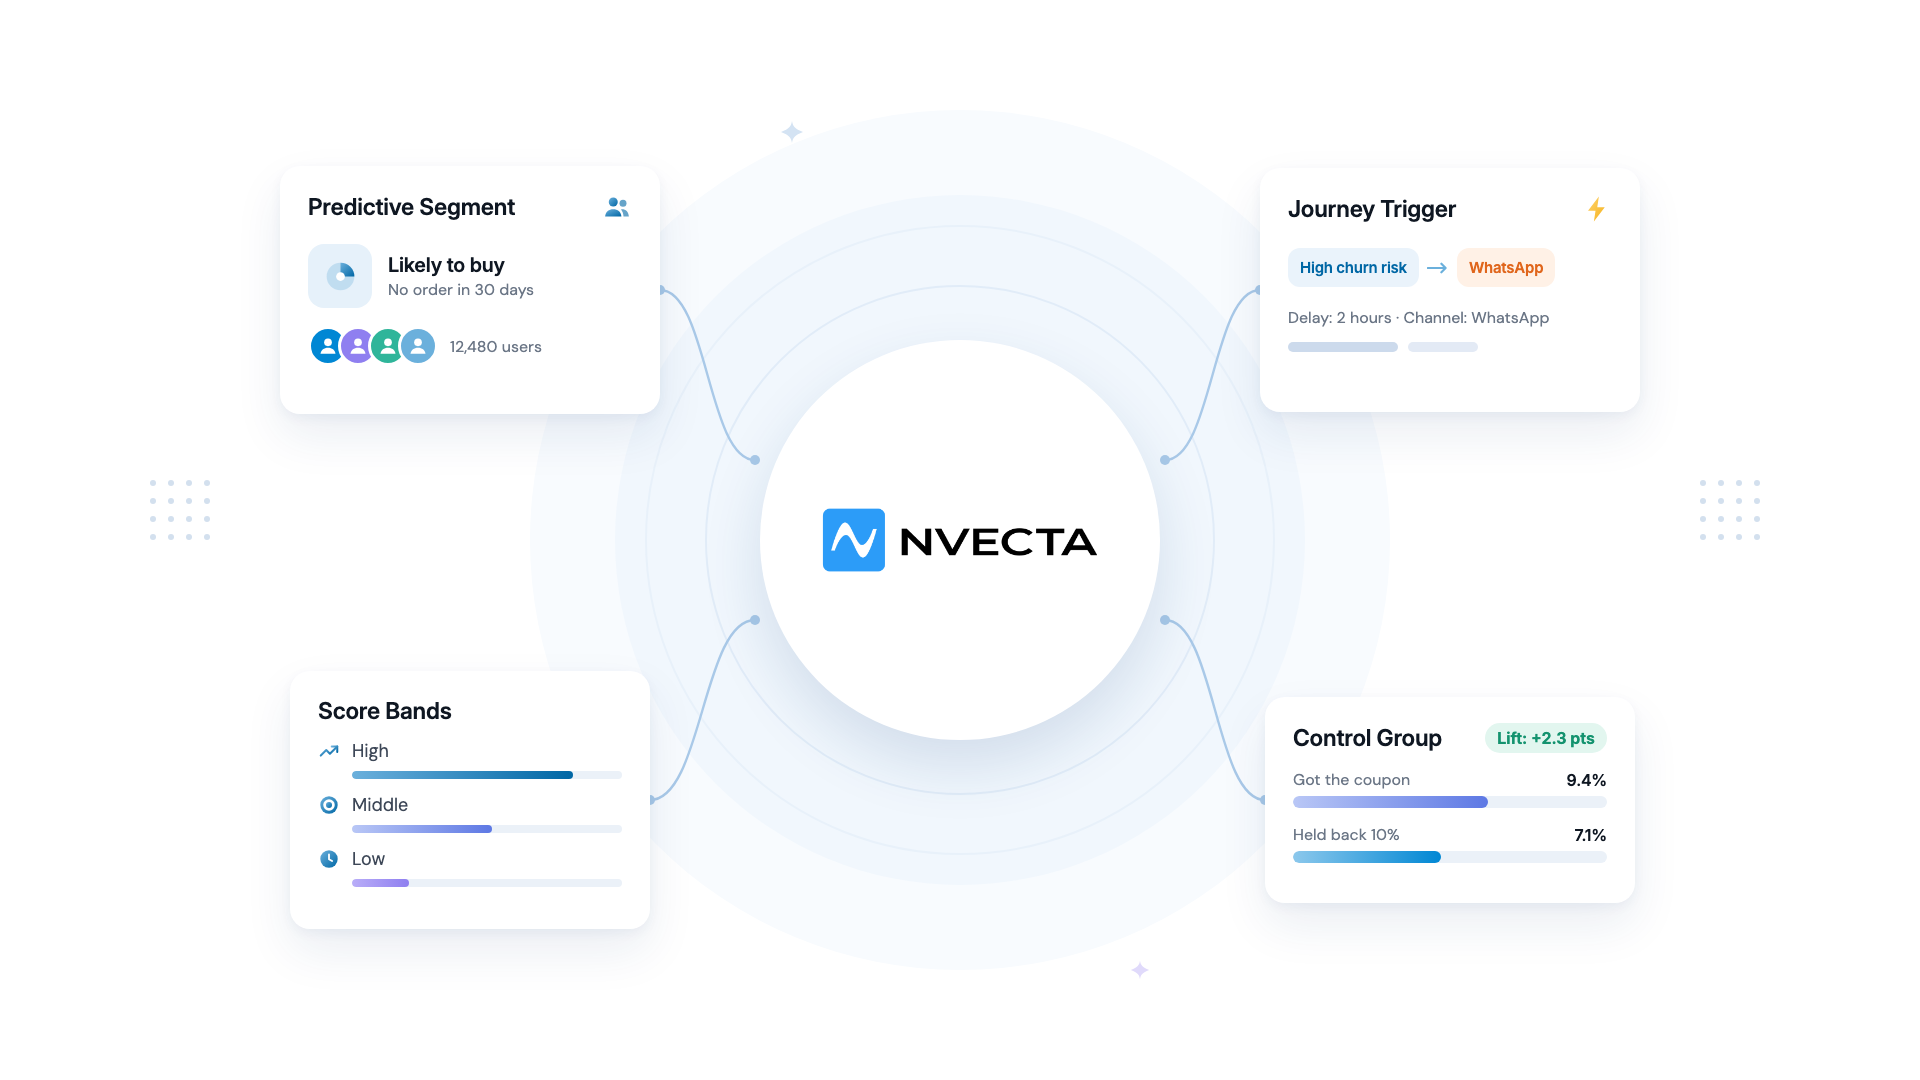
NVECTA is an AI-powered customer data platform, and predictive scoring sits inside its AI Decisioning layer alongside lead scoring and send time optimisation. So what does that look like on an ordinary Tuesday?
Start With Ready-Made Likelihood Segments
You don’t need a data scientist to get going. NVECTA’s Segmentation module includes ready-made audiences for customers likely to buy and likely to churn, and on plans that include predictions it can attach a likelihood score to every profile. So before the Diwali sale, you can pull “likely to buy, hasn’t ordered in 30 days” in a couple of minutes, which is the middle band from Step 6.
Bring Your Data Team’s Own Model
What if your analysts have already built a churn model in the warehouse? With NVECTA’s Composable CDP, segments can read straight from tables in your Snowflake or Redshift warehouse. Their score becomes an audience marketers can use, and the data stays in your warehouse.
Give Each Score Band Its Own Journey
Scores only pay off when each band gets something different. In Customer Journey Orchestration, a customer entering the high-churn segment can get a WhatsApp check-in two hours later, while the low-risk group just gets the regular newsletter. It’s the “never rescoring” problem from the mistakes list handled for you, because segment membership updates as behaviour changes.
Measure Lift With a Control Group
In NVECTA, this feature is called Control Group. A Control Group is a random share of your audience that NVECTA leaves out of a message, so you can compare what they do with everyone who got it. Hold back 10% of each score band, and after two weeks you’ll know which bands the coupon moved. That’s the first step towards the uplift view described earlier.
Pick the Time and Channel for Each Person
A high-propensity buyer who only opens email at 9 pm shouldn’t get an SMS at 11 am. NVECTA’s Campaign Personalisation learns each customer’s best send time and preferred channel from how they’ve engaged before. Your churn-risk message then lands where that person is most likely to see it.
Stop Paying for Ads to Sure Things
Customers in your top purchase band are probably coming back anyway. Sync that segment to Meta and Google as an exclusion list, and your retargeting budget goes to people who still need convincing.
Conclusion
Should every marketing team build propensity models in 2026? We’d say yes, but smaller than most people think. One outcome, one window, a model you can explain, and a holdout to prove it worked. That’s enough to change how you spend your next festive discount budget.
The fancy part isn’t the model, anyway. It’s making sure a score of 0.62 leads to a different message than a score of 0.21. A platform like NVECTA handles that last mile, from the score to the segment to the journey, so the scores don’t end up stuck in a spreadsheet.
Want to see how it works on your own customer data? Book a demo with the NVECTA team.
Frequently Asked Questions
What Is a Good Propensity Score?
It depends on your base rate. A score only means something next to the other scores from the same model. For a 14-day purchase model where the average customer buys 6% of the time, a customer at 0.30 is five times likelier than average and well worth a nudge.
How Much Data Do You Need for Propensity Modeling?
Less than you’d think. A few thousand customers with a few hundred positive outcomes is often enough for a simple model. Say a D2C brand has 20,000 customers and 1,500 bought in the last 14-day window. That’s plenty to train a first purchase model.
Is Propensity Modeling the Same as Predictive Analytics?
Not quite. Propensity modeling is one part of predictive analytics in marketing. Predictive analytics also covers forecasting revenue, predicting lifetime value and estimating demand, while a propensity model scores each customer on one yes-or-no outcome.
Can Small Businesses Use Propensity Models?
Yes, and they don’t need a data team. A Shopify store with 5,000 buyers can start with ready-made “likely to buy” and “likely to churn” segments in a CDP like NVECTA, then add a holdout to check whether the targeting is paying for itself.
