














 Email
Email SMS
SMS Whatsapp
 Web Push
 App Push
 Audience Sync for Ads
 Popups
 Channel A/B Testing
  Control groups Analysis
 Frequency Capping
 Funnel Analysis
 Cohort Analysis
 RFM Analysis
 Signup Forms
 Surveys
 NPS
NPS Landing pages personalization
  Website A/B Testing
  PWA/TWA
 Heatmaps
 Session Recording
 Wix
Wix Shopify
 Magento
 Woocommerce
 eCommerce D2C
  Mutual Funds
 Insurance
 Lending
  Recipes
  Knowledgebase
 Developer Docs
 Product Updates
 App Marketplace
 Academy
 Ebooks
 Case Studies
 Blog
Blog Templates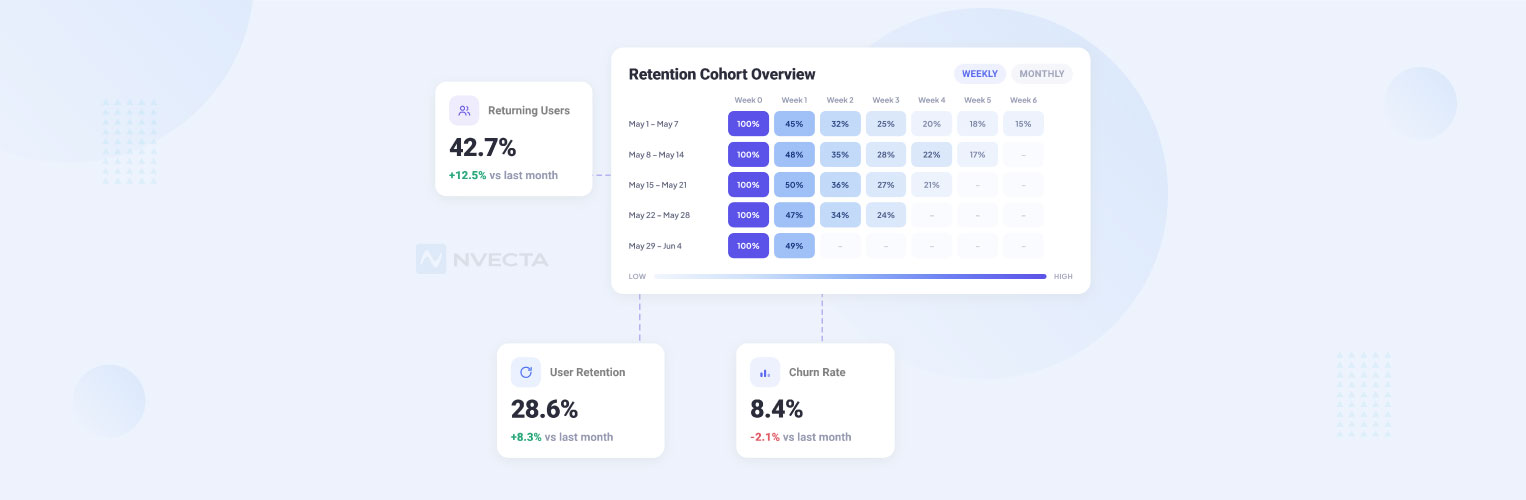
 Afreen Sheikh
Acquiring a customer could look like a win, but the actual long-term growth is achieved through retaining customers. Retention analysis shows whether customers keep coming back or walk away.
The problem is not the loss itself. The problem is not knowing which customers were at risk until it is too late to act. A customer who logged in daily for months can go quiet for weeks before anyone notices, and by then, the account is gone.
This blog covers what retention analysis means, why it matters for business growth, the metrics and techniques behind it, and how to run it step by step for your business. We also explain how NVECTA turns these insights into automated retention action, across every customer touchpoint, in real time.
What Is Retention Analysis
Retention analysis is the process of tracking how many customers stay active with a business over time, and studying the behavioural patterns behind why some stay and others leave.
It uses real -time usage data, like purchases, logins, or feature activity. Teams groups customers into cohorts based on the first key action, then tracks how each group behaves over weeks or months.
What counts as “retained” changes by industry. A repeat purchase counts for a retail brand. An active subscription counts for a software company. A renewed policy counts for an insurer. The tracking method stays the same. Only the definition shifts.
Why Retention Analysis Matters for Long-Term Growth
Retention analysis matters as it gives a complete picture of whether your retention strategies are working or not. Teams can optimise campaigns, messaging, segments, and strategies to accelerate business growth.
Here is what a retention analysis gives your team:
- Lower acquisition spend, since existing customers already trust the product
- Steady revenue, because retained customers keep contributing month after month
- Clear forecasting, since retention data shows whether growth depends on new spend or loyal customers
- Lower support costs, since long-term customers need less help over time
Together, these give finance, product, and marketing teams one view of business health, instead of three separate reports working in different directions.
Retention Analysis vs Churn Analysis vs Customer Lifetime Value
Retention analysis tracks who stays active with your business. Churn analysis tracks who leaves and when. Customer lifetime value puts a revenue figure on each customer relationship. Together, they show the full financial picture, not just one slice of it.
| Aspect | Retention Analysis | Churn Analysis | Customer Lifetime Value |
|---|---|---|---|
| What it measures | Customers who remain active over a period | Customers who stop engaging over a period | Total revenue a customer generates over the relationship |
| Core question | Who stays, and why | Who leaves, and when | How much is each customer worth |
| Data focus | Usage, purchases, engagement patterns | Cancellations, inactivity, drop-off points | Purchase history, average order value, retention period |
| Typical formula | (End customers minus new customers) ÷ start customers × 100 | Customers lost ÷ customers at start of period × 100 | Average revenue per customer × average customer lifespan |
| Primary use case | Spotting patterns that keep customers engaged | Measuring the scale and speed of customer loss | Guiding budget for acquisition and retention spend |
| Owned by | Product and customer success teams | Product and finance teams | Marketing and finance teams |
| Signals action for | Onboarding, engagement, loyalty programs | Win back campaigns, exit surveys | Pricing, upsell strategy, acquisition budget |
Retention and churn are two sides of the same coin; one counts who stays, the other counts who leaves. CLV adds the value that makes both numbers matter to the business.
How to Use Retention Analysis Step by Step
Running retention analysis takes seven steps, from defining an active customer to acting on what the data shows. Skip a step, and you miss the real reason behind churn.
1. Define active usage
Pick an action that shows real value, not just a login. For a messaging app, that means sending a message. For a design tool, it means editing a project.
2. Build time-based cohorts
Group customers by signup week, purchase month, or first key action. This lets you compare groups under the same starting conditions.
3. Segment by relevant traits
Split cohorts by plan type, channel, or region to see which segments retain well and which need attention.
4. Track engagement depth
Look past return visits and measure how much the customer engages with the product.
5. Find drop-off points
Find where most customers exit, whether that is onboarding, week two, or renewal time.
6. Apply predictive signals
Use AI churn prediction models to flag accounts at risk, based on patterns like declining usage, inactivity, or a drop in engagement, before they cancel.
7. Trigger the next best action
Match the risk signal to the right response: an onboarding nudge, a win-back offer, or a support outreach, based on what that specific customer needs at that moment.
8. Measure and refine
Track whether the action actually improved retention for that segment, then adjust the trigger rules for the next cycle.
Key Retention Metrics and Techniques
Retention analysis works on a set of core metrics and proven techniques. Together, they show not just whether customers stay, but which group or time period moves that number up or down.
Customer retention rate
Formula: CRR = [(E − N) / S] × 100
Where E = customers at the end of the period, N = new customers acquired during the period, and S = customers at the start of the period.
This is the number most teams check first, since it works as a general health check on the business.
Customer churn rate
Formula: Churn Rate = (Customers Lost / S) × 100
Where S = customers at the start of the period.
This is the direct inverse of retention rate and shows the scale of loss in the same time frame.
N Day retention
Formula: N Day Retention = (Users Active on Day N / Total Users in Cohort) × 100
Common checkpoints are Day 1, Day 7, and Day 30. A weak Day 1 number usually points to a rough first session.
Net revenue retention
Formula: NRR = [(Starting MRR + Expansion − Downgrades − Churn) / Starting MRR] × 100
Cross 100 per cent, and existing customers are spending more, even as some leave.
Cohort retention rate
Formula: Cohort Retention Rate = (Active Customers in Cohort at Time T / Total Customers in Cohort at Signup) × 100
Repeat purchase/Usage rate.
Formula: Repeat Rate = (Customers with 2 or More Purchases or Sessions / Total Customers) × 100
This short-term signal often predicts longer-term retention, especially for e-commerce and SaaS activation tracking.
A few techniques add more value and depth to these numbers:
Cohort analysis- groups customers by shared signup traits to compare behaviour over time.
Survival analysis- estimates how long a typical customer stays before churning.
RFM segmentation- ranks customers by recency, frequency, and spend to separate high-value accounts from at-risk ones.
Predictive churn modelling- uses historical patterns to forecast which customers are likely to leave next.
How AI Improves Retention Analysis
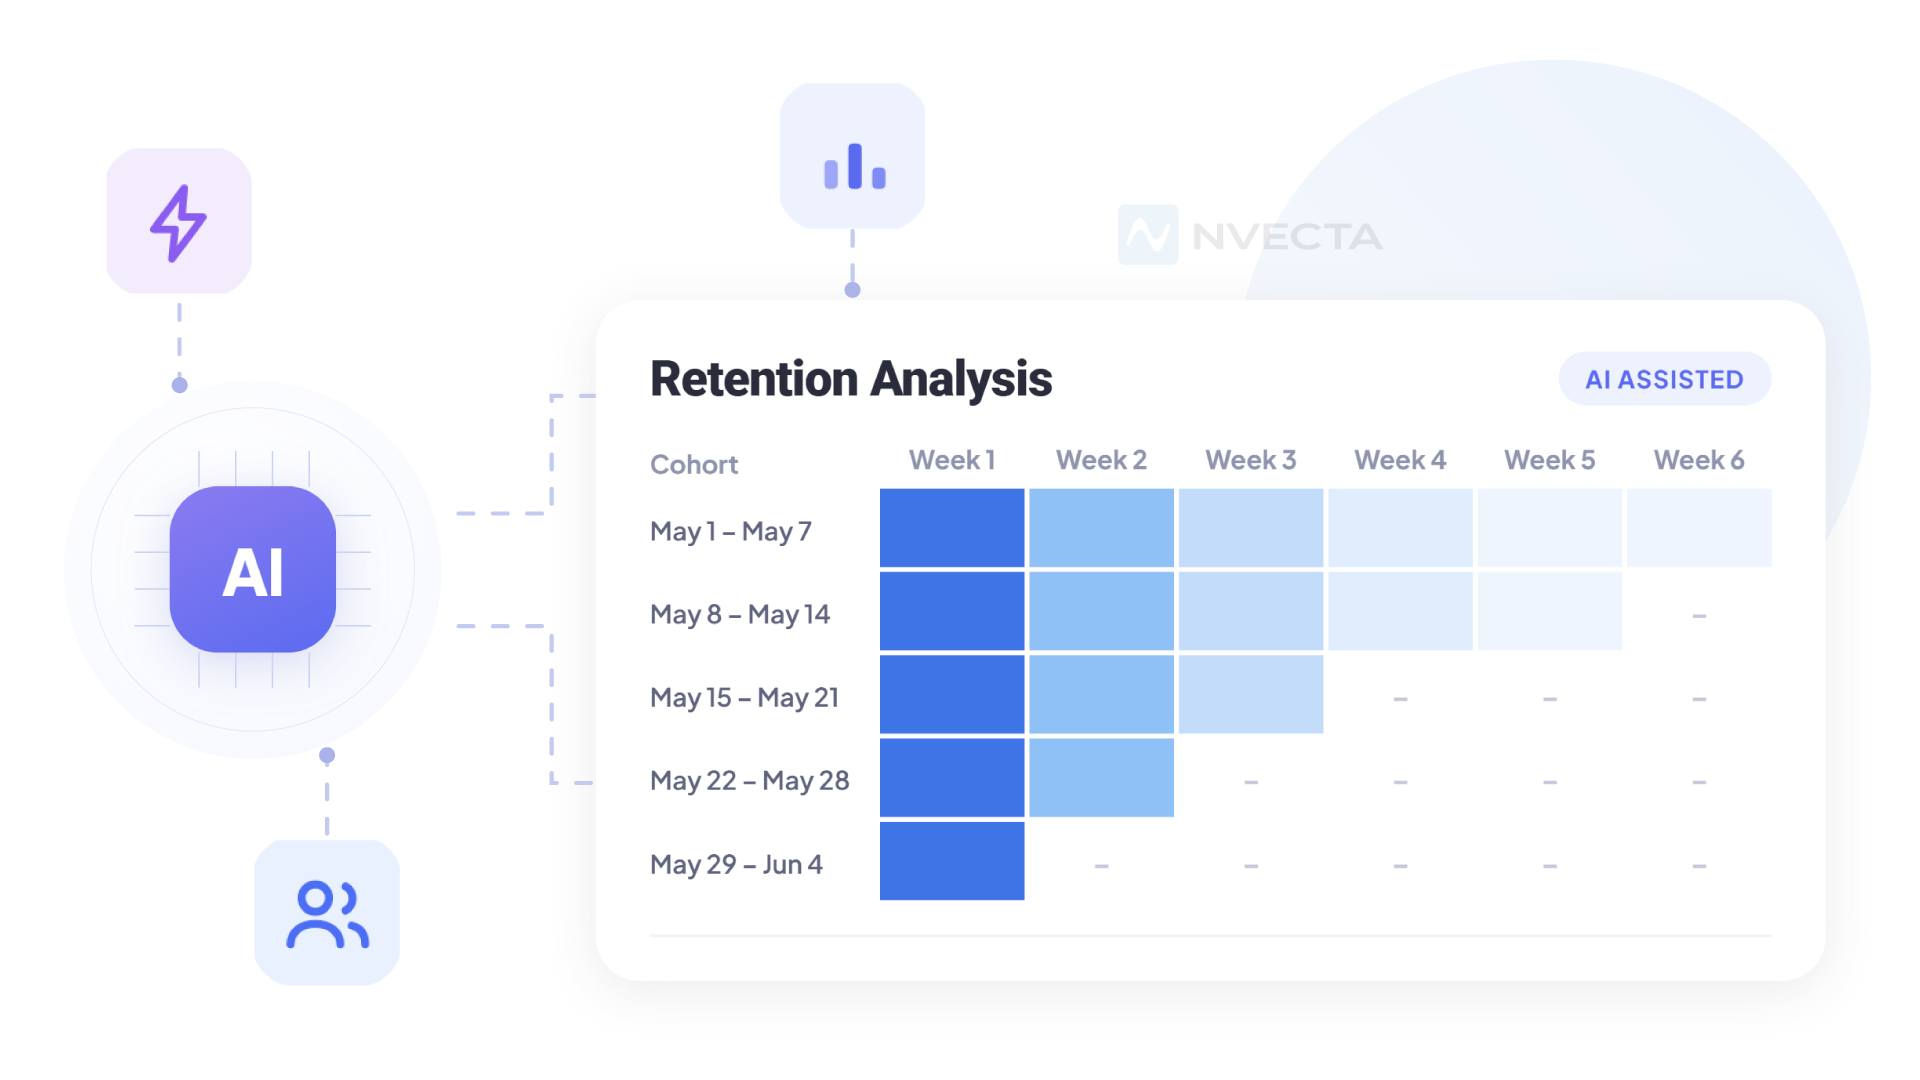
AI improves retention analysis by catching churn risk in real time, not once a month when a report shows a drop.
Real-time risk scoring
AI scans usage patterns across thousands of accounts at once and flags the ones showing early warning signs, before a customer decides to leave.
Unified customer profiles
AI pulls data from product, billing, and support tools into one profile per customer. Teams work from a single picture, not scattered dashboards.
Automated triggers
Once risk is flagged, AI can launch a retention campaign on its own, with no manual setup needed for each account.
How NVECTA Powers Business Growth with Retention Analysis
NVECTA is an AI-powered customer data platform. It facilitates business growth by turning retention analysis into a system that runs on its own, not a report someone builds each month.
Unified Customer Profiles
NVECTA pulls data from every channel- web, app, support, and billing into one profile per customer. Teams see the full picture in one place.
AI-powered Churn Scoring
NVECTA’s models score churn risk for every account in real time, using signals like a drop in usage, support tickets, and billing activity. Teams get a ranked list of at-risk customers, sorted by urgency.
Automated retention campaigns
Once risk is flagged, NVECTA builds targeted segments and triggers campaigns across email, SMS, push, and in-app messages, with no manual setup for each one.
Real-time dashboards
Retention trends update alongside revenue data, so leadership tracks both together, not as separate reports weeks apart.
For businesses across ecommerce, SaaS, and BFSI, this turns retention analysis from a monthly task into a steady part of how the business grows and tracks its users.
Conclusion
Every business loses some customers. What decides growth is how fast a team spots friction points, like who is about to leave, and later acts on time before they actually stop engaging.
Retention analysis turns scattered behaviour data into clear signals. Teams stop guessing and start acting on real patterns, from onboarding drop-offs to renewal risk.
NVECTA brings this together in one platform. It unifies customer data, predicts churn early, and triggers retention campaigns across channels.
See how NVECTA helps you turn retention data into steady, long-term growth.
Frequently Asked Questions
What is a good customer retention rate?
A good retention rate depends on the industry, but most subscription businesses aim for 85 per cent or higher each year. E-commerce brands often track monthly rates closer to 30 to 40 per cent, since purchase cycles are short and less steady than subscriptions.
How is retention analysis different from churn analysis?
Retention analysis measures who stays active and why. Churn analysis measures who leaves and when. Both use the same data, but one shows what works and the other shows what does not.
What tools are used for retention analysis?
Teams use a customer data platform to unify behaviour data, along with product analytics tools for event tracking and BI tools for reporting. Platforms like NVECTA combine data unification, cohort analysis, and predictive scoring in one system.
How often should retention analysis be done?
Most businesses review retention weekly for new products and monthly for mature ones, with a deeper cohort review each quarter. Subscription businesses should also check retention around renewal dates, since risk often rises near billing cycles.
Can AI predict customer churn before it happens?
Yes. AI models trained on usage, billing, and support data can flag accounts at risk of churn weeks before they cancel. This gives teams time to step in with a targeted offer or outreach before the customer leaves.
