













 Email
Email SMS
SMS Whatsapp
 Web Push
 App Push
 Audience Sync for Ads
 Popups
 Channel A/B Testing
  Control groups Analysis
 Frequency Capping
 Funnel Analysis
 Cohort Analysis
 RFM Analysis
 Signup Forms
 Surveys
 NPS
NPS Landing pages personalization
  Website A/B Testing
  PWA/TWA
 Heatmaps
 Session Recording
 Wix
Wix Shopify
 Magento
 Woocommerce
 eCommerce D2C
  Mutual Funds
 Insurance
 Lending
  Recipes
  Knowledgebase
 Developer Docs
 Product Updates
 App Marketplace
 Academy
 Ebooks
 Case Studies
 Blog
Blog Templates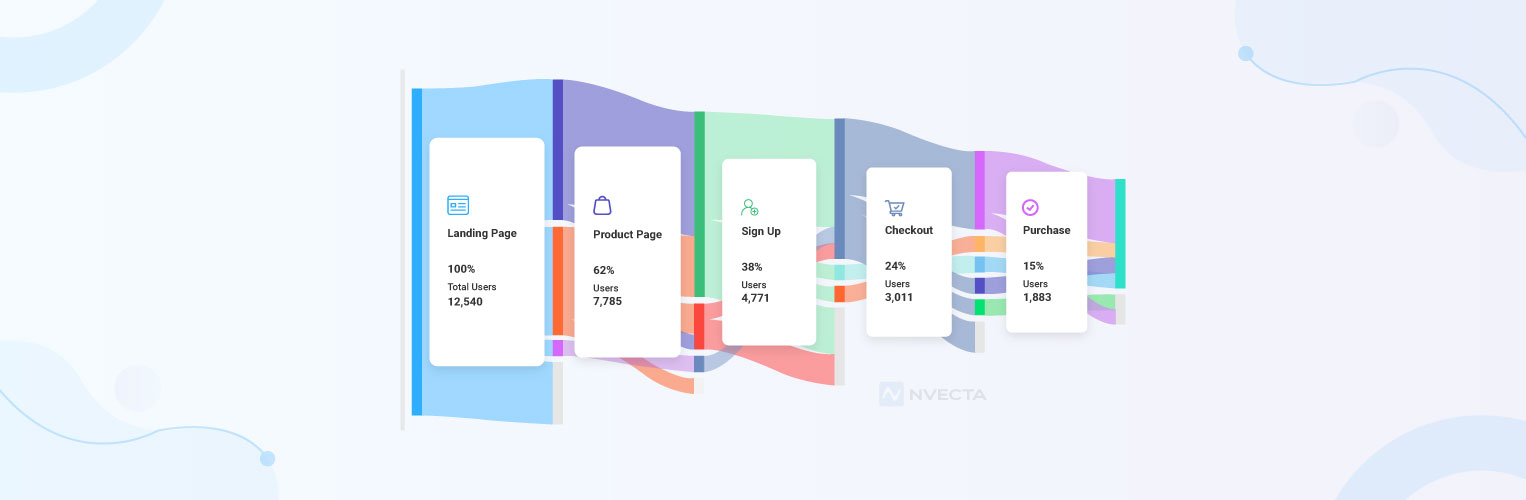
 Afreen Sheikh
User flow analysis studies the path a person takes through your website or app. It shows how they move from step to step to reach a goal. That goal could be a purchase, a signup or a checkout. You see where people move fast. You see where they slow down or leave.
Teams use this data to improve broken steps. Creating a smoother journey flow means better customer experiences.
Journeys have become more complex than ever. A signup can start in an email. It can end in an app three days later. Flow analysis tracks all the interaction channels a brand uses.
In this guide, we will cover,
- What is user flow analysis, why it matters, how it works, and industry-specific flow
- The difference between flow analysis, funnel analysis, and journey mapping
- Common drop-off points and how to avoid them
- How NVECTA powers user flow analysis
What is User Flow Analysis?
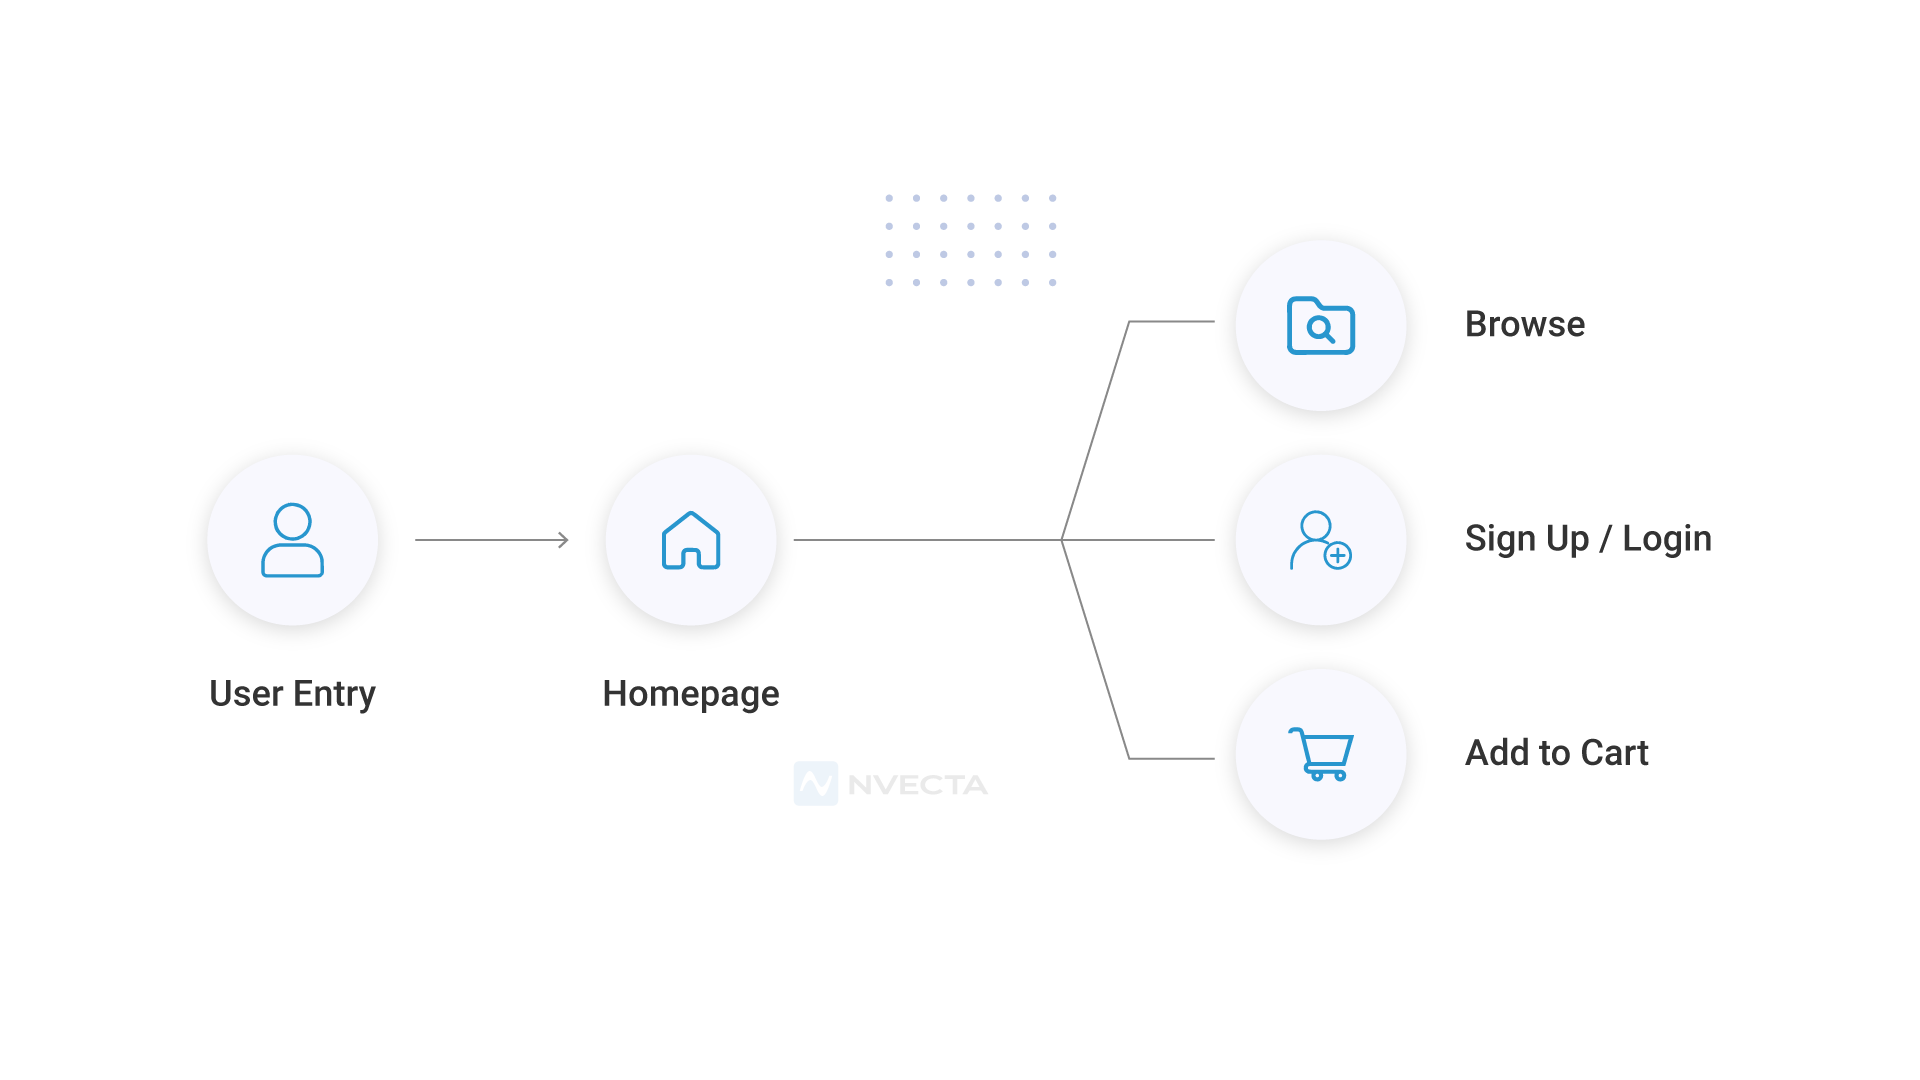
A user flow is the set of steps a person takes to finish a task in your product. Picture a signup flow: a user lands on the page, enters and verifies their email, sets a password, and reaches the dashboard. Each step is one screen or one click.
User flow analysis studies that are set up with real data. It tracks who enters each step. It tracks who exits and where they get stuck. This turns a diagram on a whiteboard into a live picture of what people do.
The difference matters here. A user flow is a map. User flow analysis is the study of how people move on that map, step by step, click by click.
Most teams start with a shorter flow like a landing page, Signup form, Email check or a first login. That short chain already holds clues about where users struggle.
A flow can be simple or long. A checkout flow might have four steps. An insurance application might have twenty. The length does not change the method. You still map the real path and study where people drop off.
User Flow Analysis vs Funnel Analysis vs Journey Mapping
A funnel, a user flow, and a journey map each measure something different. Teams use these three words as if they mean the same thing. Here is a quick comparison-
| Criteria | Funnel | User Flow | Journey Map |
|---|---|---|---|
| What it measures | Progress through defined stages toward a goal | How users navigate through a process | The complete customer relationship over time |
| Time frame | One session, conversion, or transaction | One flow from start to completion | Weeks or months across multiple touchpoints |
| Best for | Measuring stage-by-stage conversion | Finding friction and drop-offs | Understanding the customer lifecycle |
Use funnel analysis when you know the steps and want a rate. Use user flow analysis to see the real paths people walk. That path is often different from the one you drew. Use journey mapping to plan the full customer story, from the first ad click to renewal or a purchase.
Each view answers a different question. Pick the one that fits what you need to know.
Why User Flow Analysis Matters
Most product calls get made on a hunch. Flow analysis swaps the hunch for real data on what people did.
Understand real user behaviour
Teams build flows based on how they think people will act. Real data often shows recent behaviour shifts. Flow analysis shows the real clicks and pauses. Make optimisations based on facts and not on traditional guesswork.
Find and prioritise drop-off points
Every flow has weak points where people leave. Flow analysis finds these points and shows which one costs the most users, so teams know where to look first.
Improve conversion rate and revenue per visitor
Every step in a flow can cost you money when people leave it. Small pieces of friction, like a slow page, stop visitors from becoming buyers.
Reduce onboarding time and increase activation
New users decide fast if a product is worth the effort. A flow with too many steps to reach real value loses people before they find it.
Personalise the next step for each segment
A returning buyer and a first-time visitor stand at different points. One shared profile lets teams see a step that fits where they stand.
How to Conduct a User Flow Analysis: Step by Step
A user flow analysis follows seven steps, from setting a goal to testing your fixes.
Set the goal and pick the flow
Start with one clear goal, like a sale or a finished signup. Trying to study everything at once buries you in noise. A narrow focus gets you real answers.
Map the real path with real data
Gather the true steps users take, then compare them to the ones you drew on paper. The space between the plan and reality is where most real problems live.
Spot entry points, exit points, and loops
Note where users enter and where they leave. Watch for loops too. Some users repeat a step several times before they move on or give up. Loops often point to confusion.
Study drop-off and friction at each step
Look at the share of users who move from one step to the next. A steep drop between two steps means friction sits there. It could be a hard form, a slow page, or an unclear line of text.
Split the flow by user type, channel, and stage
Break the flow down by device, channel, or user type. A flow that works well on desktop can break down on mobile. This split only works if your data sits in one place.
Rank fixes by impact and effort
Rank each friction point by how many users it hits and how hard it is to fix. Start with the changes that give a big lift for a small amount of work.
Test the fix, then rerun the study
Ship a fix. Measure it against the old flow. User behaviour shifts as your product and your buyers change, so rerun the study each quarter.
Common User Flow Drop-Off Points And How To Fix Them
Some drop-off points show up again and again, in almost every product. Knowing these ahead of time saves a lot of guesswork later.
Signup and onboarding drop-off
Long forms and unclear value kill signups fast. Cut fields down to the bare minimum. Show users what they get before you ask for more data.
Checkout and payment drop-off
Hidden fees and forced signups push buyers away at the last step. Show the full cost early. Offer a guest checkout so people can skip the signup step.
Feature adoption drop-off
Users open a feature once and never return if they miss the quick win. Add a short prompt that shows the payoff on the first use.
Re-engagement and churn points
Quiet users often leave without a word. Watch for a drop in log-ins or feature use. Reach out before they cancel. Waiting until after is too late.
User Flow Analysis for Different Industries
The steps change by industry, but the method stays the same. No matter what you sell, the same process fits. Only the shape of the flow looks different.
Ecommerce
The flow runs from browsing to cart to checkout. Cart drop-off is the biggest leak. It often ties to shipping costs or a slow checkout page. Product pages with long load times add another drop-off point that teams often miss.
SaaS
The flow runs from signup to first value to feature use. Teams track how fast a new user gets their first real win in the product. A slow time to value is one of the strongest early signs of churn down the road.
Finance
The flow holds an application, ID checks, and a funded account. Each extra document request adds one more spot for someone to walk away. Trust also plays a big role here, so unclear security messaging can cause drop-off even when the process itself works fine.
Healthcare
The flow covers booking, a confirmation step, and the visit itself. Missed reminders and a messy booking page are common reasons people skip their visit. A short flow with clear time slots tends to fill faster than a long one with many options.
Travel
The flow runs from search to enquiry to booking. Long forms and slow follow-ups lose buyers who were ready to act right then. Speed matters more here than in most other fields, since a buyer can move to a rival listing in minutes.
How NVECTA Powers User Flow Analysis, From Mapping To Action
NVECTA is an AI-powered customer data platform with built-in user flow analysis. It shows how users move through each step, where they drop off, and what they do next. Teams can spot friction points in the flow, understand user behaviour, and take action without switching between multiple tools.
Unified customer profiles as the foundation for every flow
NVECTA builds one complete profile for every person while resolving multiple customer identities. It gathers web, app, email, and CRM data into that one profile. A flow built on this shows a buyer’s full path across every channel. Teams stop guessing whether a drop-off in the app is really the same person who bounced from an email link.
Real-time tracking, path visualisation, and AI-powered friction detection
NVECTA tracks clicks as they happen. It turns them into visual path reports. Its AI-powered churn prediction points out the steps that lose the most users, ranked by the revenue or activation at stake. Teams no longer need to see through raw event tables to find the weak point.
Behavioural segmentation and predictive next best action
Flows split by channel, plan, or stage. NVECTA uses a lead scoring model to score how likely a user is to finish or quit a flow. Teams can then act with the next best action before someone truly leaves.
Cross-channel activation based on flow analysis findings
Once a friction point shows up, NVECTA can send the next step right away. That could be an email, a push note, or an in-app feedback or nudge, all in one tool. The team that found the issue can also optimise it, without a handoff to another system.
Industry-ready flow templates
NVECTA includes flow templates for ecommerce checkout, SaaS signup, and finance applications, among others. Teams start from a working model already built for their industry. This cuts the setup time from weeks down to a few days for most new accounts.
Conclusion
User flow analysis turns behaviour into facts you can act on. It shows where people move forward, where they stall, and where they leave your product. The method stays simple. Map the real path. Find the friction. Fix what matters most. Test again.
Journeys rarely stay in one channel now. A signup that starts in an email and ends in an app needs data that follows the person across every screen. NVECTA links that data into one flow, from the first click to the final act. See how it works with a quick demo.
Frequently Asked Questions
What is user flow analysis?
User flow analysis is the study of the path users take through a website or app to finish a task. It shows where people move forward and where they stop or leave.
How to perform a user flow analysis?
Set a goal. Map the real path with real data. Find where users drop off. Split by user type. Rank the fixes. Test the results and repeat.
What is the difference between a user flow and a funnel?
A funnel tracks a fixed set of steps and gives you a rate. A user flow shows every path people truly walk, plus the ones you did not plan for.
What tools are used for user flow analysis?
Teams use behaviour tools that track events and build path and funnel reports. These tools let you split users by channel or stage. Some, like NVECTA, also link that data across channels.
How often should you run a user flow analysis?
Run it after big product changes. Also, run it on a set schedule, like each quarter, since user behaviour shifts as your product and buyers change.
Can user flow analysis work across web, app, and email, or only in one product?
It can span every channel if your data links up. One customer profile lets you follow a person from an email click to an app visit, in a single flow.
