














 Email
Email SMS
SMS Whatsapp
 Web Push
 App Push
 Audience Sync for Ads
 Popups
 Channel A/B Testing
  Control groups Analysis
 Frequency Capping
 Funnel Analysis
 Cohort Analysis
 RFM Analysis
 Signup Forms
 Surveys
 NPS
NPS Landing pages personalization
  Website A/B Testing
  PWA/TWA
 Heatmaps
 Session Recording
 Wix
Wix Shopify
 Magento
 Woocommerce
 eCommerce D2C
  Mutual Funds
 Insurance
 Lending
  Recipes
  Knowledgebase
 Developer Docs
 Product Updates
 App Marketplace
 Academy
 Ebooks
 Case Studies
 Blog
Blog Templates
 Aparupa Saha
Machine learning & product analytics didn’t use to talk to each other much. ML lived with the research team, tucked away in a notebook somewhere nobody outside data science ever opened. Product analytics lived on a dashboard that your PM refreshed every Monday, full of charts explaining what had already happened by the time anyone looked at them.
That’s changed. Not because the tech suddenly got smarter overnight, but because “what happened last week” stopped being enough of an answer. Signups dropped 12%? Fine, but why, and who’s about to churn next, and what should someone actually do about it before the quarter closes? That’s the real shift here, going from reporting on the past to acting on what’s coming.
Machine learning in product analytics means training models on historical user behaviour so they can predict what a specific user is likely to do next. Churn, conversion, feature adoption, fraud. Traditional product analytics counts events and reports them back to you. Machine learning takes the same events and outputs a probability attached to a person, which somebody can then act on.
Where Analytics Sits: Four Layers
Analytics maturity gets described in four layers, and most teams are stuck somewhere in the first two without realising it.
Descriptive analytics tells you what happened. Signups fell 12% last week. This is your standard dashboard, and it is where the majority of product teams live.
Diagnostic analytics tells you why. Signups fell because the mobile checkout broke on Android 14. Getting here usually takes an analyst, a few hours, and some luck.
Predictive analytics tells you what is likely to happen. These 400 accounts have a 70%+ probability of cancelling before their next renewal. You cannot get here with SQL. You need a model.
Prescriptive analytics tells you what to do. Send this cohort a usage nudge, route these twelve accounts to a human, ignore the rest. This is where the money actually is, and almost nobody gets to it.
Machine learning is what carries you from layer two to layers three and four. Everything below that line, you can do with a good analyst and a well built dashboard. Everything above it, you cannot.
What Machine Learning Actually Adds to Product Analytics
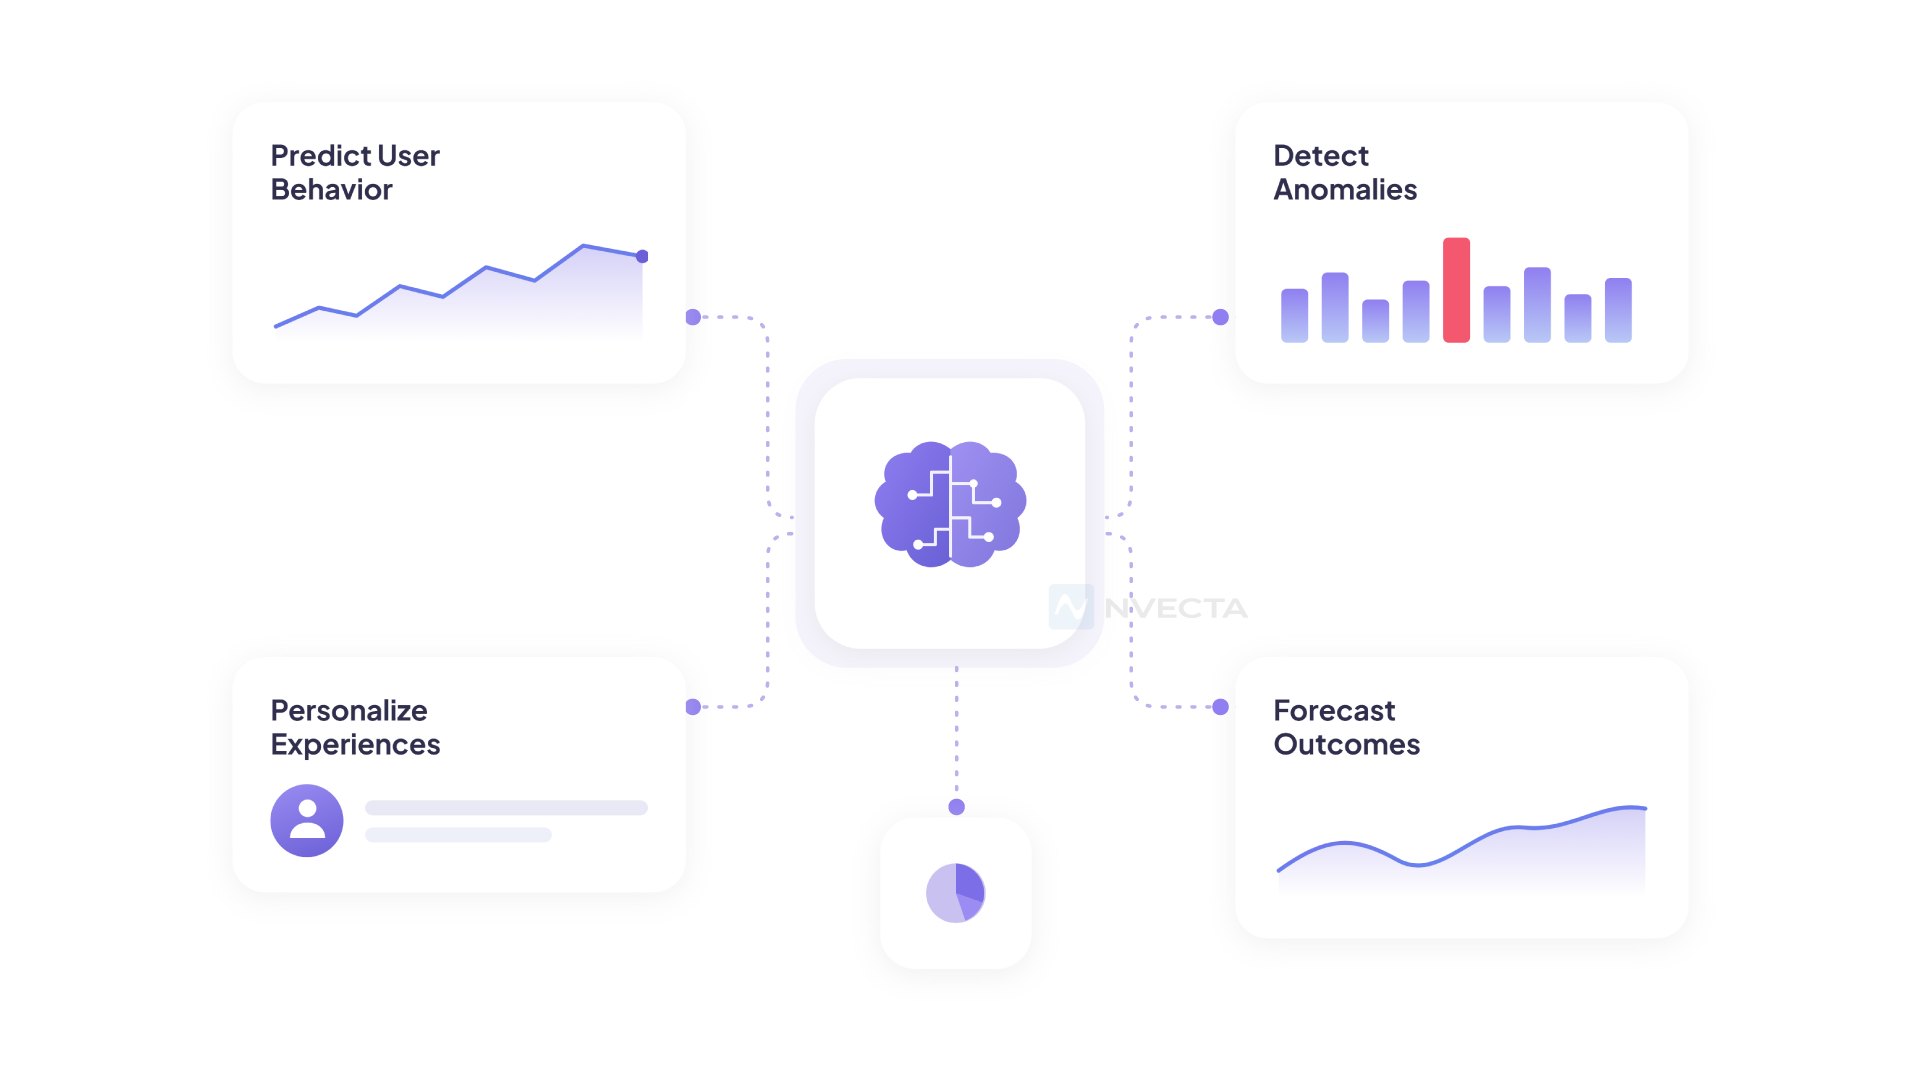
Here’s an uncomfortable truth. A lot of what gets marketed as “AI-powered analytics” is really just a rules engine wearing a nicer outfit. If a tool can’t do at least the following, it’s probably not machine learning in any meaningful sense.
Take pattern-finding first. A product manager glancing at a funnel chart can tell you that mobile conversion dipped last Tuesday.
What they almost certainly can’t tell you, without a model doing the heavy lifting, is that users who hit the pricing page twice within four minutes on a specific browser convert at half the normal rate.
Nobody’s manually cross-referencing that combination of variables. A model doesn’t need to be told to look for it either, which is sort of the point.
Then there’s prediction, which is arguably the bigger deal. Churn scoring, propensity modelling, and next-best-action recommendations—none of that works without a model trained on historical behaviour, making a probabilistic call about what happens next.
Dashboards, no matter how well designed, only describe what has already occurred. They can’t tell you what’s likely to occur tomorrow.
And it adapts. This one gets overlooked constantly. A rules-based segment like “users inactive for 14 days” sits frozen until a human goes in and changes it.
A trained model keeps retraining on fresh data, quietly adjusting its own predictions as behaviour shifts. For anything seasonal or fast-moving, like eCommerce and lending, that difference compounds quickly.
Traditional Analytics vs ML-Driven Analytics
Put side by side, the gap is easier to see.
| Dimension | Traditional Product Analytics | ML-Driven Product Analytics |
|---|---|---|
| Core question answered | What happened? | What will happen, and what should we do about it? |
| Segmentation | Static, rule-based (e.g., “users in the US”) | Dynamic, behaviour-based clustering that updates on its own |
| Churn detection | Reactive, tied to a fixed inactivity window | Predictive, scored before the user actually leaves |
| Personalization | Manual rules (“if X, show Y”) | Model-driven recommendations that adapt per user |
| Time to insight | Days to weeks of manual analysis | Near real-time |
| Scalability | Falls apart past a few thousand rules or segments | Scales across millions of events without manual upkeep |
None of this means dashboards are obsolete, to be clear. They’re still how most teams report results and keep stakeholders honest, and that’s not going anywhere soon. It’s just that dashboards answer yesterday’s question well. Machine learning is the thing trying, imperfectly, to answer tomorrow’s questions.
Where Machine Learning Shows Up in a Product Analytics Stack
Most teams start with churn scoring, and for good reason. A model pulls in usage frequency, feature adoption, support ticket volume, payment history, whatever’s available, and spits out a churn probability per user.
Subscription and lending businesses lean on this one hard, mostly because keeping an existing customer is cheaper than winning a new one, and everybody already knows that math.
Behavioural segmentation is the quieter win. Instead of a marketer hand-defining “power users” as anyone logging in five times a week, clustering algorithms group people by actual behavioural similarity.
Sometimes that surfaces a segment nobody had thought to define in the first place, which is the kind of thing that only shows up when you stop guessing.
Anomaly detection matters more than people give it credit for. A sudden dip in a funnel step, weird latency spikes, fraud signals in BFSI or insurance, models flag these the moment they happen instead of waiting for someone to eyeball a chart and go “huh, that’s odd.”
Next-best-action is where this starts blending into journey-orchestration territory. Should this specific user get an email, a push notification, or an in-app nudge right now? A model can answer that with actual probability behind it, rather than a marketer’s best guess.
Feature adoption forecasting rounds things out. Which users are likely to adopt a new feature, based on how similar users behaved in past releases? Knowing that in advance means onboarding effort goes where it’ll actually move the needle, not wherever seems most urgent that week.
If you want a rough map of what actually runs under each of those, here it is. Nothing exotic. Most of this has been around for a decade.
| Use case | Typical model | What it needs | What it gives you |
|---|---|---|---|
| Churn scoring | Logistic regression, gradient boosting (XGBoost, LightGBM) | A few thousand labelled users who did or did not churn | A probability per user, 0 to 1 |
| Behavioural segmentation | K-means, DBSCAN, hierarchical clustering | Event data per user, no labels required | Groups nobody defined by hand |
| Anomaly detection | Isolation forest, seasonal decomposition, autoencoders | Historical baselines with seasonality | An alert, ideally before the dashboard shows it |
| Next-best-action | Contextual bandits, uplift models | Past interventions and their outcomes | Which nudge, to whom, and when |
| Feature adoption forecasting | Collaborative filtering, survival analysis | Adoption curves from past releases | Ranked list of likely adopters |
| Time-to-churn | Cox proportional hazards, survival models | Timestamped events plus churn dates | Not just if, but roughly when |
A note on that last row, because it gets missed. Knowing a user will churn is useful. Knowing they will churn in about three weeks is what lets you actually schedule an intervention. Most churn models skip the timing question entirely.
If your vendor cannot tell you which of these is running under their “AI insights” button, that is worth asking about.
The Half of Your Data That Isn’t Events
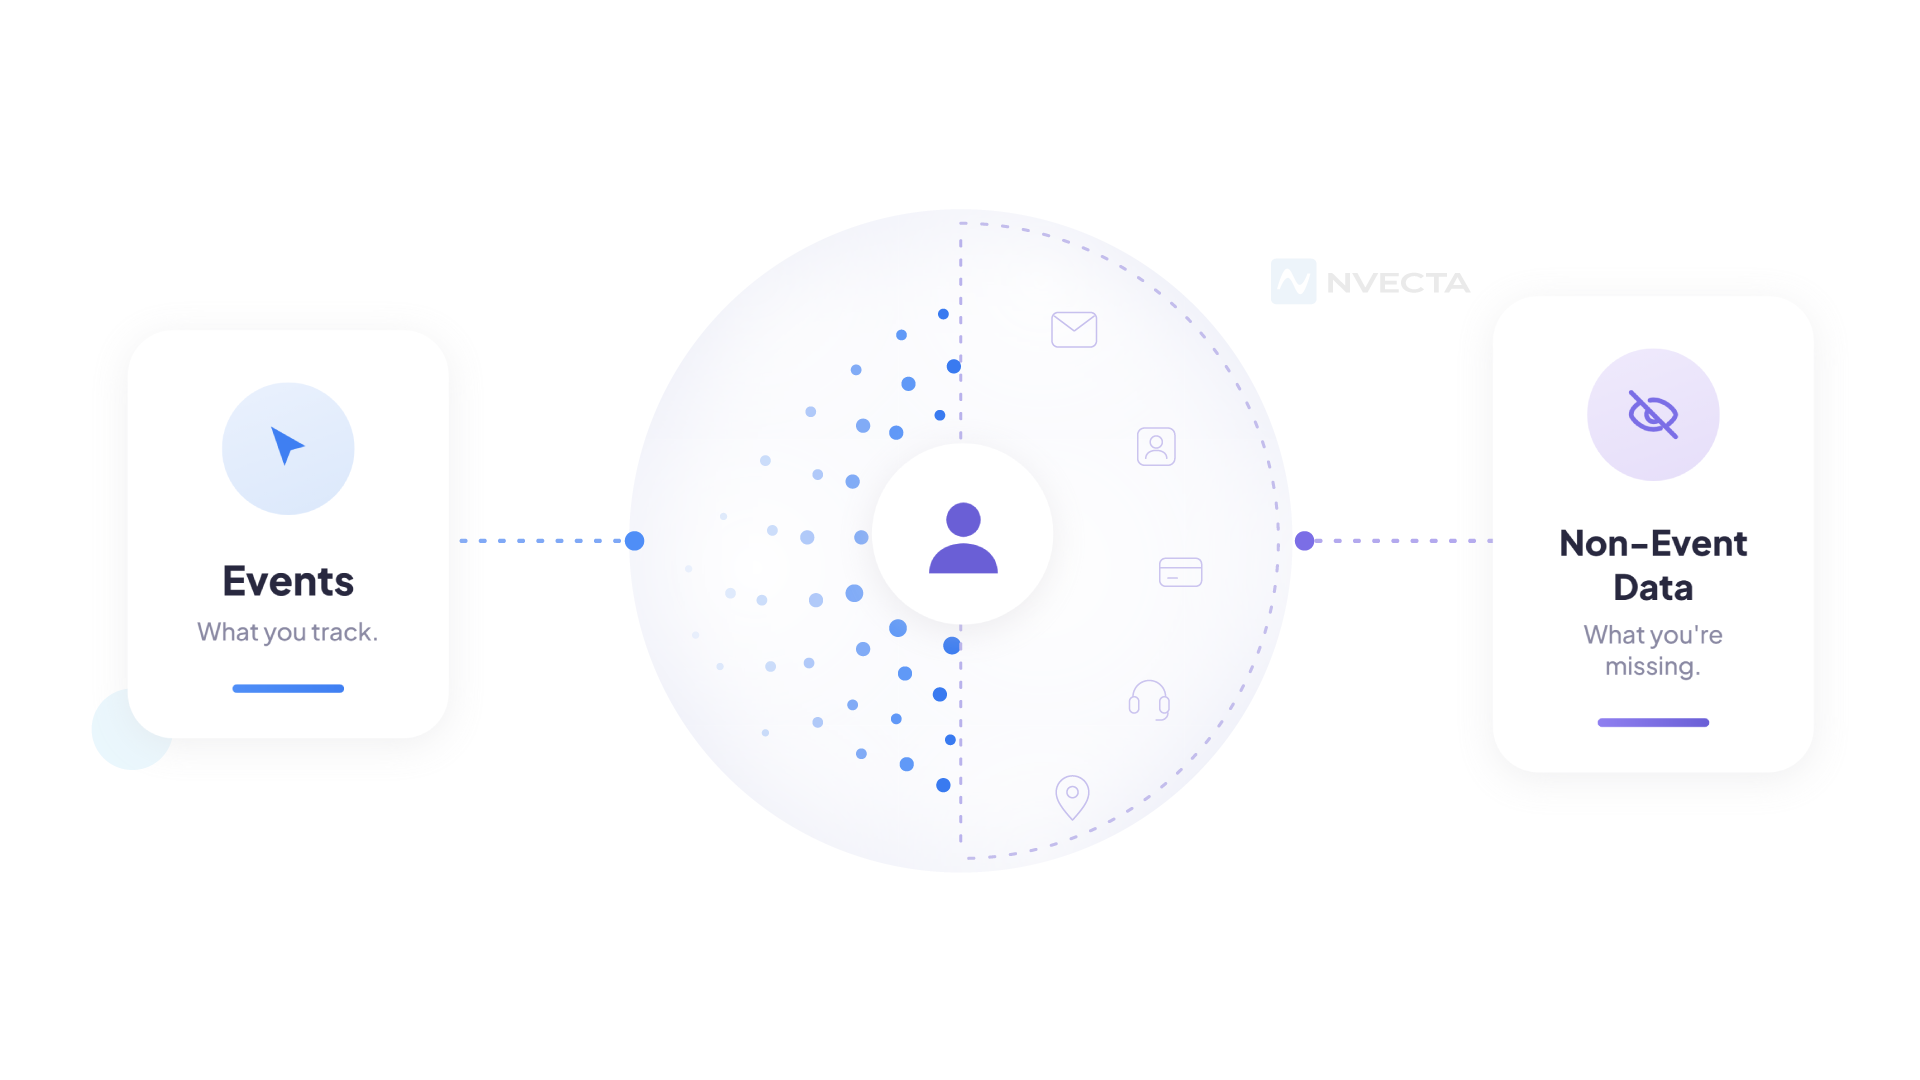
Everything above assumes your data is rows and columns. Clicks, sessions, transactions, timestamps.
But a good chunk of what your customers tell you arrives as sentences. Support tickets. NPS comments. App store reviews. Sales call notes. Cancellation reason free-text, which is the single most honest data source in most companies and the one nobody reads.
Historically, this went into a folder and stayed there. Somebody skimmed a hundred tickets before a QBR, drew a conclusion, and everyone nodded.
Language models changed the economics of that. You can now run sentiment analysis across every ticket a user has ever filed, extract the recurring themes, and feed the result into your churn model as a feature.
A user who wrote “this is the third time this month” in a ticket is a very different risk profile from one who wrote, “no rush, whenever you get a chance.” Both would look identical in an event stream. Both filed one ticket.
The interesting part is what happens when you combine the two. Behavioural data tells you a user’s engagement dropped. Text data tells you why they are annoyed. Put together, you get a churn score that a customer success rep can actually open a conversation with, instead of an unexplained number that says “72% risk” and nothing else.
Most product analytics tools still treat text as a separate universe. That is starting to look like a mistake.
The Data Problem Nobody Talks About
Nobody selling analytics software wants to lead with this, but here it is anyway. Machine learning is only as good as the data it’s built on, and most companies’ data is genuinely a mess.
Customer data is scattered across five different tools. Product events are tagged inconsistently, sometimes by three different people over three different years. Marketing’s definition of “active user” doesn’t match the product’s definition, and nobody’s quite sure whose is right.
You can build the most elegant model architecture in the world, and it won’t matter one bit if it’s trained on fragmented, duplicated, or stale data.
Honestly, this is the real reason so many “AI analytics” initiatives quietly stall before ever reaching production. It was never really the algorithm’s fault. It’s the plumbing underneath.
Which is exactly why customer data platforms and product analytics are converging into the same conversation now. A CDP’s whole job is stitching identity and behaviour across every touchpoint into one clean profile per person.
Skip that step, and machine learning ends up working off a partial, sometimes contradictory picture of who’s actually on the other end.
Roughly, the shape of it looks like this.
Events land from web, mobile, backend, and support systems. The CDP resolves them into one profile per human.
Features get computed from those profiles, things like sessions in the last 7 days, days since last purchase, ticket count. The model reads features and writes back a score. Journey orchestration reads the score and does something.
Break any link in that chain and the whole thing degrades to a chart. Most companies break it at step two.
Diagram brief for your designer: left-to-right flow, 5 boxes. Sources (web / mobile / backend / support) → CDP (identity resolution) → Feature store → Model (churn, propensity, NBA) → Journey orchestration. Ek dotted arrow model se wapas CDP tak, labelled “retrain”. Alt text: “How machine learning fits into a product analytics and CDP architecture.”
The Compliance Question, Especially If You’re in Lending
Here is where a lot of ML-in-analytics writing quietly stops, because most of it is written for US SaaS companies where the stakes are a churn email.
If you are scoring people in lending, insurance, or banking, a model output is not a marketing suggestion. It is a decision about a person’s money, and somebody may eventually have to explain it in a room.
Two things follow from that.
The first is explainability. A gradient boosted model with 200 features can be brilliant at ranking risk and useless at telling you why it flagged account number 4471.
If a customer asks why they were declined, or offered worse terms, “the model said so” is not an answer that survives contact with a regulator. This is why plenty of lenders still run logistic regression in production despite having better options sitting on a shelf. Interpretability is a feature, not a compromise.
The second is consent and data handling. India’s Digital Personal Data Protection Act, 2023 now has notified rules, and the substantive obligations land in May 2027 with an intermediate consent manager deadline in November 2026.
That sounds distant. It is not, if your model was trained on data you collected under a consent notice that never mentioned profiling.
One clause deserves specific attention. The DPDP Rules require Significant Data Fiduciaries to carry out due diligence verifying that their technical measures, including algorithmic software, do not pose a risk to the rights of Data Principals.
Read that again if you build models. It means an algorithm audit is being written into Indian law, not just recommended.
Practical version, for anyone building this now:
- Log what data trained which model version, and when. If you cannot reconstruct it, you cannot defend it.
- Keep a per-decision explanation, even a crude one. Top five contributing features is usually enough.
- Check that consent covers profiling and automated scoring, not merely “improving our services.”
- Test for bias on protected attributes before deployment, not after a complaint.
- Build a deletion path. If a user withdraws consent, their data has to leave the training set at the next retrain.
None of this is glamorous. All of it is cheaper to build in at the start than to retrofit in 2027.
What Good ML-Driven Product Analytics Looks Like in Practice
Say a mid-size eCommerce brand has a first-time visitor who browses three product pages, adds something to the cart, then just leaves. No purchase. A traditional setup logs it as an abandoned cart and fires off a generic reminder email a day later. Standard playbook.
An ML-driven setup handles it differently. It scores this specific visitor’s likelihood to convert against thousands of similar historical sessions, decides a 10% discount sent within two hours would move the needle far more than a generic reminder for this exact behaviour pattern, and triggers it automatically.
Nobody sat down and hand-wrote that rule. The model learned it from data, on its own.
That’s really the whole difference, when you boil it down. Analytics that reports on what happened versus analytics that actually does something about it.
Common Mistakes Teams Make
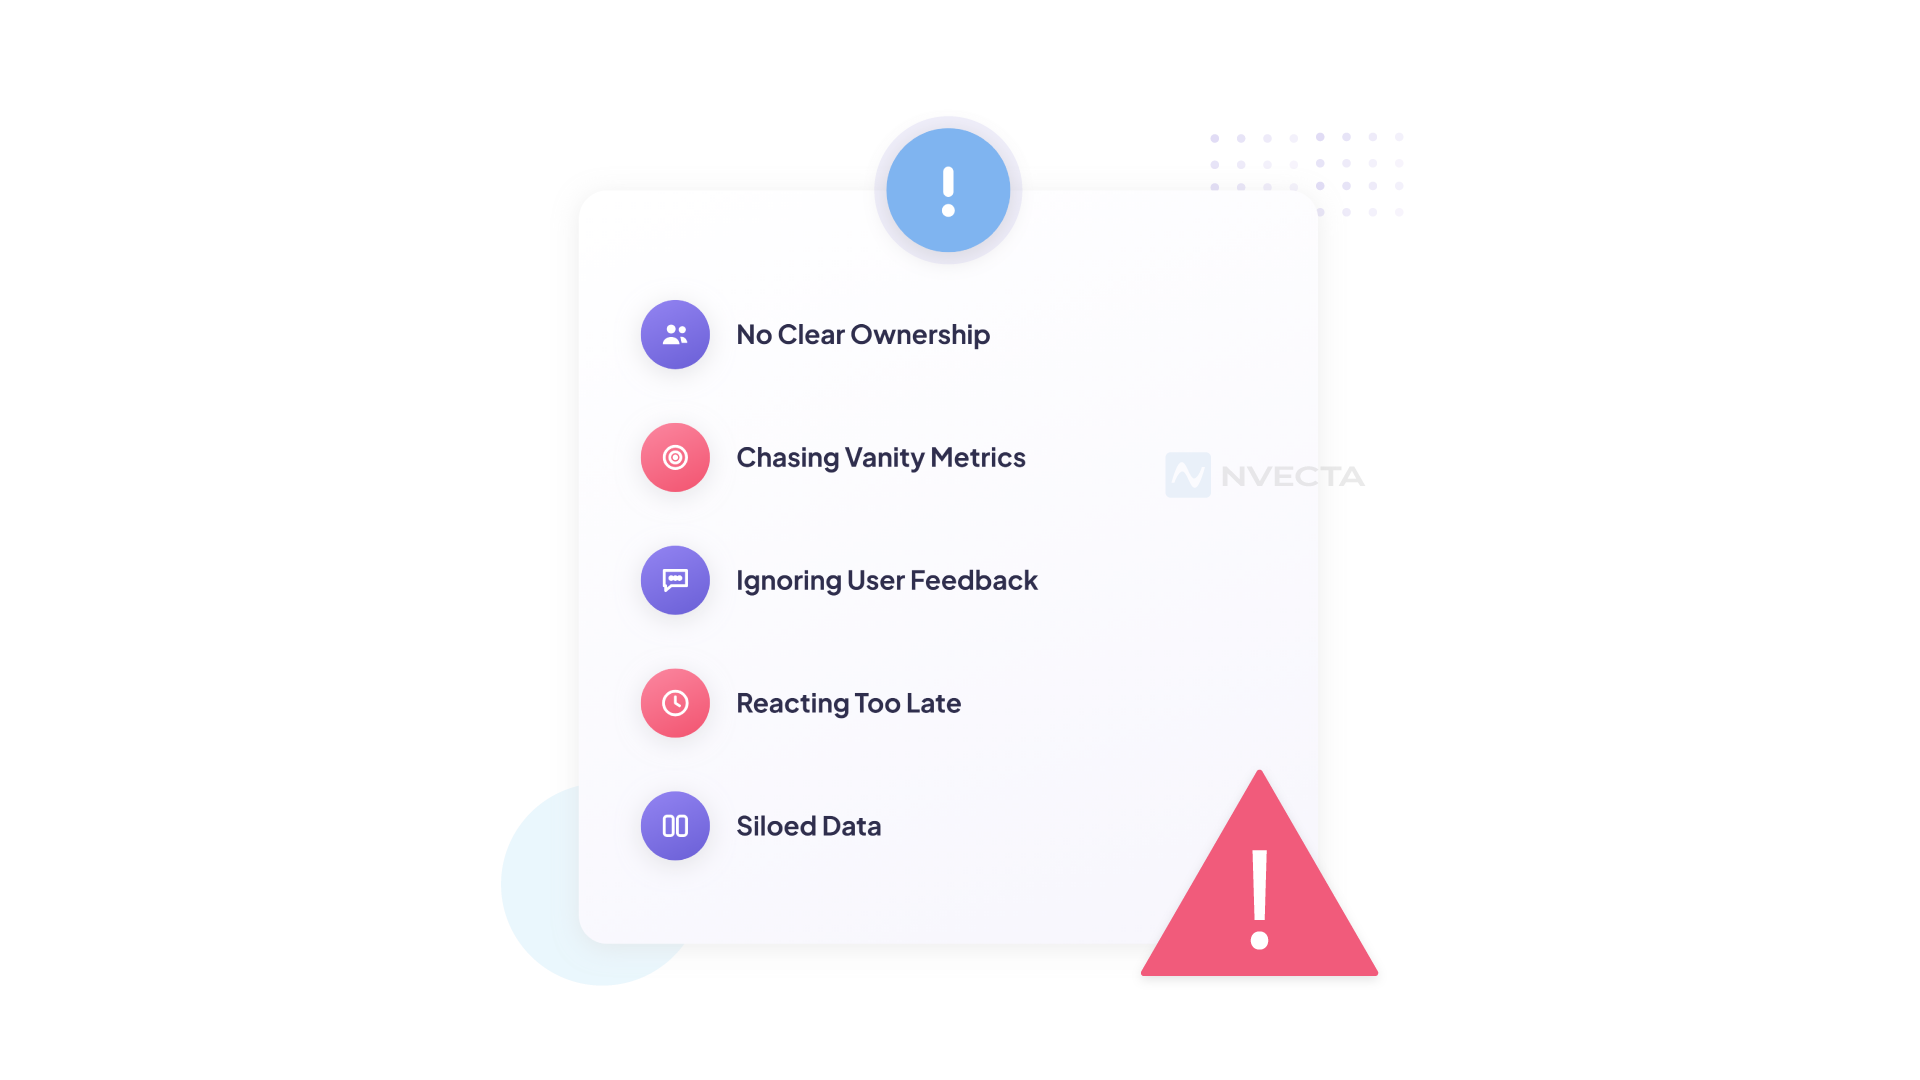
A handful of patterns keep showing up when companies start layering ML onto their product analytics, and most of them aren’t really about the technology.
The biggest one: treating it as a one-time project rather than something ongoing. Models drift quietly, and user behaviour shifts underneath them. A churn model trained on pre-holiday data back in November might already be wrong by March, and nobody notices until performance quietly slips.
Skipping identity resolution is another. If the same person shows up as three separate profiles across web, mobile, and email, no model, however good, can accurately predict their behaviour. It’s not actually looking at one person. It’s looking at three fragments and guessing.
There’s also a tendency to over-index on model complexity for its own sake. A simple model trained on clean, unified data will usually beat a sophisticated one trained on messy data, every time.
This gets overlooked constantly, probably because “we’re using advanced ML” sounds better in a deck than “we cleaned up our data first.”
And then there’s the loop that never closes. Predictions sitting in a dashboard, never triggering a campaign, a notification, an alert to sales, anything, are just expensive charts at that point. The actual value of ML in product analytics lives in what happens after the prediction. Not in the prediction itself.
How Do You Know the Model Is Any Good?
Accuracy is the wrong metric, and it is the one everyone reaches for first.
Say 5% of your users churn each month. A model that predicts “nobody will churn” is 95% accurate. It is also worthless. This is not a hypothetical failure mode. It is what happens by default on imbalanced data, which is all churn data.
What to look at instead:
Precision answers “of the users we flagged, how many actually churned?” Low precision means your CS team wastes time chasing people who were never leaving.
Recall answers “of the users who churned, how many did we catch?” Low recall means the model is missing the ones you needed.
You trade one against the other. Where you sit on that trade-off is a business decision, not a data science one. If the intervention is a cheap automated email, take low precision and cast a wide net. If it is a human on a phone call for forty minutes, precision matters much more.
ROC AUC gives you a single number for how well the model separates churners from non-churners, useful for comparing two model versions against each other. Anything under 0.7 is weak. Above 0.85 on real customer data, be a little suspicious that something leaked from the future into your training set.
Then there is drift, which is the quiet one.
A model does not break loudly. It degrades. Behaviour shifts, a competitor launches, a pricing page changes, and predictions that were sharp in January are mush by June. Nobody notices because the dashboard still renders and the numbers still look like numbers.
Three things keep this honest. Monitor the input distributions, not just the output, because inputs drift first. Retrain on a schedule that matches how fast your business moves, monthly for eCommerce, quarterly for enterprise software.
And run the new model alongside the old one for a cycle before you swap them, so you can see whether it actually improved anything.
A model in production is a system you maintain. It is not a deliverable you ship.
Build vs Buy
The honest answer depends on one question: is predictive scoring your product, or is it something your product needs?
Building makes sense when the model is your differentiator. A fraud detection company builds its own models. A credit underwriter builds its own models. If a competitor could buy the same scoring off the shelf and match you, you were never differentiated by it.
Assume roughly six to nine months to first production model if you are starting from scratch. That is not model training time, which is days. That is identity resolution, event schema cleanup, feature pipelines, monitoring, and the retraining loop. The model is maybe 10% of the work. Everyone underestimates the other 90%, every single time.
Buying makes sense when you want churn scores in your journey builder next quarter and you do not have a data engineering team sitting idle. Which describes most companies, including most companies that insist they will build. In that situation, comparing machine learning companies that specialize in custom model development and deployment can help you evaluate whether bringing in an external partner makes more sense than building the entire ML infrastructure in-house.
The middle path that quietly works for a lot of teams: buy the platform, keep the ability to bring your own model. Score users on the vendor’s models on day one, swap in your own feature or model later if it beats theirs. You get speed now and control later.
The failure mode to avoid is hiring two data scientists, giving them a data warehouse full of inconsistent event names, and expecting a churn model by Q3. They will spend Q3 fixing event names. They will be right to.
Where to Actually Start
If you are doing this from zero, resist the urge to start with the model.
Start by picking one decision. Not one metric, one decision. “Which trial accounts should our CS team call this week” is a decision. “Improve retention” is not. If nobody would do anything differently based on the output, you have picked wrong, and you will build a very accurate chart that changes nothing.
Then fix identity. Merge web, mobile, and email into one profile per person. This is boring and it is the entire ballgame. A model looking at one human as three fragments is not a bad model, it is a model answering a different question than the one you asked.
Then pick the simplest thing that could work. Logistic regression on ten clean features. If it beats your current rule based segment, you have a baseline and you have proof. If it does not, the problem was never the algorithm, and now you know that too, cheaply.
Then close the loop before you improve the model. Wire the score into something that fires. An email, a Slack alert to sales, an in-app message. A prediction that does not trigger an action is a chart with extra steps.
Only after all that should you go back and make the model better. Most teams do this in exactly the reverse order and then wonder why the project stalled somewhere around month five.
How NVECTA Brings Machine Learning & Product Analytics
This is more or less the exact gap NVECTA was built to close. Rather than treating machine learning as a bolted-on analytics feature,
NVECTA runs it natively across the customer data platform, so predictive scoring, behavioural segmentation, and next-best-action recommendations are built on a single unified customer profile rather than scattered event logs pulled from different tools.
What that looks like day-to-day: churn scores and propensity models don’t sit in a separate BI tool, disconnected from everything else.
They feed straight into NVECTA’s journey orchestration and AI Co-Marketer, so a predicted dip in engagement can trigger a real, personalized action in real time, whether that’s eCommerce, BFSI, insurance, or lending, without a data team manually stitching pipelines together behind the scenes.
That’s really the difference between analytics you read about later and analytics that does something while it still matters.
FAQs
What is the difference between product analytics and machine learning analytics?
Product analytics traditionally reports on what has already happened, things like conversion rates or drop-off points. Machine learning analytics adds a predictive layer on top, forecasting what’s likely to happen next, such as churn risk or the odds that a user will adopt a new feature.
Do small companies need machine learning for product analytics, or is it only for enterprises?
It’s less about company size than data volume and structure. A company with a few thousand clean, well-organised user profiles can still get real value from ML-driven scoring. What matters more is whether the underlying data is unified enough to train something reliable on, not headcount.
How much data is needed before machine learning models become useful?
There’s no magic number, but most churn and propensity models need at least a few thousand labelled examples, users who did or didn’t convert, churn, or adopt a feature, before predictions start being reliable. Below that threshold, results tend to get noisy fast.
Can machine learning replace traditional dashboards entirely?
No, and honestly, it shouldn’t try to. Dashboards are still useful for reporting, keeping stakeholders on the same page, and sanity-checking trends at a glance. Machine learning complements that by adding prediction and automation on top, not by replacing the need to see what happened.
What’s the biggest barrier to adopting ML in product analytics?
Fragmented data, by a wide margin, more than anything else. Most teams underestimate how much of an “ML project” is actually just a data unification project in disguise. Identity resolution and clean event tracking end up mattering more than which model you pick.
How does machine learning improve customer retention specifically?
By scoring churn risk before someone actually leaves, not after the fact. That gives teams an actual window to step in, a discount, an outreach email, a support touchpoint, while the customer’s still recoverable rather than already gone for good.
Is machine learning in product analytics only useful for marketing teams?
Not even close. Product teams use it for feature adoption forecasting, engineering uses it for catching anomalies in performance metrics, and fraud or risk teams in BFSI and lending lean on it for real-time risk scoring. Marketing’s just one use case among several.
Which machine learning algorithms are used in product analytics?
Fewer than the marketing implies. Churn and propensity scoring usually runs on logistic regression or gradient boosting, XGBoost and LightGBM being the common ones. Behavioural segmentation uses clustering, typically K-means or DBSCAN. Anomaly detection uses isolation forests or seasonal decomposition. Next-best-action leans on contextual bandits and uplift models. The choice matters less than the data quality feeding it, which is not what most vendors want to talk about.
How do you know whether a churn model is accurate?
Not by looking at accuracy. If 5% of your users churn, a model predicting that nobody churns is 95% accurate and completely useless. Look at precision, which tells you how many flagged users actually churned, and recall, which tells you how many churners you caught. ROC AUC is useful for comparing two versions of a model against each other. Anything below 0.7 is weak.
Is machine learning based customer scoring compliant with India’s DPDP Act?
It can be, but not automatically. Consent needs to cover profiling and automated scoring, not just a generic line about improving the service. The DPDP Rules also require Significant Data Fiduciaries to verify that their algorithmic software does not put Data Principals’ rights at risk, which is effectively an algorithm audit obligation. Substantive obligations take effect in May 2027. Check with counsel rather than a blog post, this one included.
Should we build machine learning in-house or use a platform?
Build if predictive scoring is the product you sell. Buy if it is something your product needs in order to work. Assume six to nine months to a first production model if you build from scratch, and note that most of that time goes to identity resolution and data pipelines rather than to the model itself. A reasonable compromise is to buy the platform and keep the option to bring your own model later.
