














 Email
Email SMS
SMS Whatsapp
 Web Push
 App Push
 Audience Sync for Ads
 Popups
 Channel A/B Testing
  Control groups Analysis
 Frequency Capping
 Funnel Analysis
 Cohort Analysis
 RFM Analysis
 Signup Forms
 Surveys
 NPS
NPS Landing pages personalization
  Website A/B Testing
  PWA/TWA
 Heatmaps
 Session Recording
 Wix
Wix Shopify
 Magento
 Woocommerce
 eCommerce D2C
  Mutual Funds
 Insurance
 Lending
  Recipes
  Knowledgebase
 Developer Docs
 Product Updates
 App Marketplace
 Academy
 Ebooks
 Case Studies
 Blog
Blog Templates
 Afreen Sheikh
Product analytics for B2B teams means tracking how whole accounts, not just single users, engage with your product. It turns raw usage data into account-level signals. Logins, feature clicks, and seat activation turn into scores like engagement, expansion readiness, and churn risk. The problem is where that data gets stored. Deal stage stays in the CRM. Usage stays inside the product. Support tickets are in another tool. Since these systems work independently, it becomes a challenge to connect the data insights of each system and gain value from them. Teams end up guessing which accounts are performing, or which are quietly slipping away.
A customer data platform solves this problem for B2B teams. It pulls product data, CRM data, and billing data into one account profile. NRR, feature adoption, and support tickets are now stored under the same account ID, so a drop in usage appears much earlier, and the teams can act on it.
This is a comprehensive guide to product analytics for B2B teams- what it means, the metrics and techniques that matter, how a customer data platform like NVECTA turns scattered signals into one clear account view, and what to look for in a platform before you commit budget to one.
Understanding Product Analytics for B2B Teams
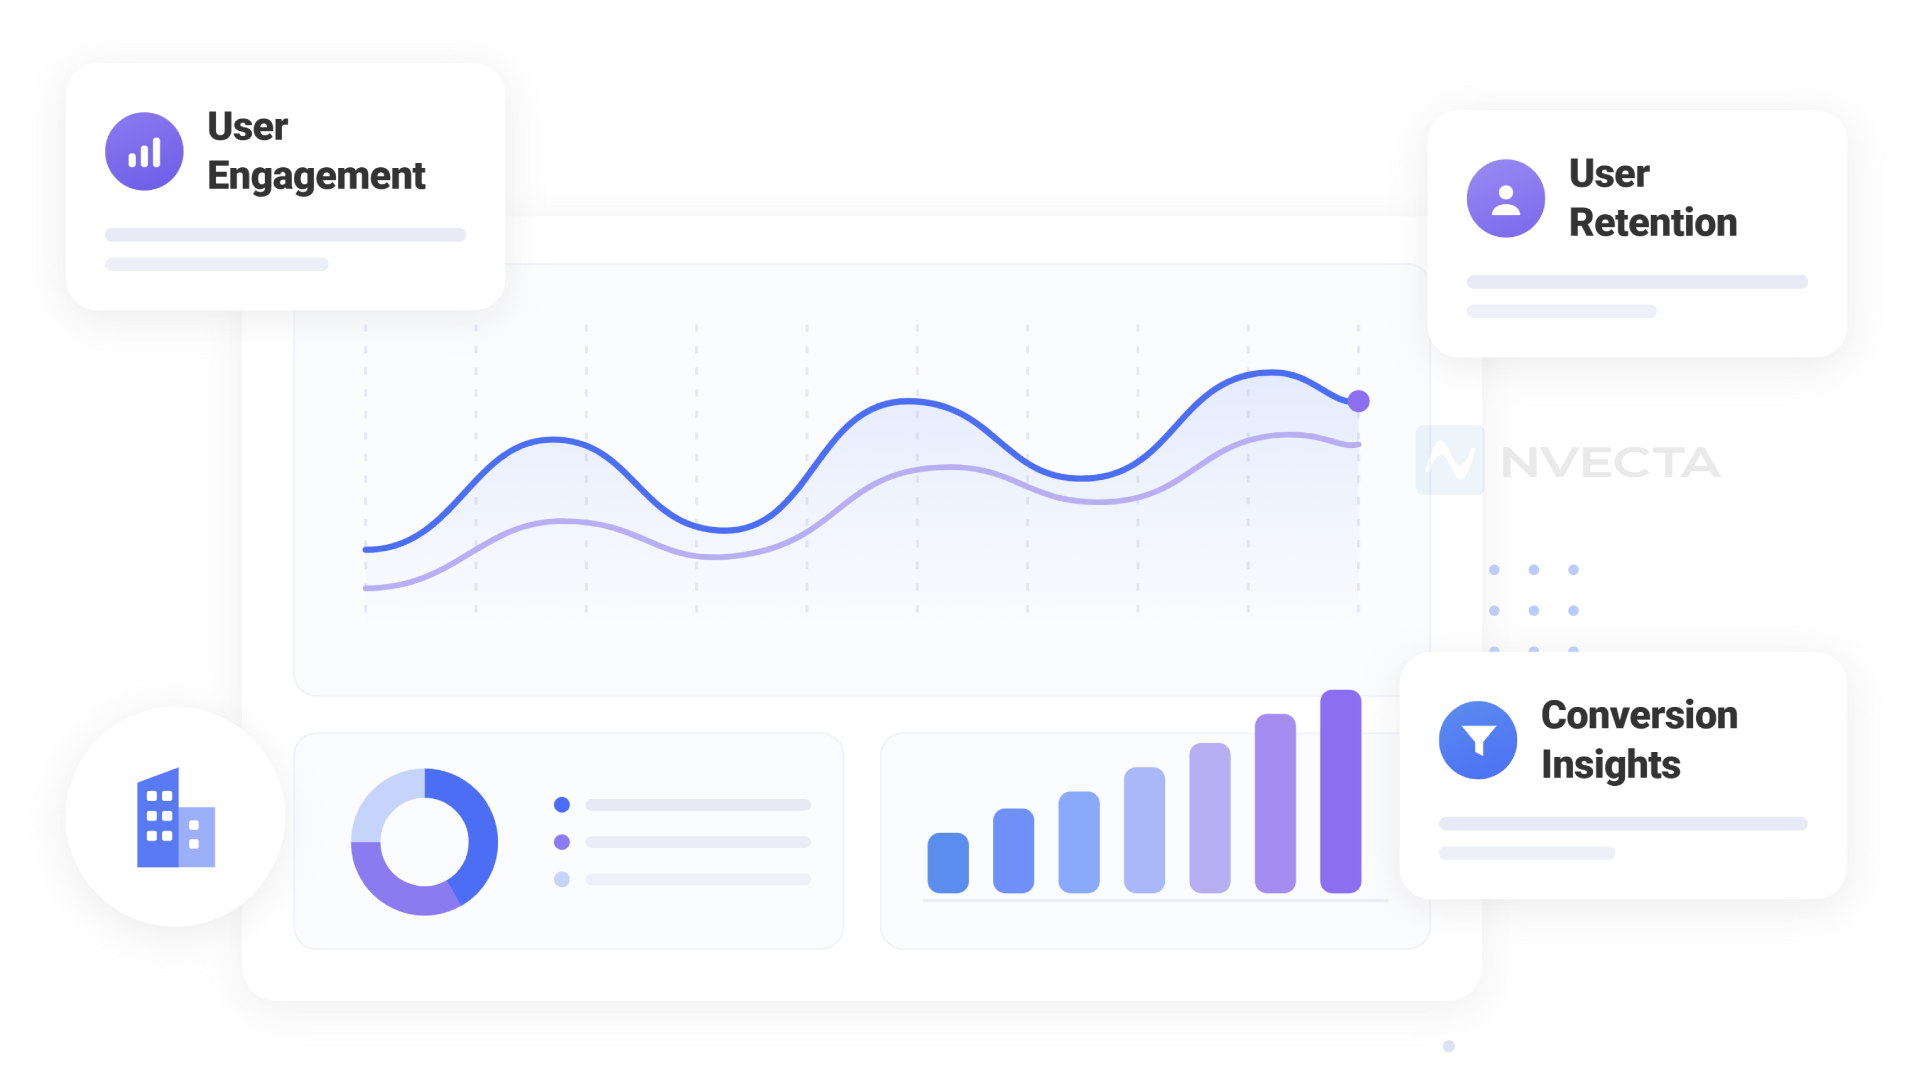
Product analytics tracks how users interact with your product, which features they use, which workflows they finish, how often they log in, and where they actually get stuck. For B2B teams, this data only means something at the account level.
Picture a single company account with ten different users. A finance lead checks reports twice a week. An ops manager runs the same workflow every morning. Five other seats barely open the app at all. None of these ten patterns alone tells you if the account is actually healthy. Roll all ten into one account view, and a real picture appears, one that shows whether the whole team gets value, not just one person.
B2B vs B2C Product Analytics
B2C and B2B product analytics rest on different assumptions about who the user is, how the sale happens, and what counts as success. Three concepts capture most of that difference.
Unit of Analysis
B2C analytics tracks a single user, since the same person signs up, pays, and logs in. B2B analytics tracks the whole account, because ten different seats can use the product in ten different ways.
Buying Process
A B2C purchase involves one decision maker who buys and uses the product alone. A B2B purchase runs through a buying committee, where the person who signs the contract rarely touches the product day to day.
Success Definition
B2C success means one person forms a habit and keeps opening the app. B2B success means an entire account adopts the product across every seat, since one engaged user rarely justifies the contract on its own.
| Dimension | B2C Product Analytics | B2B Product Analytics |
|---|---|---|
| Unit of analysis | Individual user | Full account across multiple seats |
| Buying process | Single decision maker | Multi-stakeholder buying committee |
| Time to adopt | Minutes to days | Weeks to months |
| Success metric | DAU over MAU ratio | Account engagement score |
| Churn signal | User stops opening the app | Multiple seats disengage, or the champion goes quiet |
| Revenue model | Per-user subscription | ARR and NRR are tied to one account |
| Data sources | Product usage and user interviews | Product usage, CRM, and customer success input |
Why B2B Teams Need Product Analytics
B2B teams need product analytics to grow the accounts they now have. Acquiring new customers is always costlier than retaining the existing ones. When usage data links to the full account picture, it gives a deeper view of each profile. It turns live user behaviour into a real input for growth, the same input that powers most product-led growth strategies today. These four outcomes show up again and again once teams start tracking usage at the account level.
Increase Product Adoption
You need to know which features/products drive value. You need to know which are unused and ignored. Account data shows if a new customer is on track. It shows this weeks before a scheduled check-in call.
Improve Customer Retention
Retaining customers gets simpler when you spot problems early. Usage data is continuously tracked across every account, and a minor drop in usage pattern is flagged early. When teams get notified of a reduction in engagement, they can trigger retention strategies.
Reduce Customer Churn
Churn rarely happens overnight. It starts small, with fewer logins. It starts with seats that sit unused. When such signals are evaluated in the context of a full account view, you can see churn predictions and spot risks before the opportunity to engage is gone.
Drive Expansion Revenue
Usage data linked to revenue data shows where growth opportunity is waiting. An account near its usage cap is one sign. A team using top-tier features is another. These patterns only show up when product data and revenue data live in one place, depicting accurate performance.
Key Product Analytics Metrics to Track
Product analytics for B2B only works if you track the right metrics. This reveals which users are performing well, which are at risk, and who are ready to grow. Here are four that matter most for B2B accounts.
Account Engagement Score
This is one score built from login frequency, feature adoption, and how deep each user goes into the product. One metric shows how actively an account uses your product at the moment.
Feature Adoption Rate
This tracks what share of accounts use a given feature. Low use often points to a weak onboarding flow. Teams can find the exact point of friction and optimise feature onboarding.
Time to Value
This measures how long a new account takes to reach its first real outcome. A shorter time to value means a higher chance the user sticks around.
Churn Risk Signals
This metric shows clear patterns of decrease in engagement- fewer logins, unused features, loss of interest in the product. Each one points out risk on its own.
Product Analytics Techniques for B2B Teams
B2B teams lean on a few core methods to study usage data. Funnel data reveals where accounts drop off. Cohort data reveals patterns over time. Together, these methods answer different questions about how users behave, and most B2B teams need at least a few of them running side by side.
Funnel Analysis
This tracks how accounts move through key steps. It runs from signup to first use to growth. It shows exactly where accounts drop off along the stages of analysis.
Cohort Analysis
This groups accounts for one shared trait. Signup month works well. Plan tier works too. You then compare how each group acts over time.
Path Analysis
This maps the real steps accounts take inside your product. It shows the common routes that really perform well and lead to better numbers. It also shows where users get stuck or lost.
Retention Analysis
This measures how long accounts stay active after they first sign up. Teams often segment the view by account size or by industry.
Customer Segmentation
This segments accounts by usage pattern, company type, and industry. Teams then optimise onboarding and support that match the needs of each group.
How a Customer Data Platform Powers Product Analytics
A customer data platform creates a stronger foundation for product analytics for B2B. It unifies data spread across different systems, captures real-time product events, and generates insights that give a better understanding of the users. Here is what changes once product and customer data live in the same system.
Connect Product, CRM, and Marketing Data
A CDP links product usage, CRM data, and marketing activity to one account. Every event, deal update, and campaign response becomes part of the same customer record.
Build Unified Customer Profiles
A CDP groups every user from the same company into one account profile. Product activity, sales history, and support interactions stay together, giving teams a complete customer view.
Eliminate Data Silos
Different teams often store customer data in different systems. A CDP connects those records to one account, creating a single source of truth across sales, product, marketing, and support.
Activate Insights Across Every Touchpoint
Unified data turns insights into action. A drop in product usage can update the CRM, notify the customer success team, or trigger the next customer journey without manual work.
How to Choose a Product Analytics Platform
Choose a product analytics platform that is built for B2B teams. It should unify data, support account-level reporting, integrate with your existing tools, and act on insights without relying on engineering.
Native CRM and Billing Integration
Product analytics works best when CRM and billing data stay connected. Native integrations keep product usage, deal status, and subscription data in sync without manual exports or custom engineering work.
Account Level Reporting
B2B teams manage accounts, not individual users. Reports should combine activity from every user into one account view, making it easier to measure adoption, engagement, and renewal risk.
Real-Time Activation
Insights have value only when teams can act on them. Look for a platform that triggers alerts, CRM updates, or workflows as soon as product behaviour changes.
Scalability Without Engineering Support
Product and marketing teams should create segments and reports without relying on engineering. A no-code interface helps teams move faster while reducing technical workload.
How NVECTA Powers B2B Product Analytics
NVECTA is an AI-driven customer data platform. It combines customer data and product analytics on a single platform. It connects systems, extracts data, captures events, and turns them into insights so that teams can access a shared view of each business account. Advanced predictive scoring model, AI decisioning, and next-best action features support B2B product marketing on another level.
One Platform for Data and Analytics
NVECTA stores product events, CRM data, support interactions, and billing history in one account profile. Every team works from the same customer record instead of separate systems.
Real-Time Signals for Sales and Customer Success
NVECTA detects changes in product usage and sends alerts to the right team through Slack or your CRM. Teams can respond while the opportunity or risk is still active.
Predictive Scoring for Retention
NVECTA analyses historical product usage and user behaviour to identify accounts that may churn or expand. Teams can prioritise outreach based on data instead of assumptions.
AI Agents for Account Monitoring
Beyond predefined rules, NVECTA identifies unusual account behaviour that needs attention through AI agents. This lets teams spot changes before they become greater issues.
No Code Segments and Cohort Builder
Teams can build and update audience segments with filters instead of SQL or engineering requests. Segments stay current as user behaviour changes.
Unified Data across Every Channel
NVECTA does not stop at product and CRM data. It also pulls in website visits, mobile app sessions, support tickets, and billing history, so an account profile reflects every place a business user actually interacts with your business.
Automated B2B Workflows
Teams can trigger follow-up tasks, CRM updates, or customer journeys when account activity changes. This reduces manual work and shortens response time.
Built-In Privacy and Compliance
Consent settings and access controls stay connected to every profile, so teams meet privacy and compliance requirements across regions.
Conclusion
Product analytics for B2B teams plays a crucial role for businesses to track users when it comes to adoption, retention, and growth. It requires data tracking and optimisation, which can be achieved through a customer data platform.
NVECTA CDP gives businesses an all-in-one solution with its advanced system data, analytics, and AI, supporting teams to make data-driven decisions.
Turn your product data into better business decisions with NVECTA CDP.
Frequently Asked Questions
What is B2B Product Analytics?
B2B product analytics tracks how whole accounts use a product, not just single users. It helps teams see adoption, retention, and growth at the account level. This matches how B2B buying and use truly work in practice.
What are the key differences between B2B and B2C product analytics?
B2C tracking follows one person, since one person buys the tool and uses it. B2B data rolls up actions across many users in one account. Each user plays a different role in the same story.
How does a Customer Data Platform support product analytics?
A customer data platform joins product data, deal data, and marketing touches into one account file. This gives product analytics the full picture it needs to judge account health. Teams stop guessing at account health and start reading it straight from the data.
What are the metrics B2B Teams Should Track?
The numbers that matter most are account engagement score, feature adoption rate, time to value, and churn risk signals. Together, they show how well an account moves toward real, long-term growth.
Can a CDP Replace Product Analytics Tools?
A CDP and a product analytics tool solve different problems. They work best side by side, not as swaps for each other. NVECTA joins both, so customer data and product analytics live in one place. Insights turn into action right away, not weeks later. That is the main reason teams pick NVECTA over stitching two tools together.
