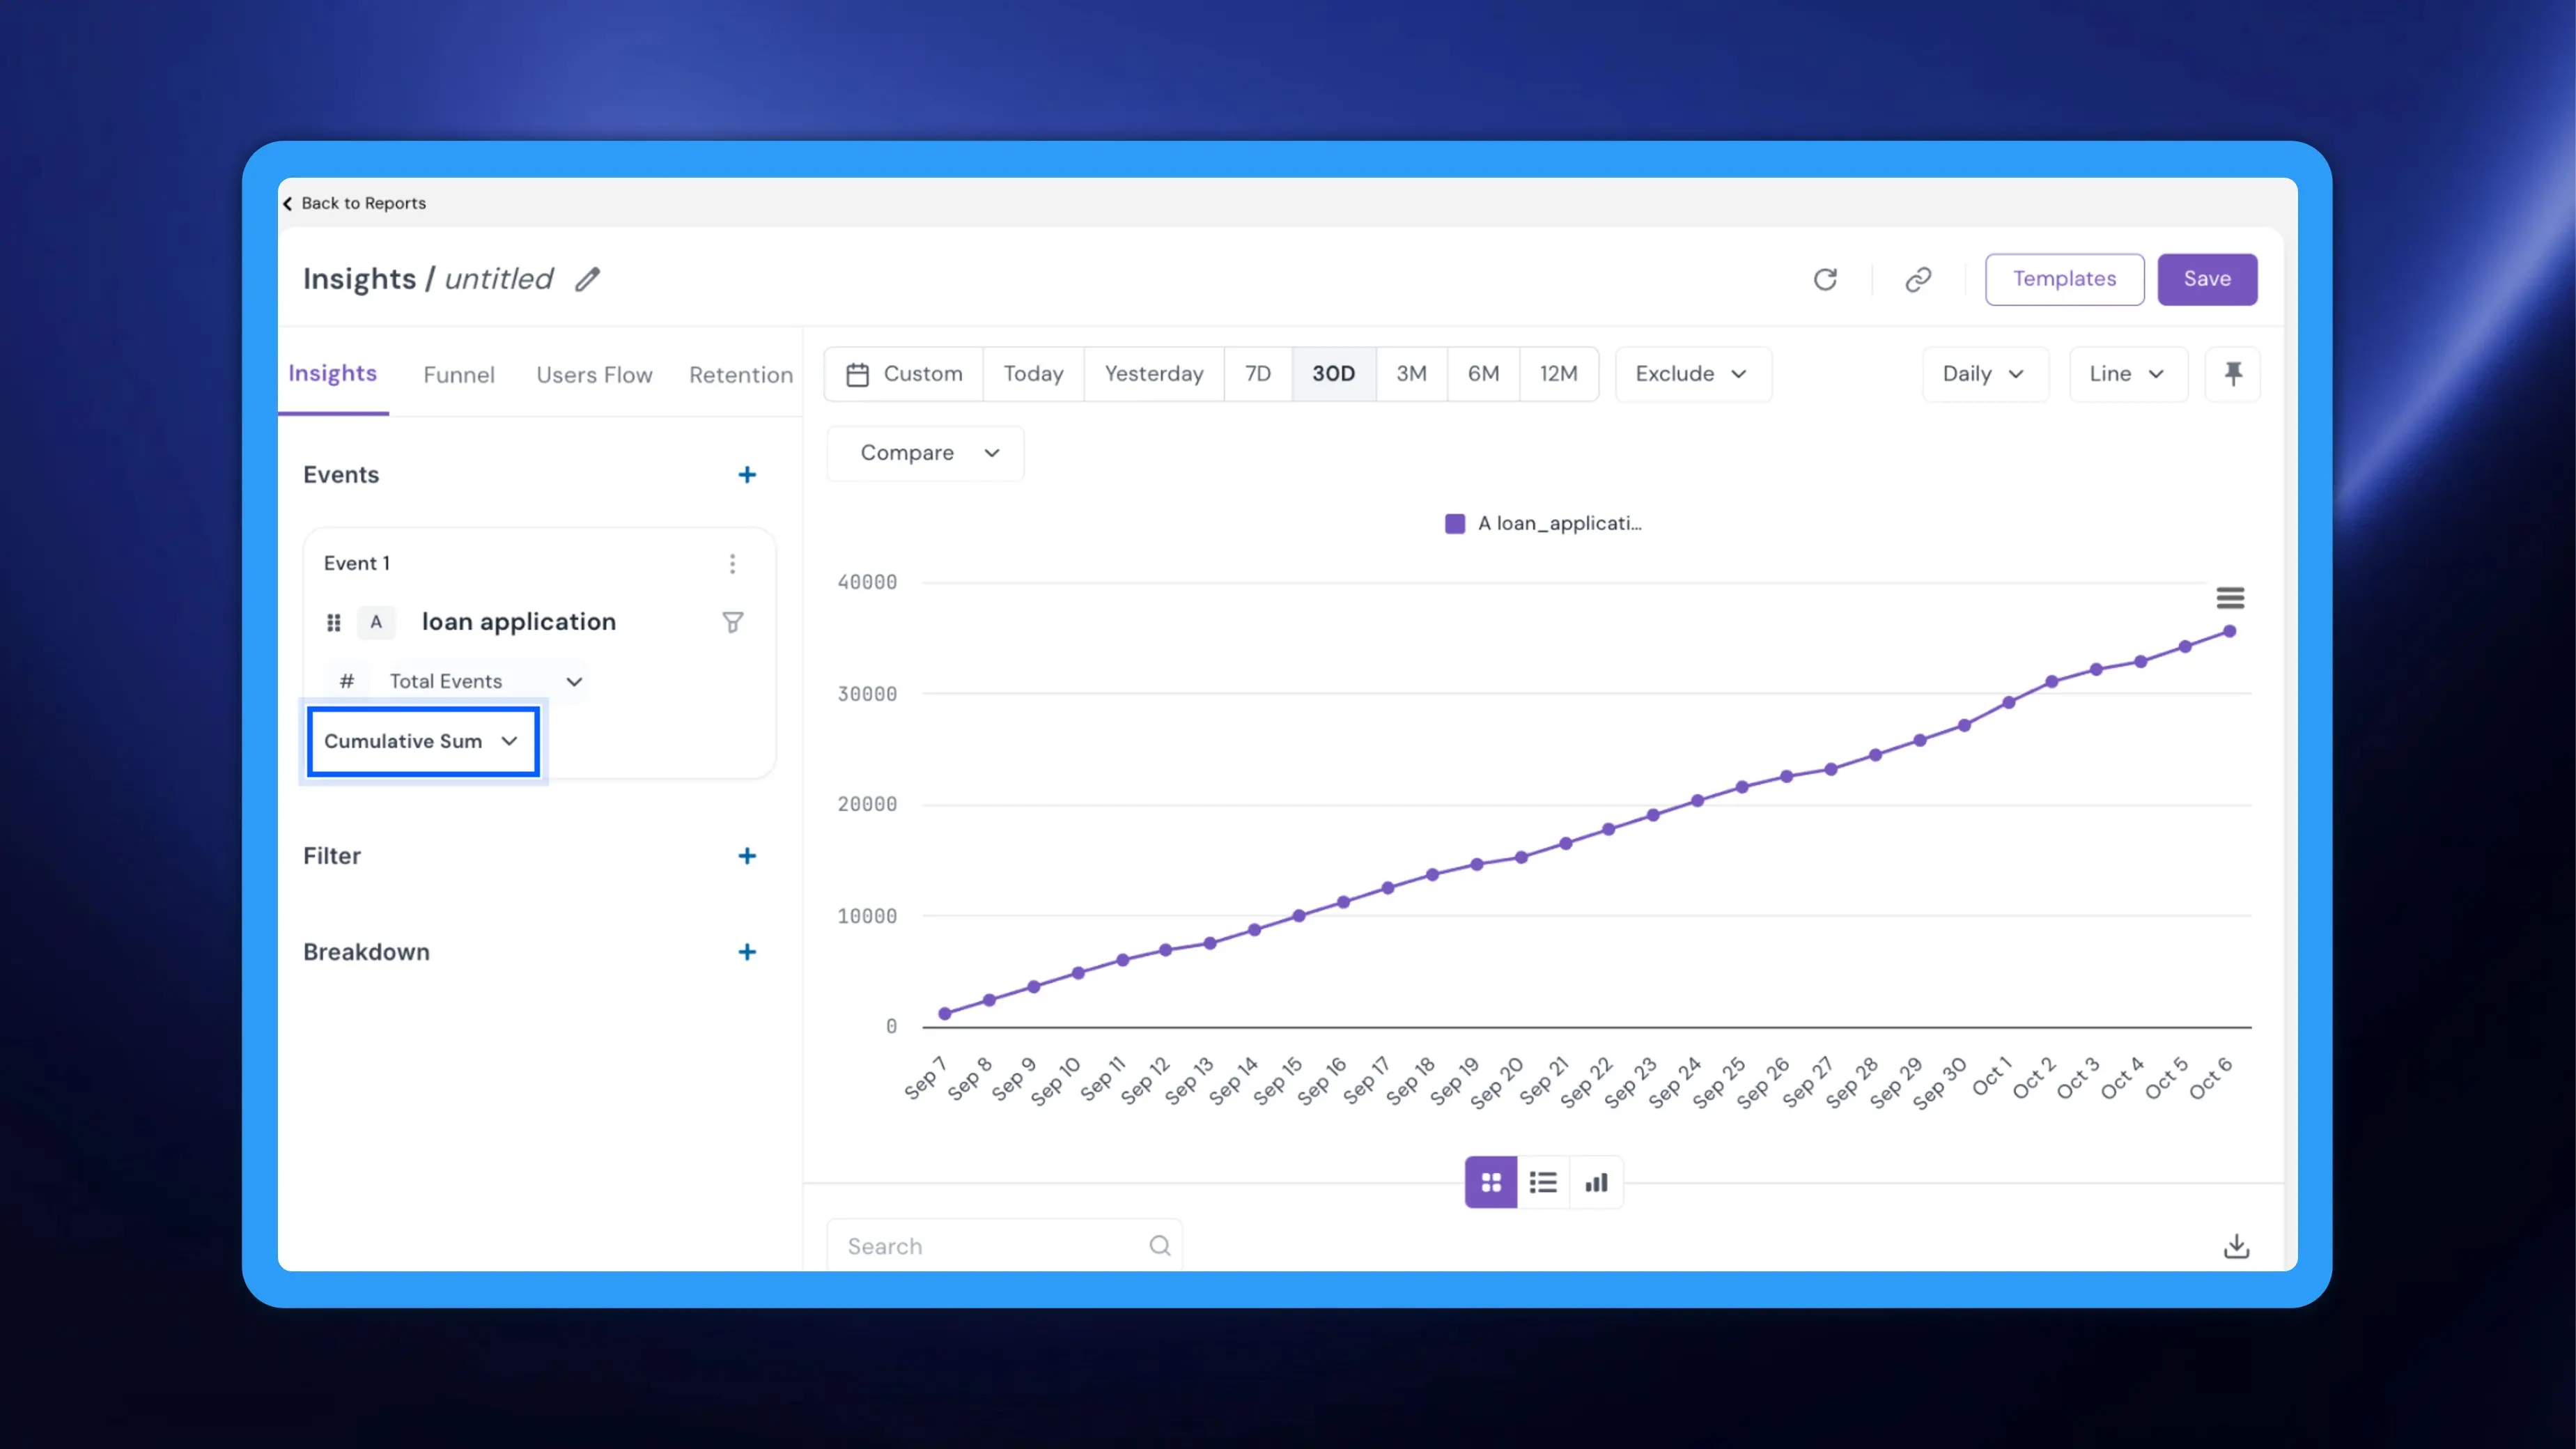
Daily event counts swing with weekends, paydays and campaign sends, so a raw trend line makes it hard to see where things are really heading. Running totals were no easier: you exported the data and added it up in a spreadsheet. NVECTA now adds Rolling Average and Cumulative Sum to Insights, so you can smooth out the noise or track progress over time directly on the chart.
Where to find it
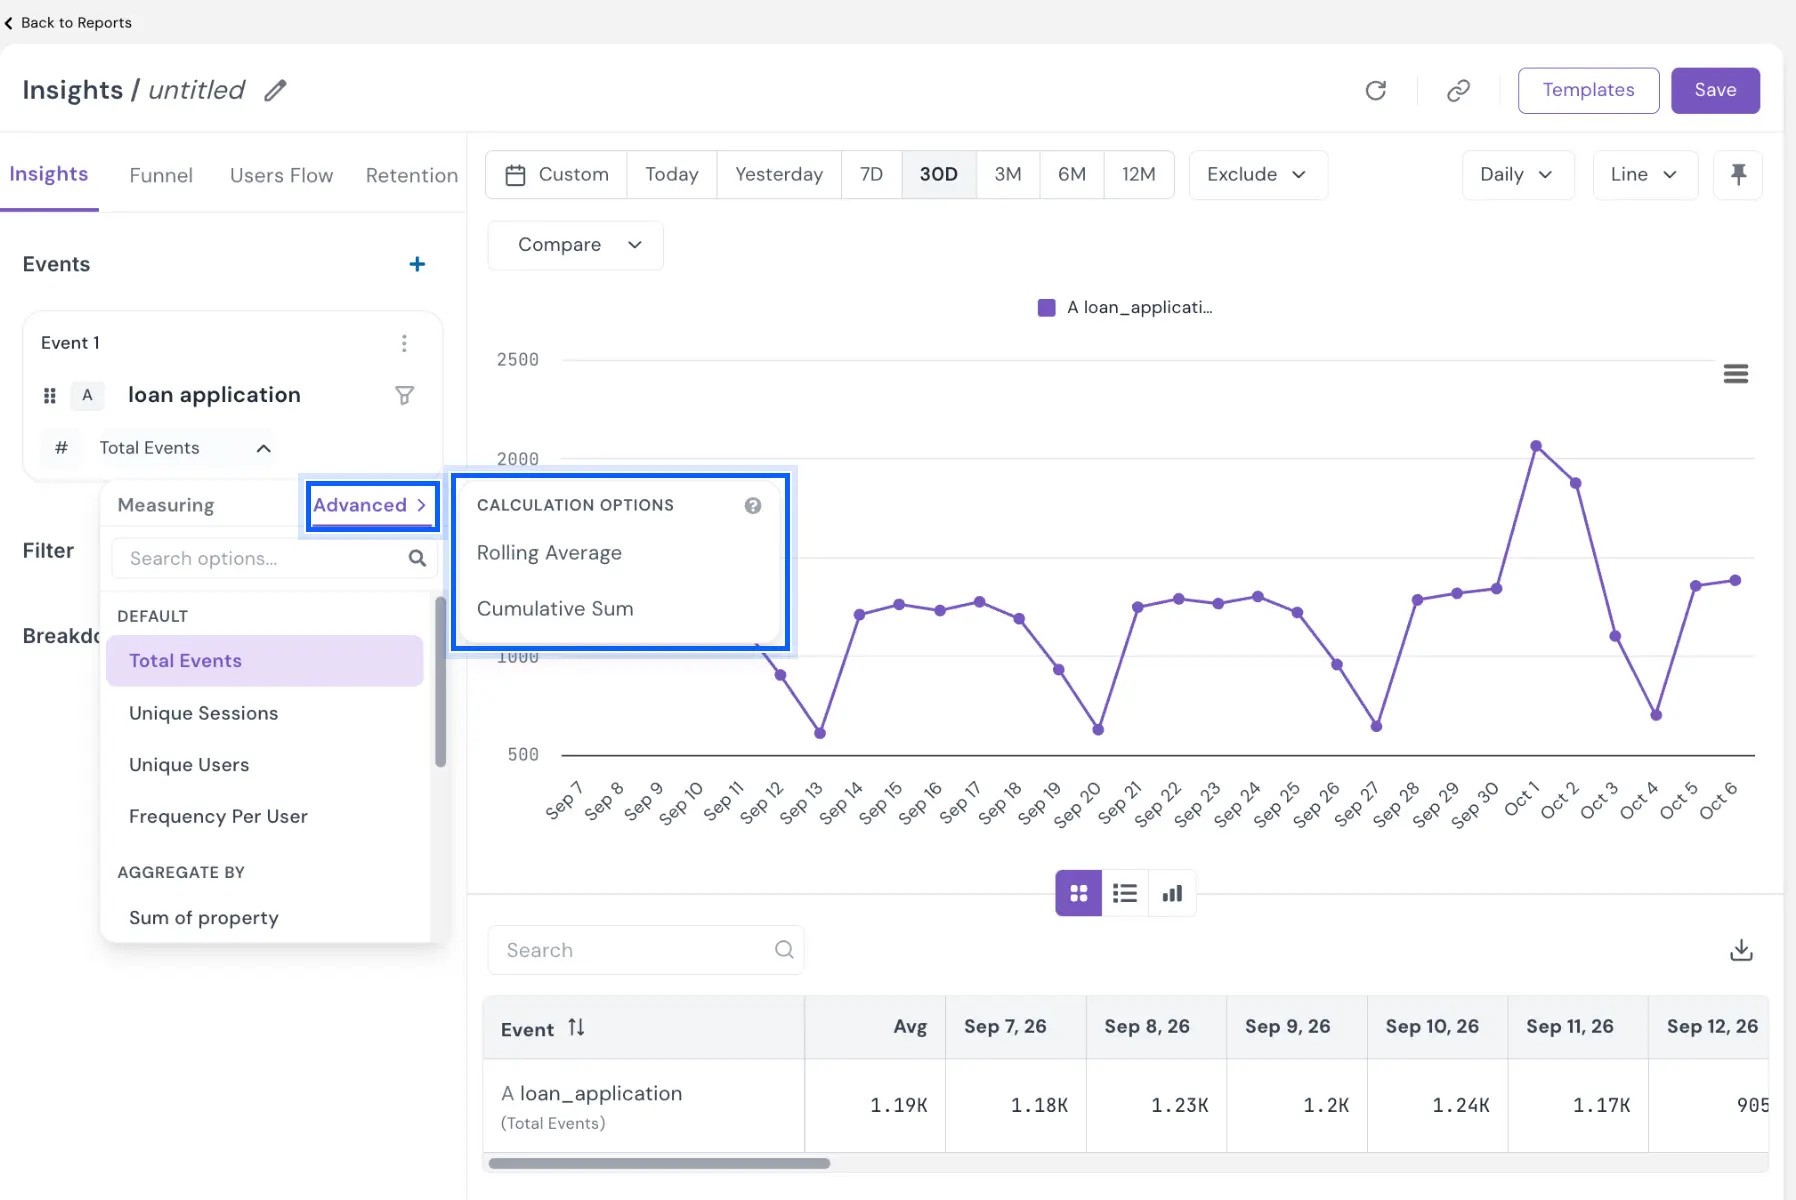
Go to Analytics → Insights and click the measure under any event, such as Total Events. The panel has two tabs. Measuring holds the existing options: Total Events, Unique Sessions, Unique Users and Frequency Per User under DEFAULT, and Sum of property under AGGREGATE BY. The new Advanced tab lists the CALCULATION OPTIONS.
How to use it
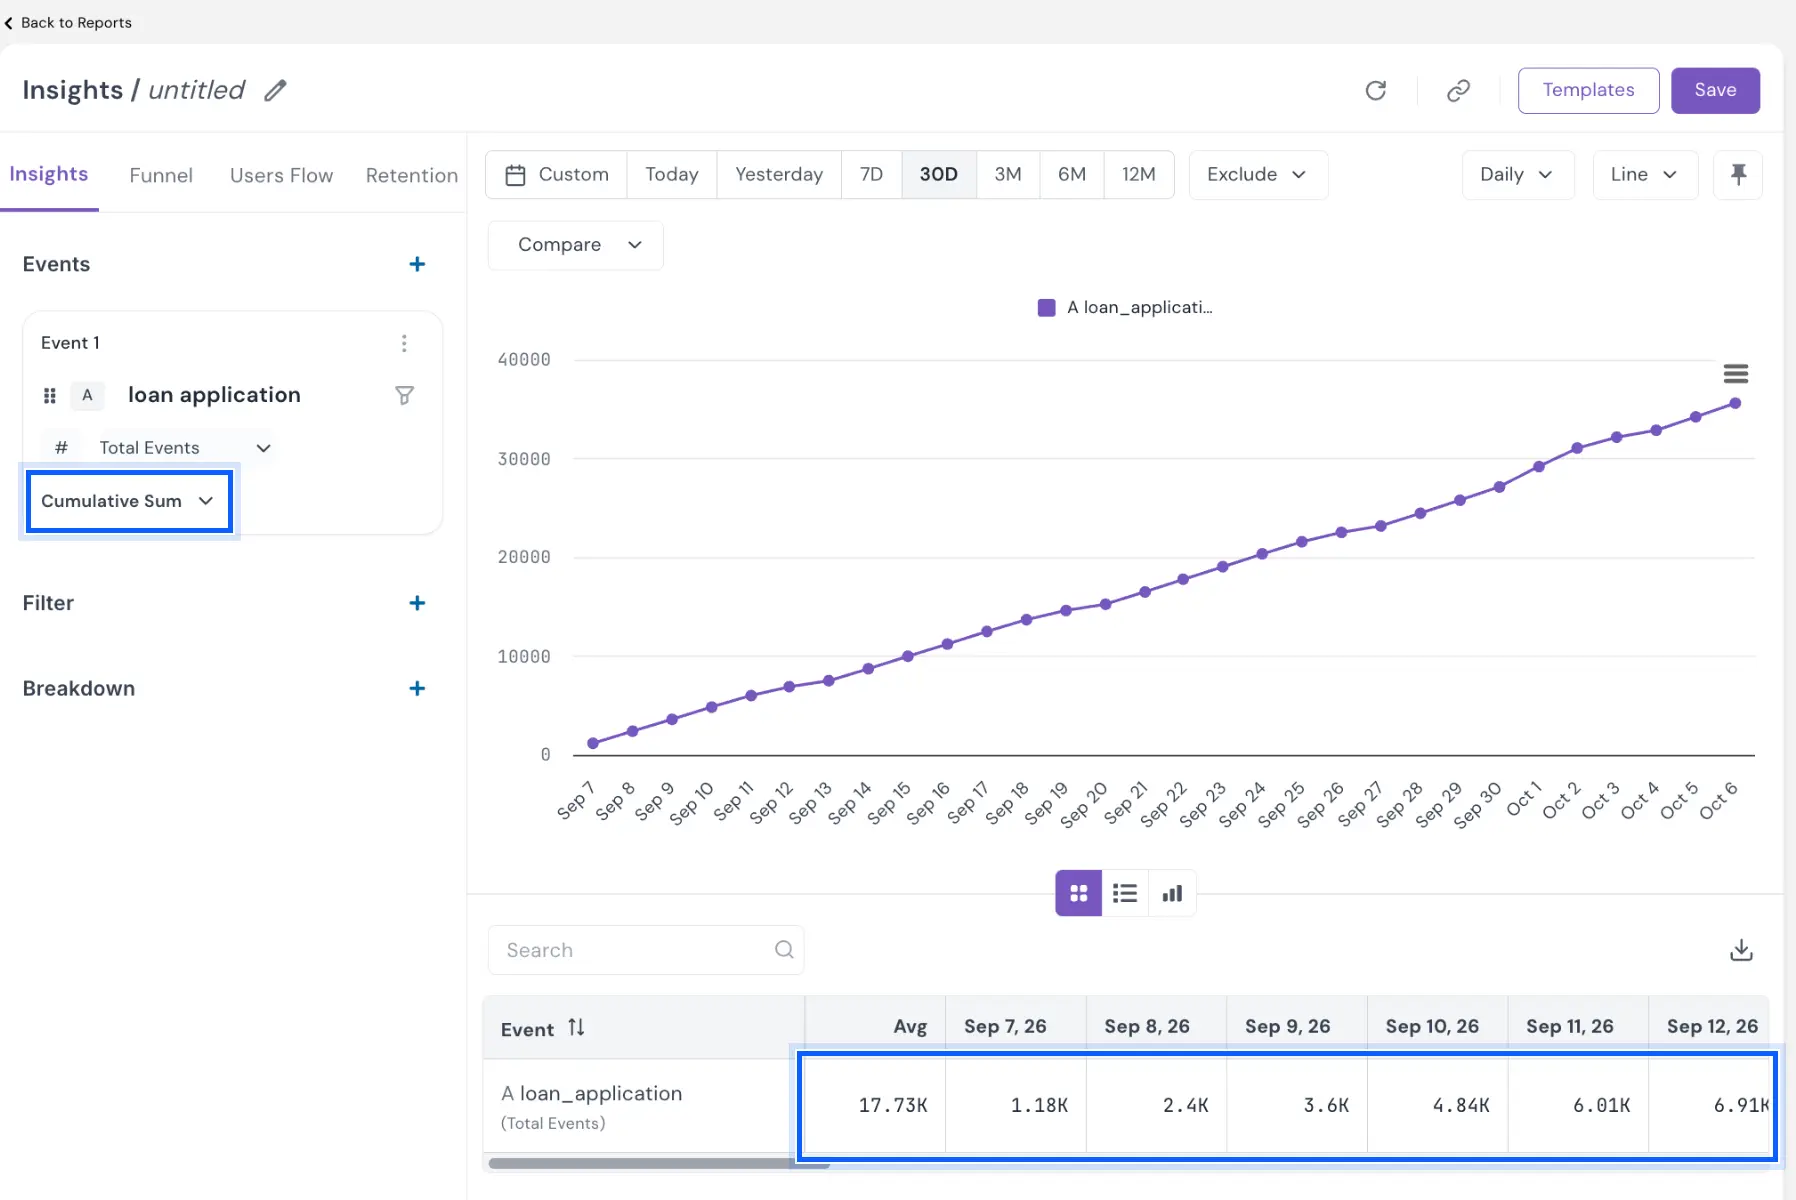
Cumulative Sum shows the running total by adding each day's value to the previous total. Pick it and the chart becomes a steadily rising line, while the table shows the running total for each date.
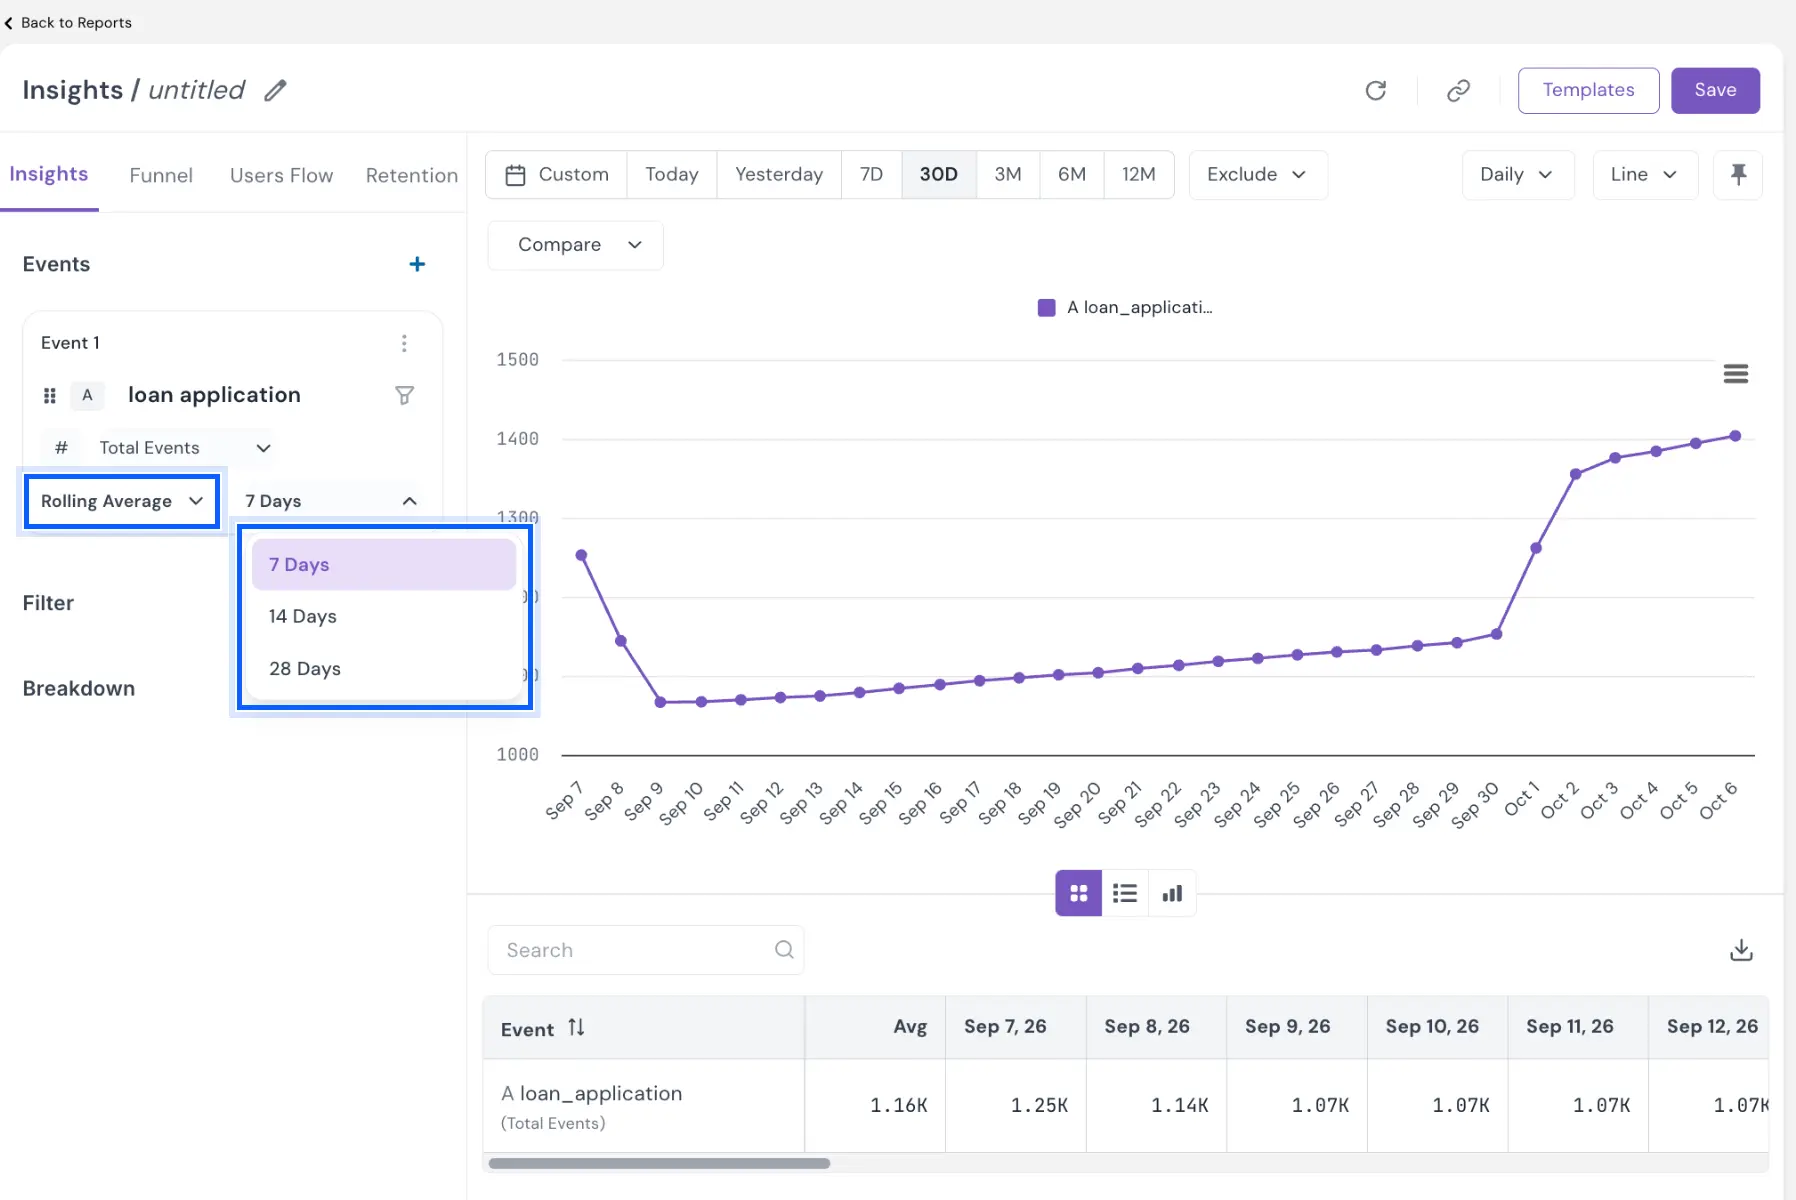
Rolling Average replaces each point with the average of the window that ends on it, which smooths out short spikes and dips. After you pick it, a window dropdown appears next to Rolling Average under the event. The options follow the chart's granularity: 7 Days, 14 Days or 28 Days in a daily view, and 1 Week to 4 Weeks in a weekly view, and so on.
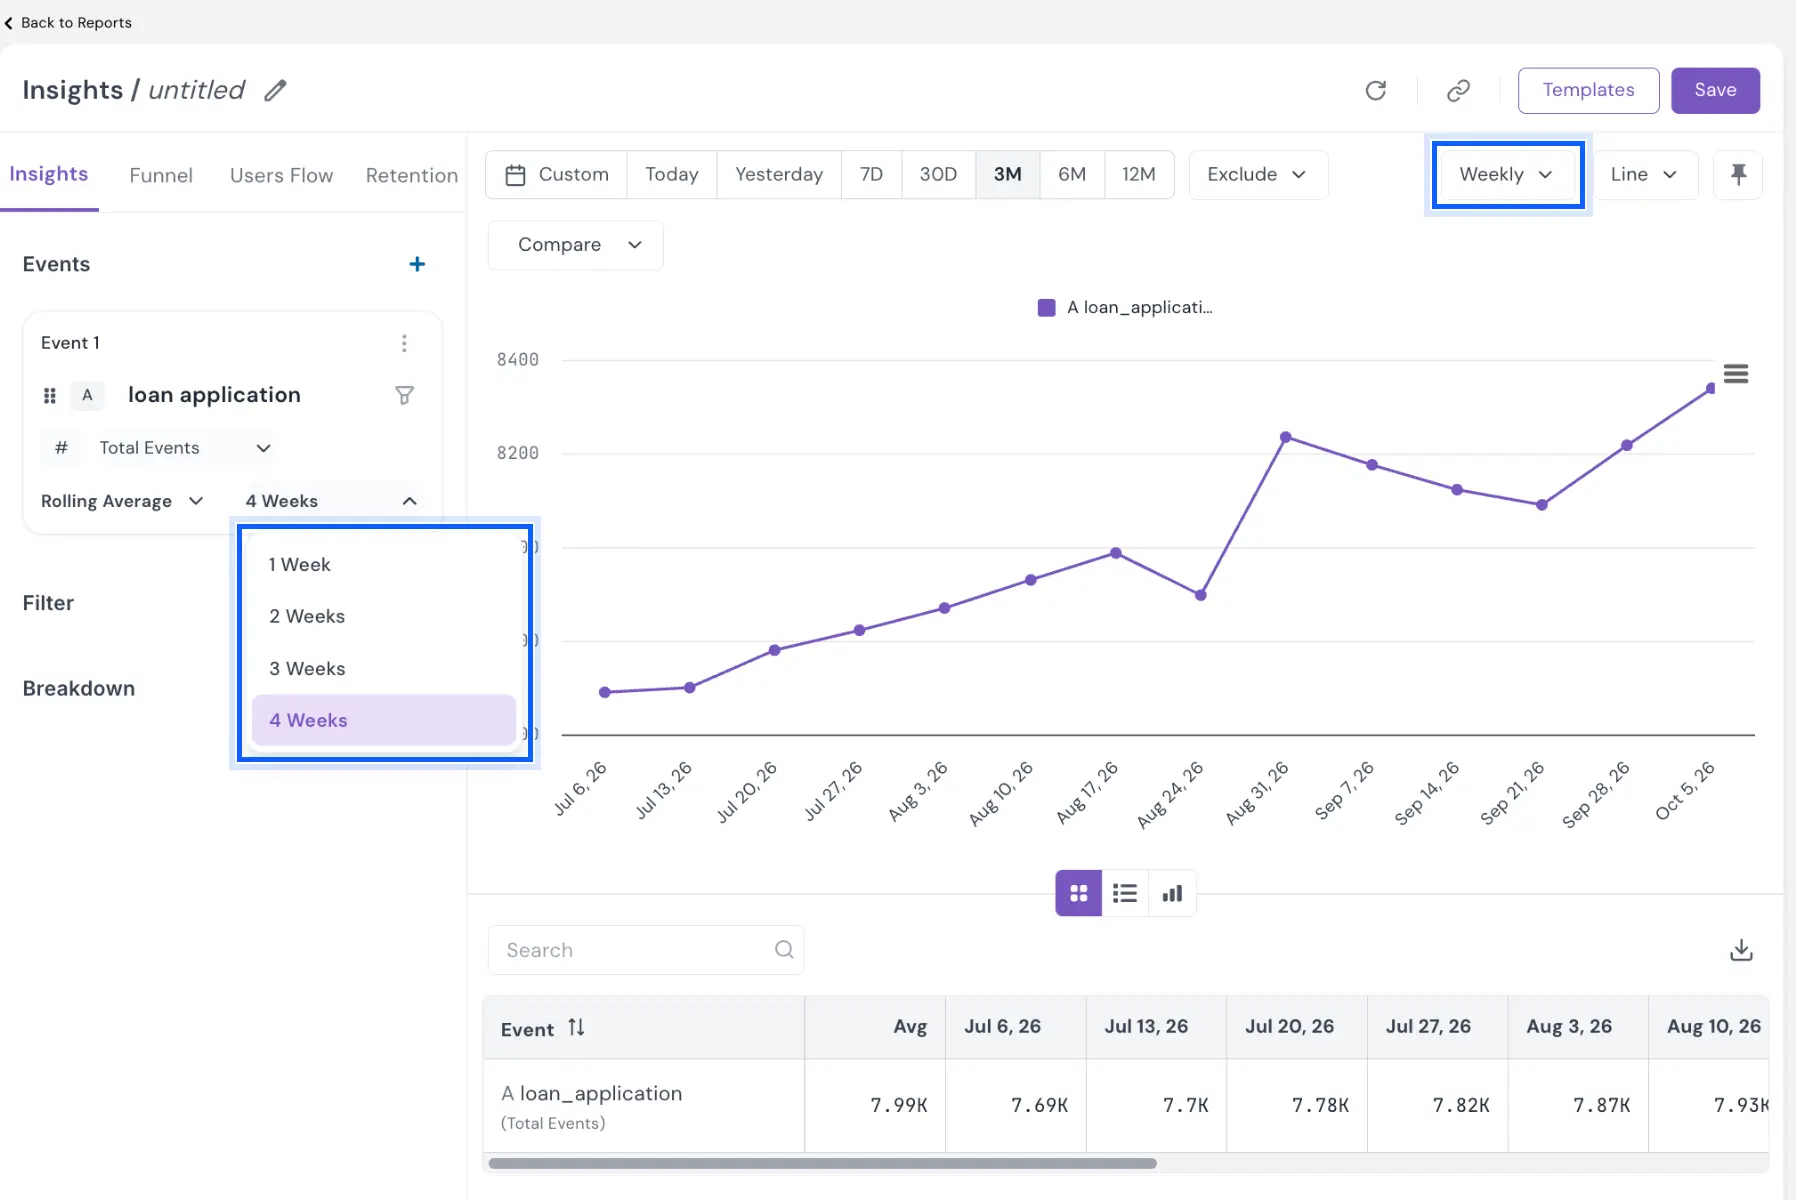
Confirm your choice with Apply in the Apply changes bar. The calculation is set per event, and switching back to a default measure returns the raw values.
Example
A digital lender tracks loan applications in its app. Daily volumes jump at the start of the month and dip on Sundays, so the raw line hides whether demand is growing. The product team sets the application event to Rolling Average with a 7 Days window, and the weekly cycle flattens into a clear trend. For the month-end review, the team switches the same event to Cumulative Sum to see how close applications are to the monthly target on any given day.
Problem it solves
Raw daily counts tell you what happened today, not where you are heading or how far you have come. Rolling averages expose the trend behind noisy data, and cumulative sums turn a series into progress toward a goal, both without leaving Insights or rebuilding the numbers in a spreadsheet.
Your Insights charts now show the trend and the running total, not just the daily noise.