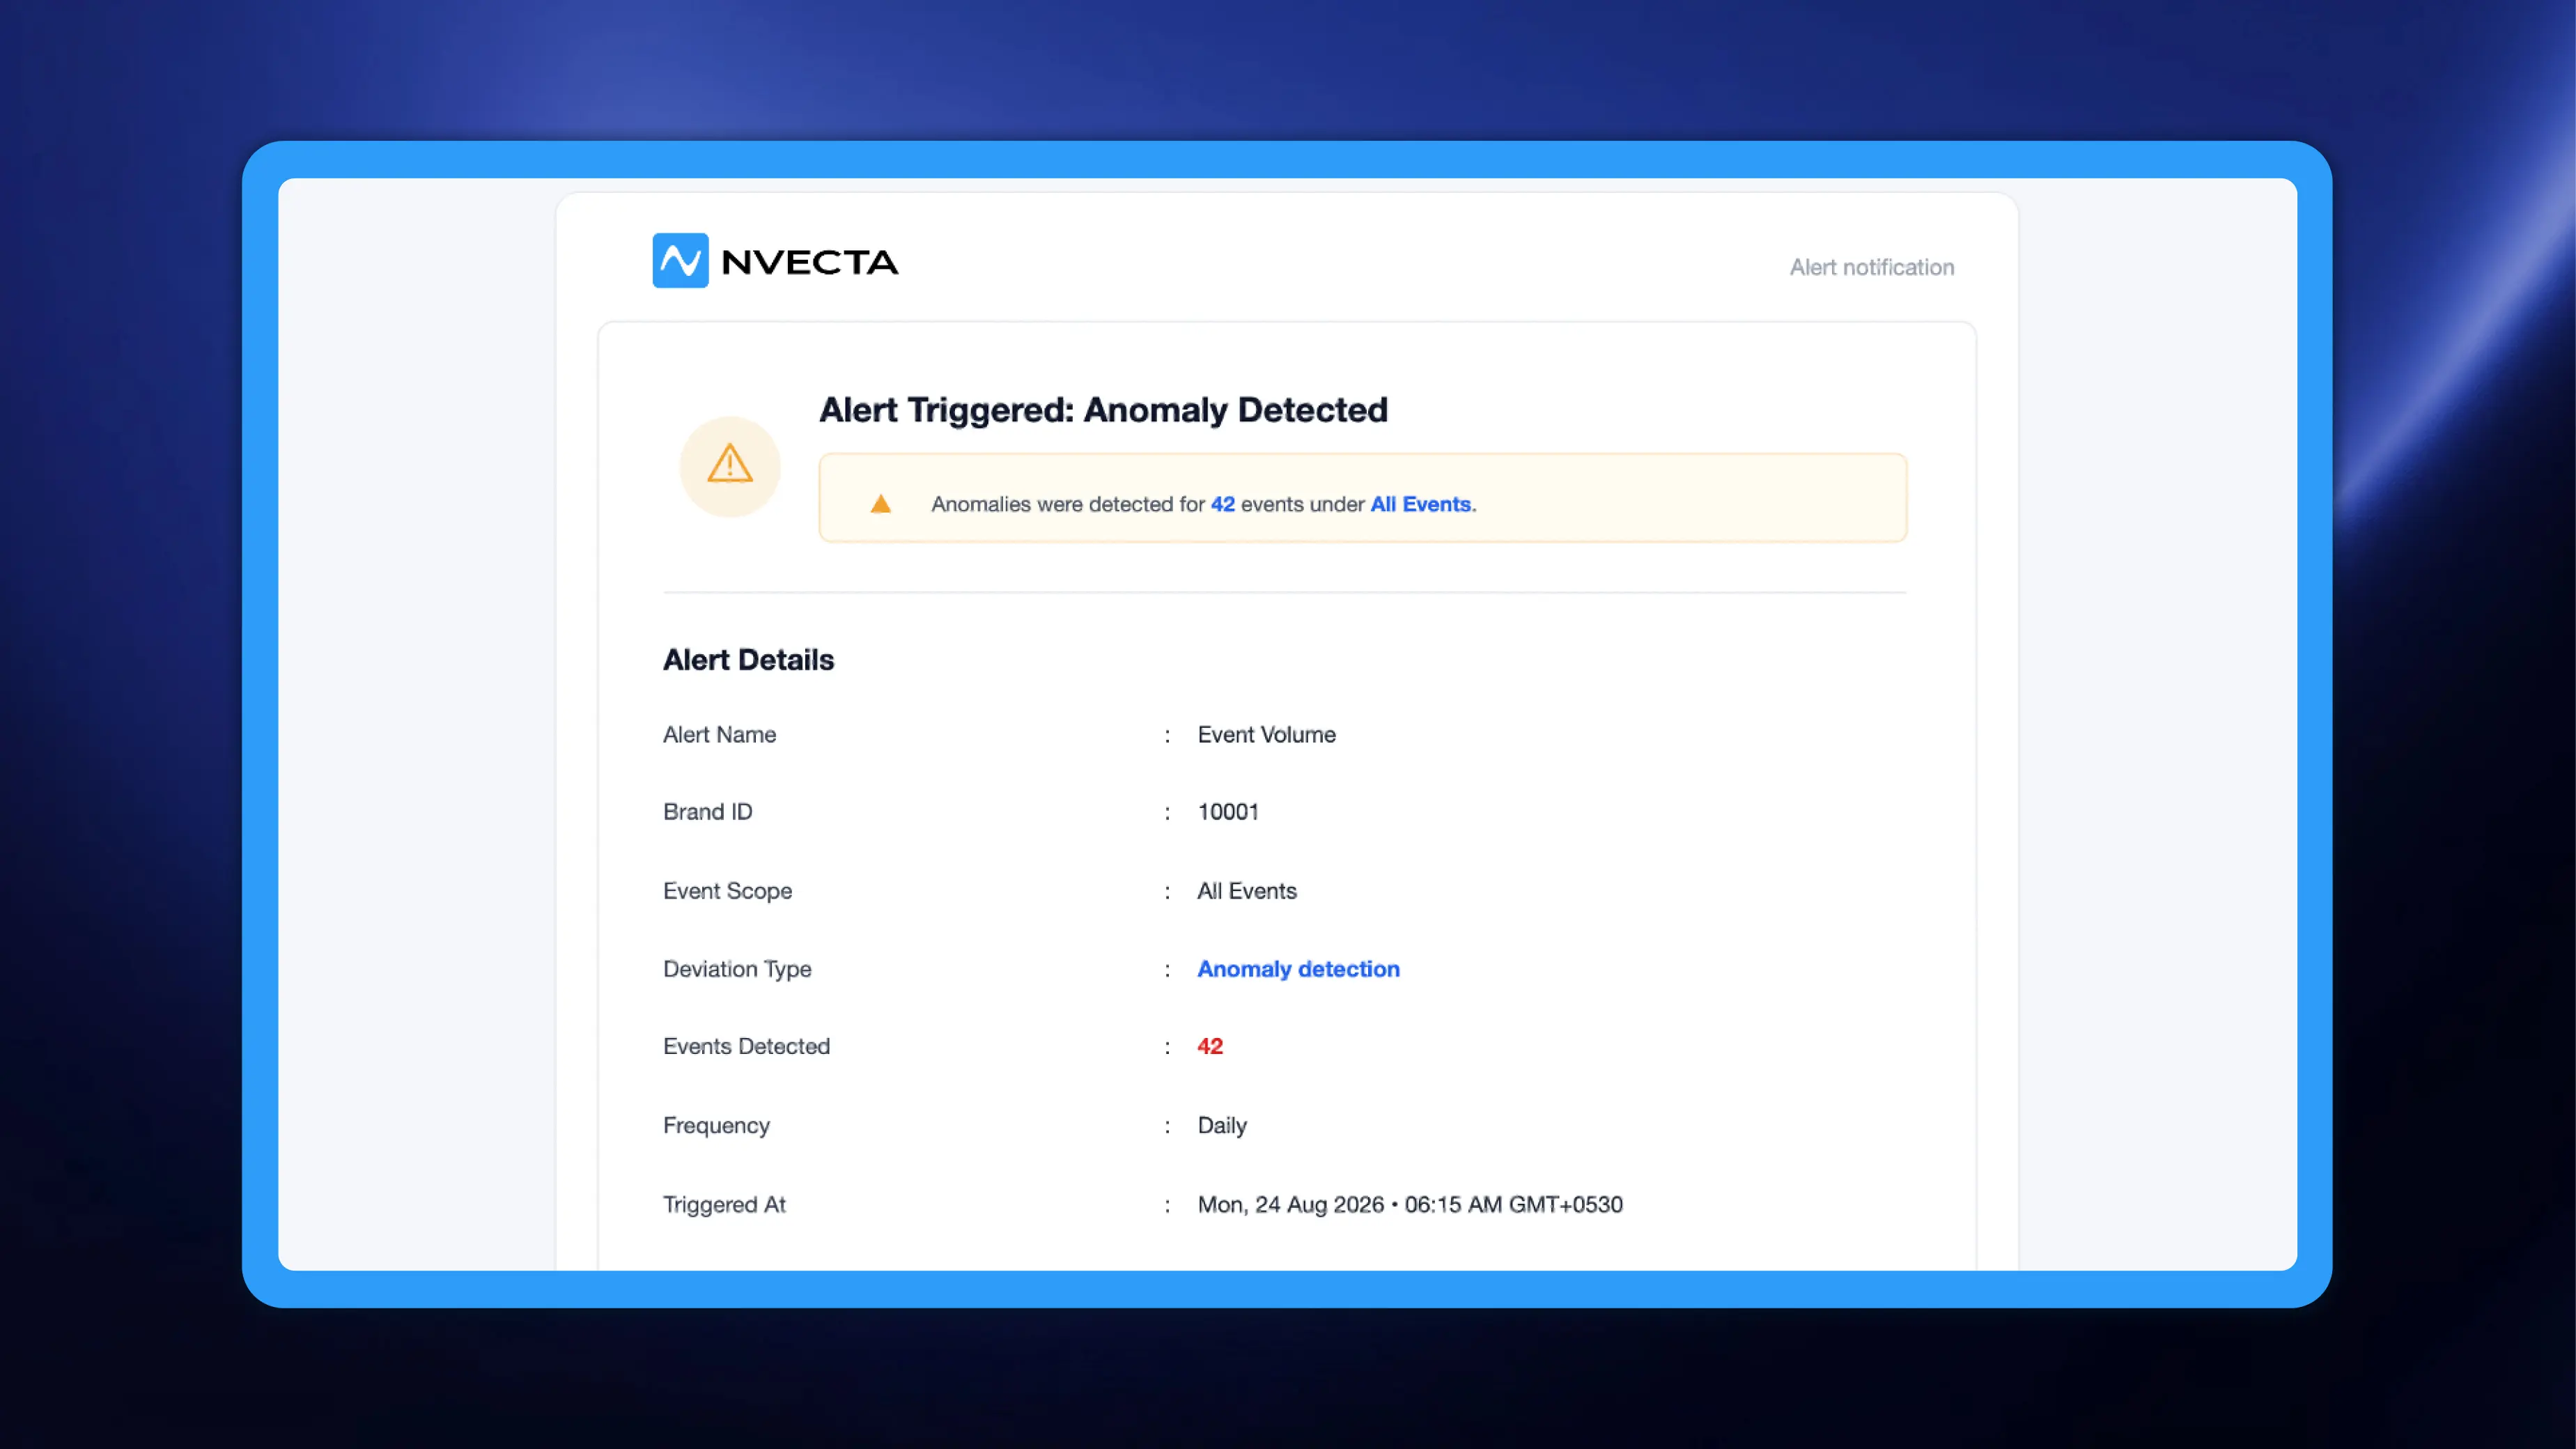
Tracking breaks quietly. A tag gets dropped in a release, an SDK stops firing, an event starts firing twice, and nothing in NVECTA looks wrong: segments still build, journeys still run, reports still render, only on data that no longer means what your team assumes it means. Watching for that used to mean one alert per event, each with a threshold you had to pick.
NVECTA now lets a single alert watch your whole event stream.
Where to find it
Go to Settings → Alerts. Every alert on the account is listed there with Alert Name, Frequency, Status, Subscribers, Last Updated and Action, and CREATE NEW ALERT sits above the table.
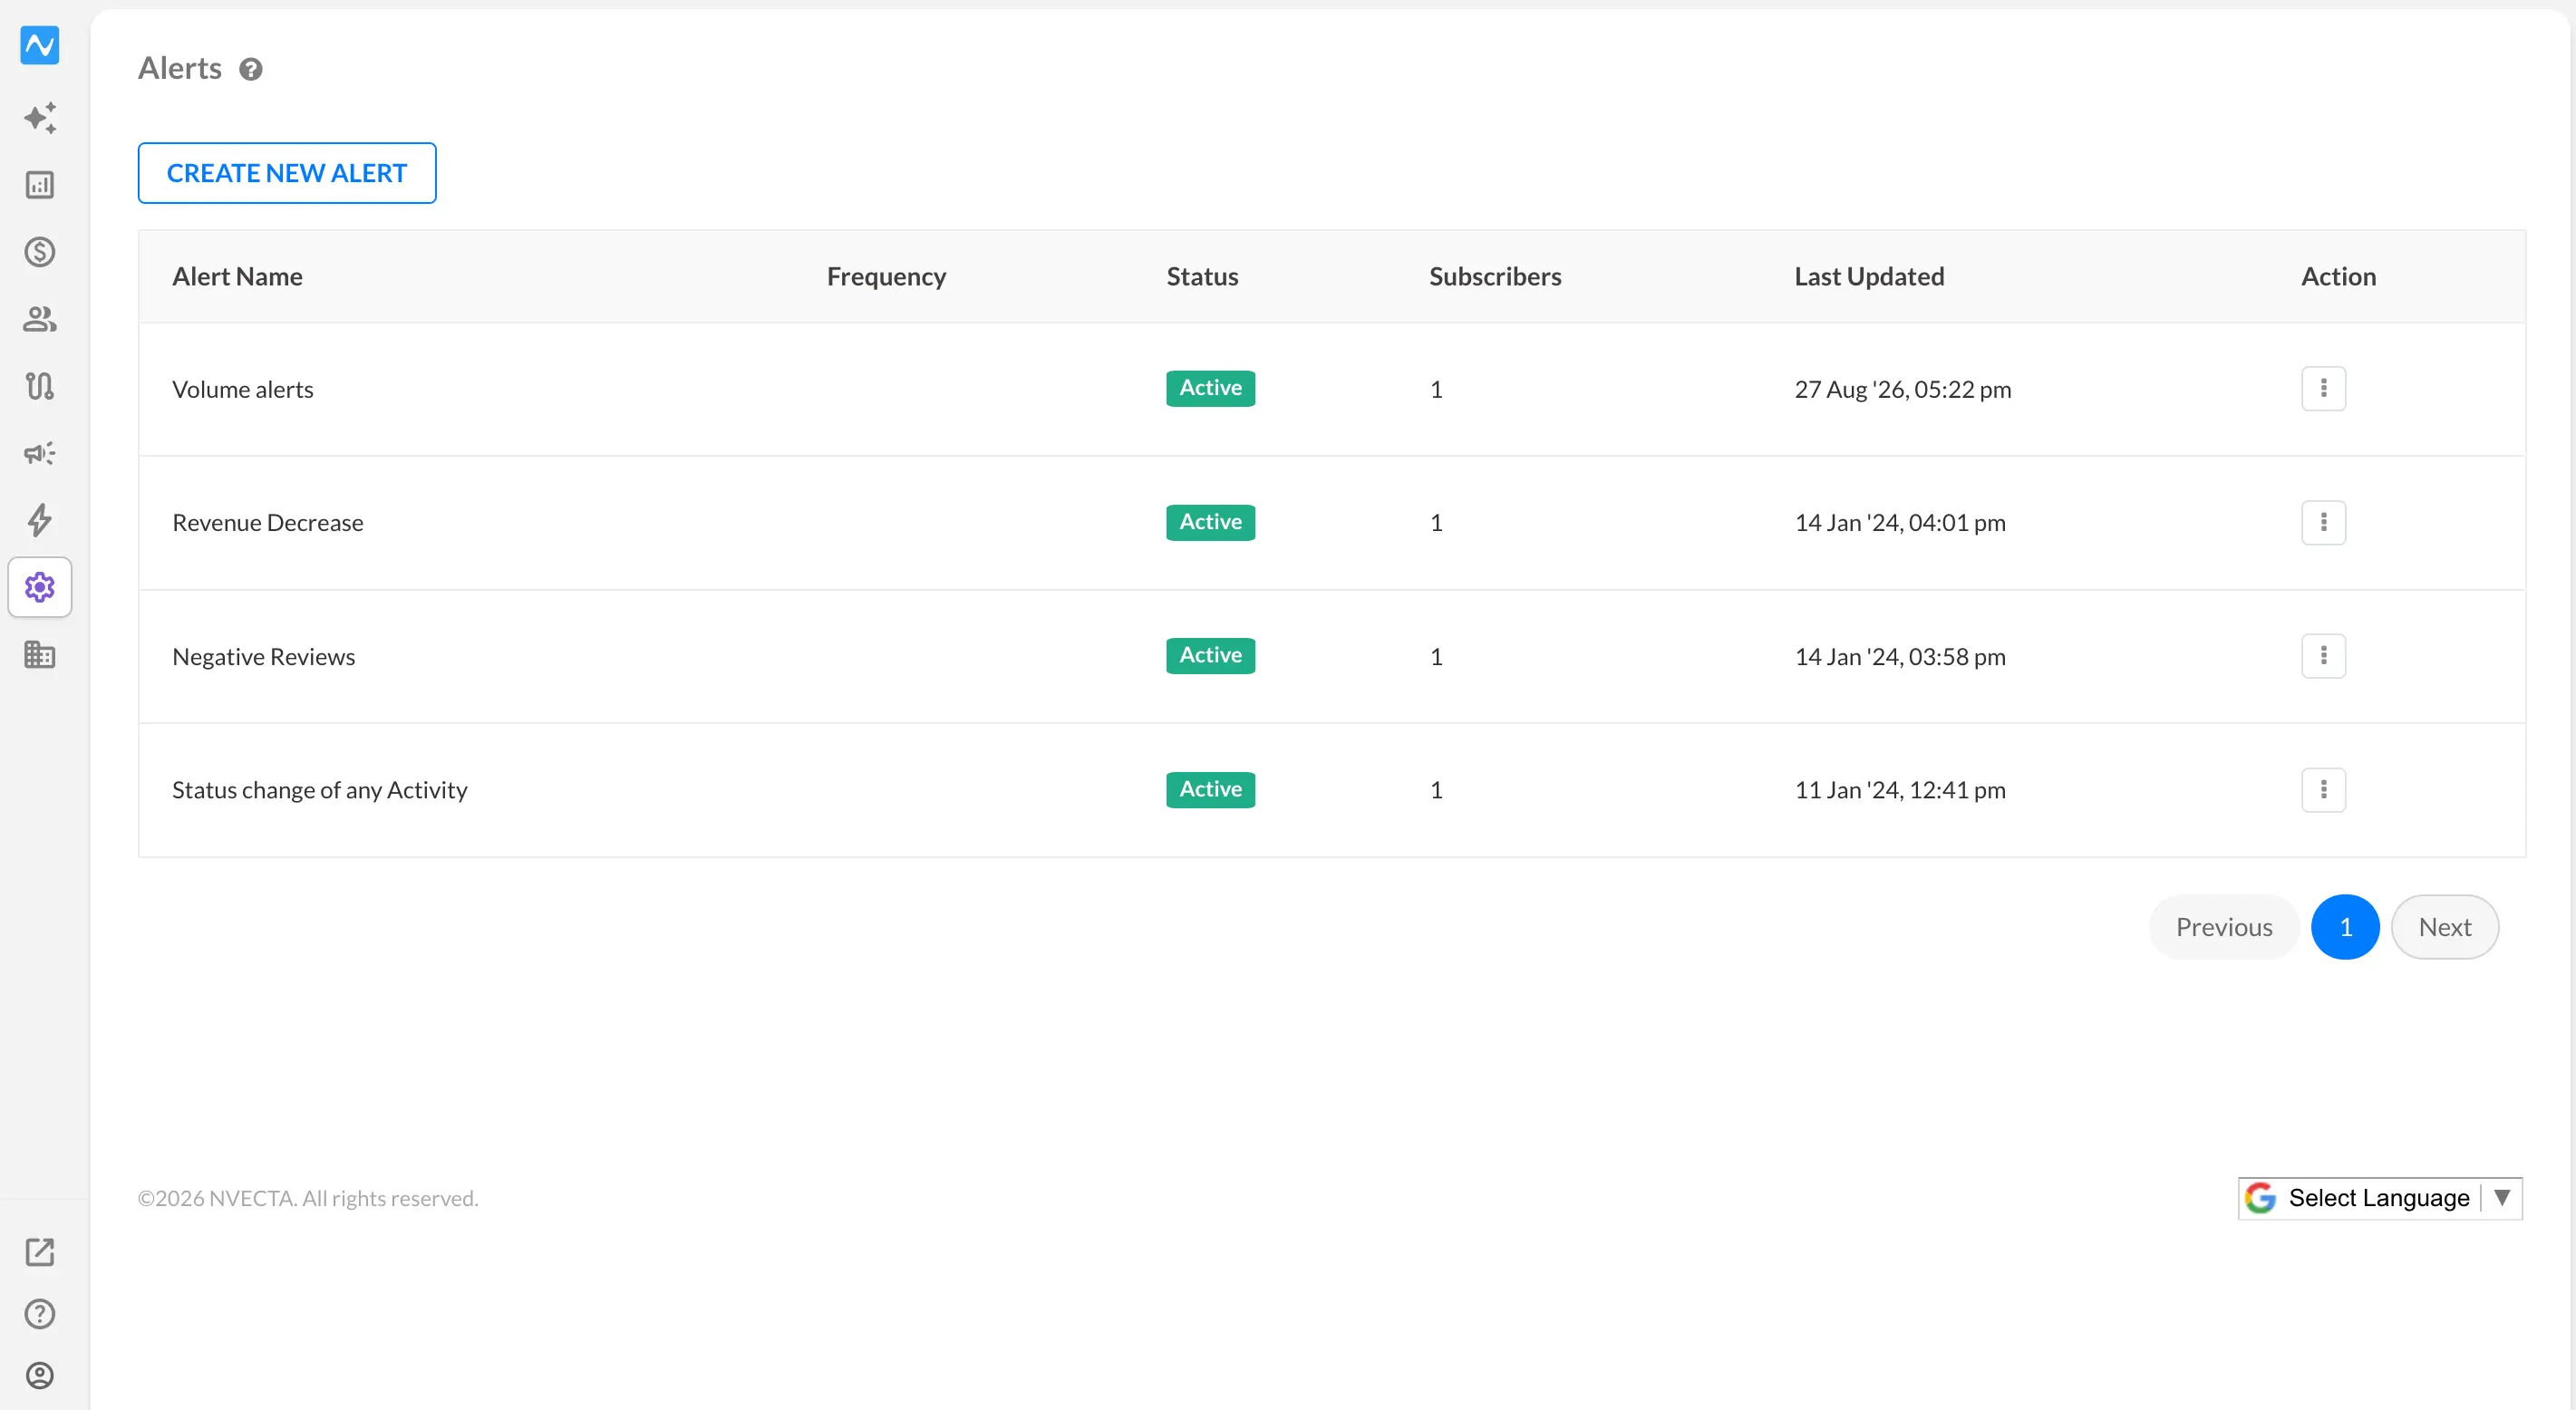
If alerts are new to you, kindly go through Monitor critical issues with automated alerts for a thorough tutorial.
How to use it
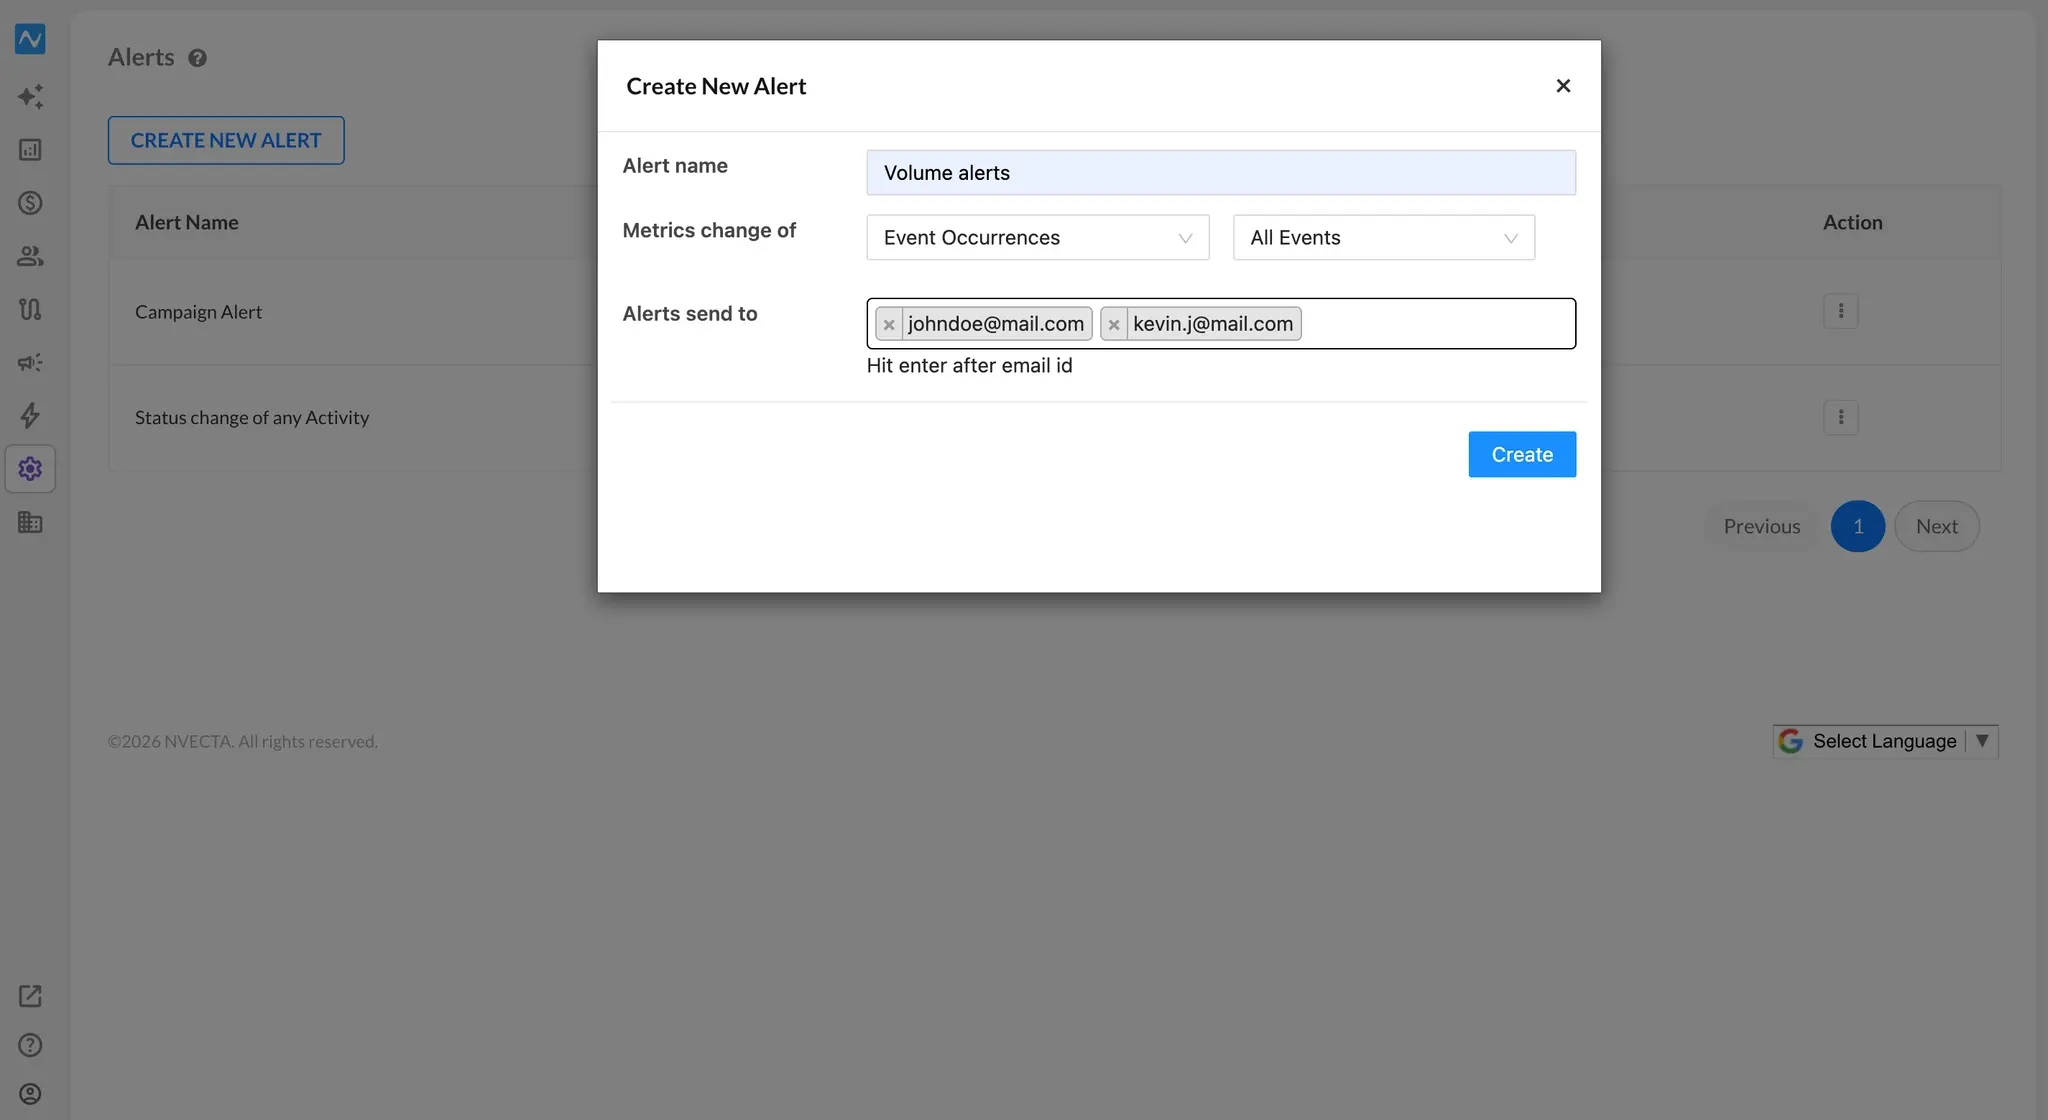
- Open Settings → Alerts and click CREATE NEW ALERT.
- Type an Alert name.
- Set Metrics change of to Event Occurrences. The second dropdown then lists All Events at the top, with your individual events grouped below it under Custom Events.
- Choose All Events. That is the whole configuration: as soon as the scope is All Events, the Frequency choice, the Send alert if value is row and the attribute filter all drop out of the dialog, because there is no threshold left for you to define.
- In Alerts send to, type an email address and press Enter, once per recipient.
- Click Create. The alert appears in the list with a Status of Active.
What the alert mail tells you
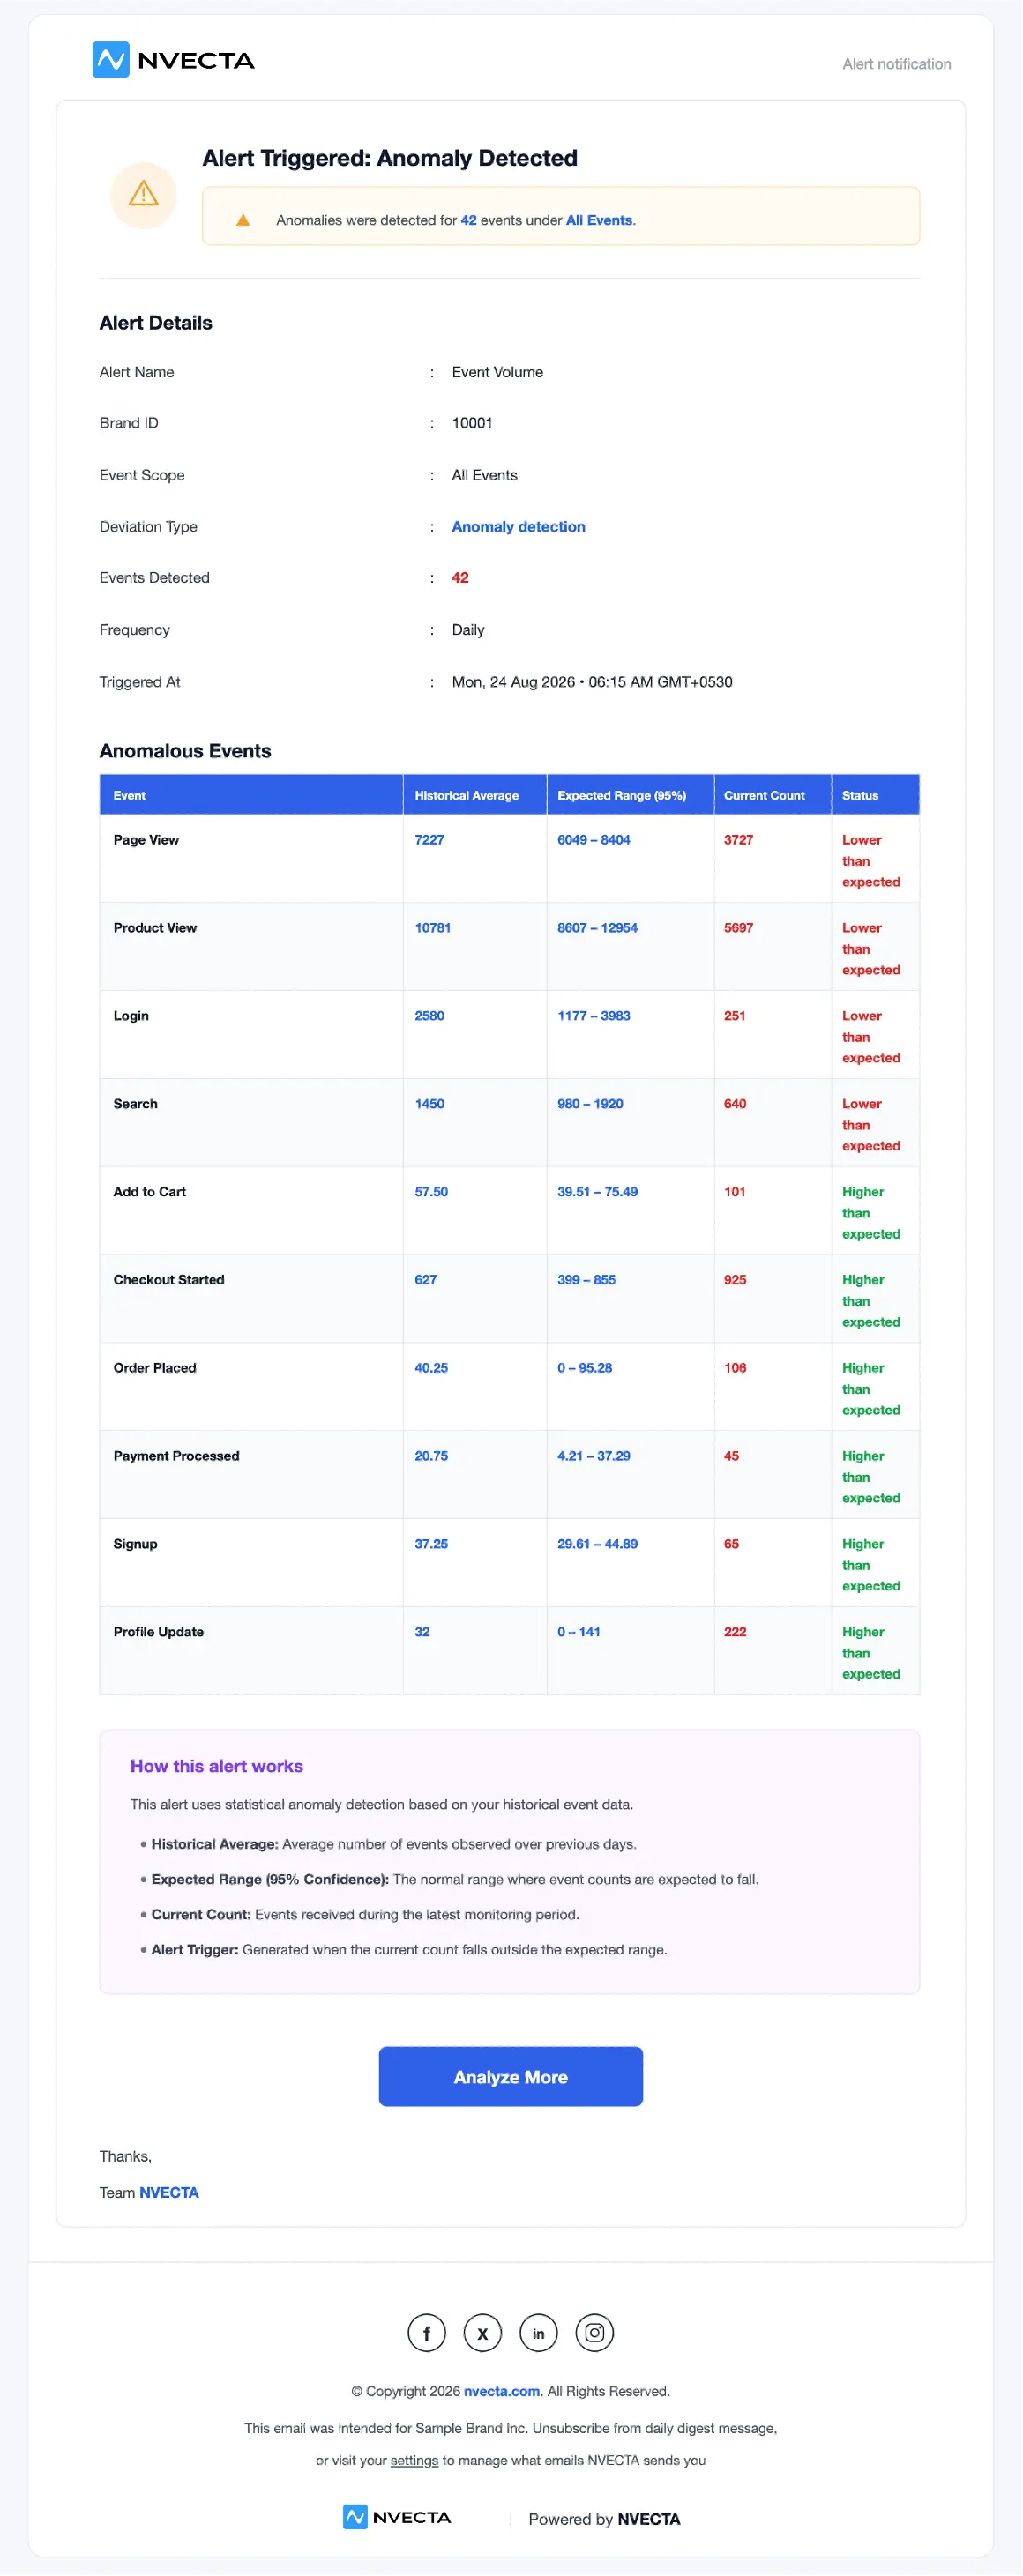
The mail arrives with the subject Alert Triggered: Anomaly Detected and a banner giving the number of events flagged and the scope they were flagged under. Alert Details shows Alert Name, Brand ID, Event Scope, Deviation Type, Events Detected, Frequency and Triggered At.
The part you act on is the Anomalous Events table. Each row names an event and gives its Historical Average, its Expected Range (95%), the Current Count that arrived in the latest monitoring period, and a Status of Higher than expected or Lower than expected. A How this alert works box below the table restates the same maths in words, and Analyze More opens the detail in the console.
Reading the table:
- Lower than expected on an event you report on usually means tracking broke: a tag removed in a release, an SDK that stopped firing, an event that got renamed. - Higher than expected usually means the event is firing more than once, or bot and test traffic is being counted. It can also mean a campaign genuinely landed, so check the release log before you celebrate. - A handful of low-volume events drifting in and out of range is normal. Judge the alert on the events your reporting actually depends on.
For how events and attributes get defined before they can be counted, see Track Events - Definitions, Attributes and Events. When an alert points at a real break, Troubleshoot event tracking covers what to check next.
The problem it solves
A data quality problem is only expensive while it is invisible. Coverage used to depend on somebody having created an alert for that specific event, and on the threshold in it still making sense months later, which meant the events nobody had thought about were exactly the ones with no cover.
One All Events alert watches everything you send, and each event is judged against its own history rather than against a number typed into a form. Nothing about your existing alerts changes: per-event alerts keep running with their own frequencies and thresholds, and you stay in control of who hears about a change and what happens next.
Ten minutes of setup, and your event stream tells you when it changes instead of your reports telling you later.