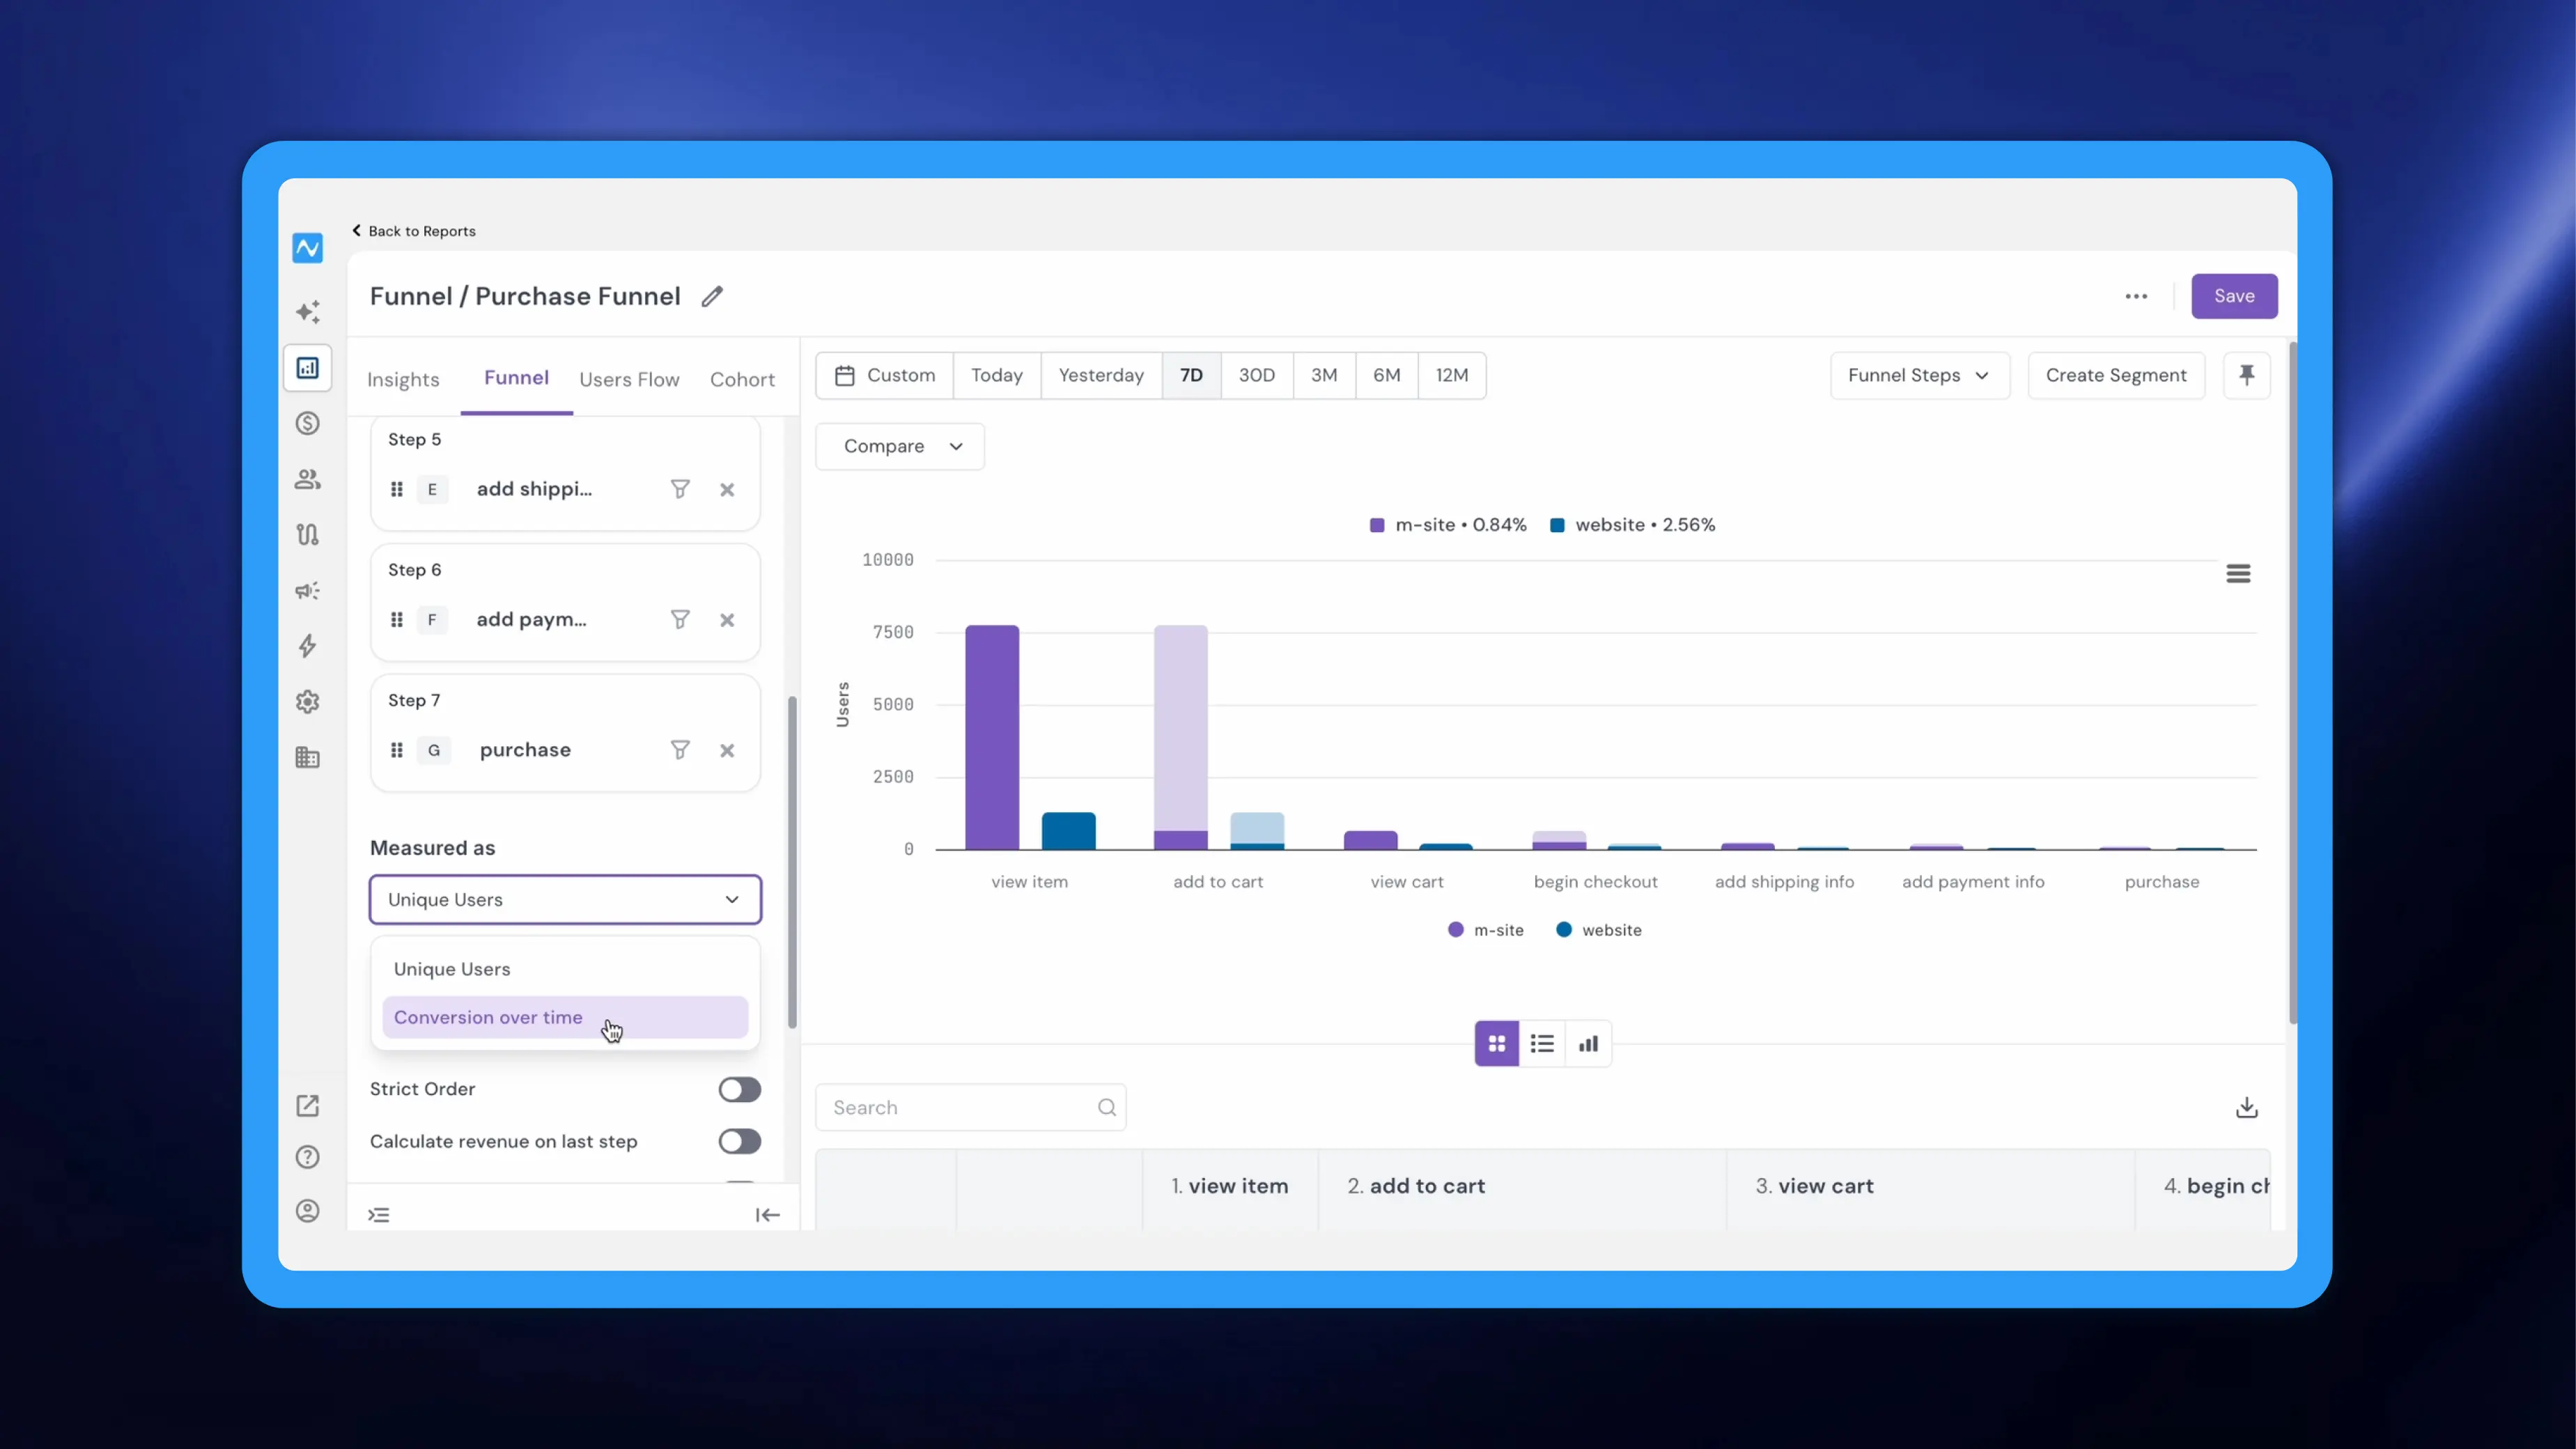
Until now, funnels reported a single conversion figure for the entire selected date range, which made it hard to see when conversion moved. NVECTA now adds Conversion over time to funnels, giving you daily conversion trends for both the overall funnel and every step-to-step transition. As a result, you can spot the exact days performance dipped or recovered, and pinpoint the step responsible, without building separate reports.
Where to find it
While creating or editing a funnel, open the Filter section on the left. Under the Measured as dropdown, select Conversion over time.
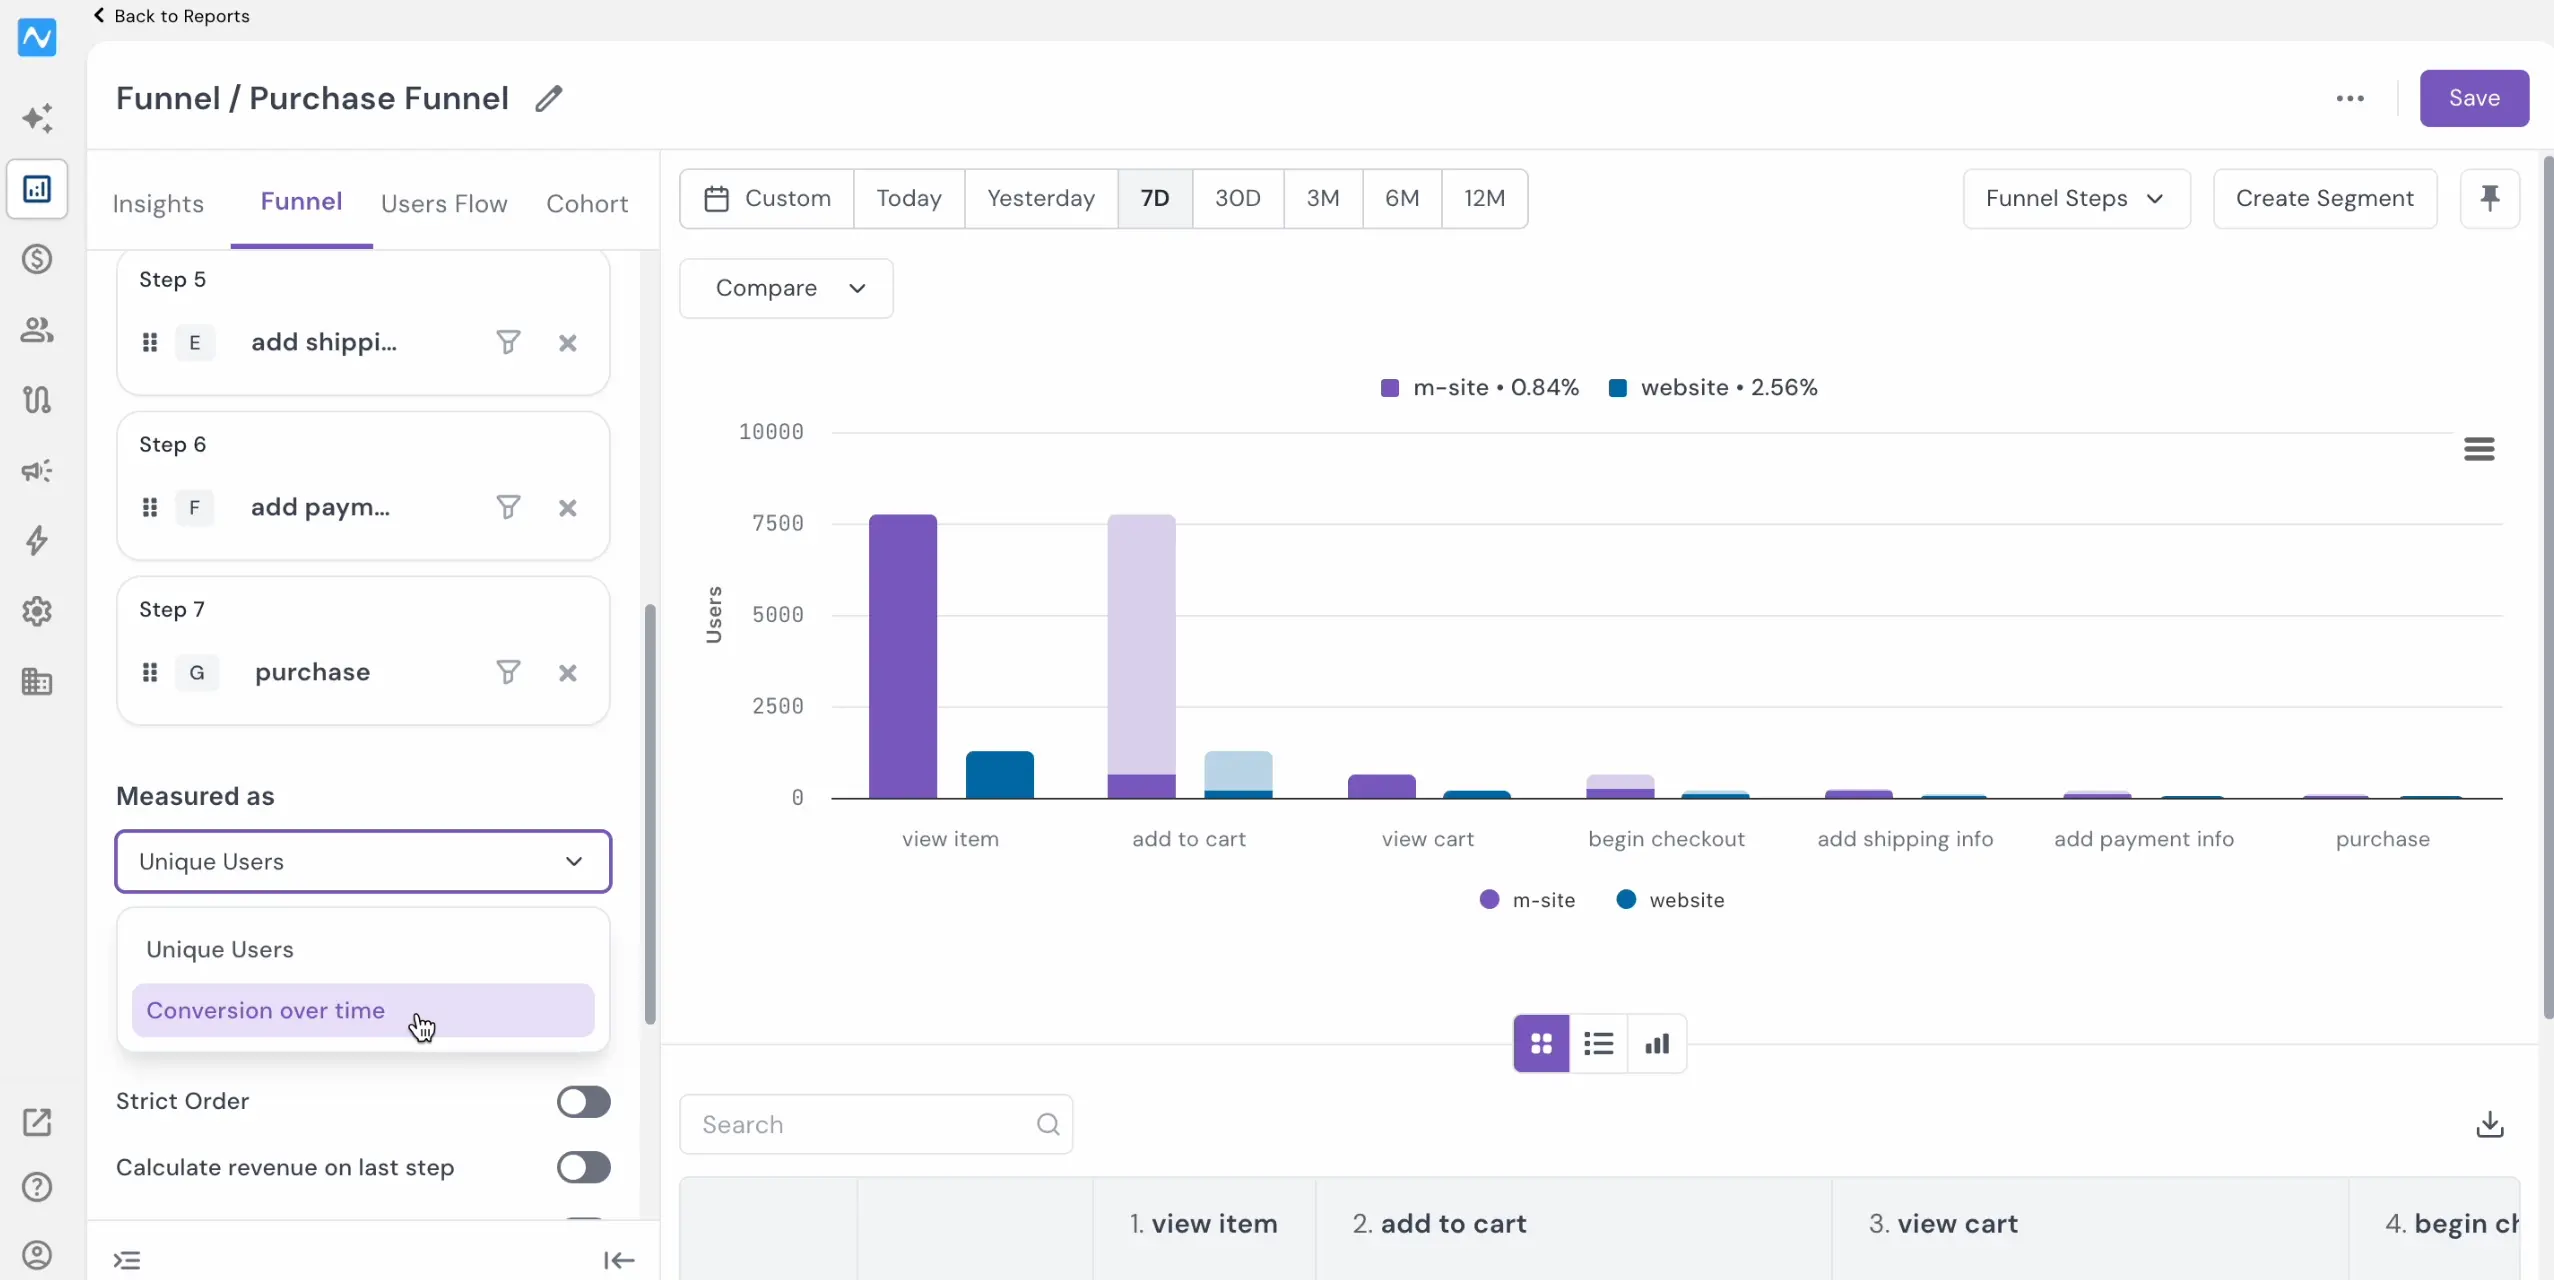
How to use it
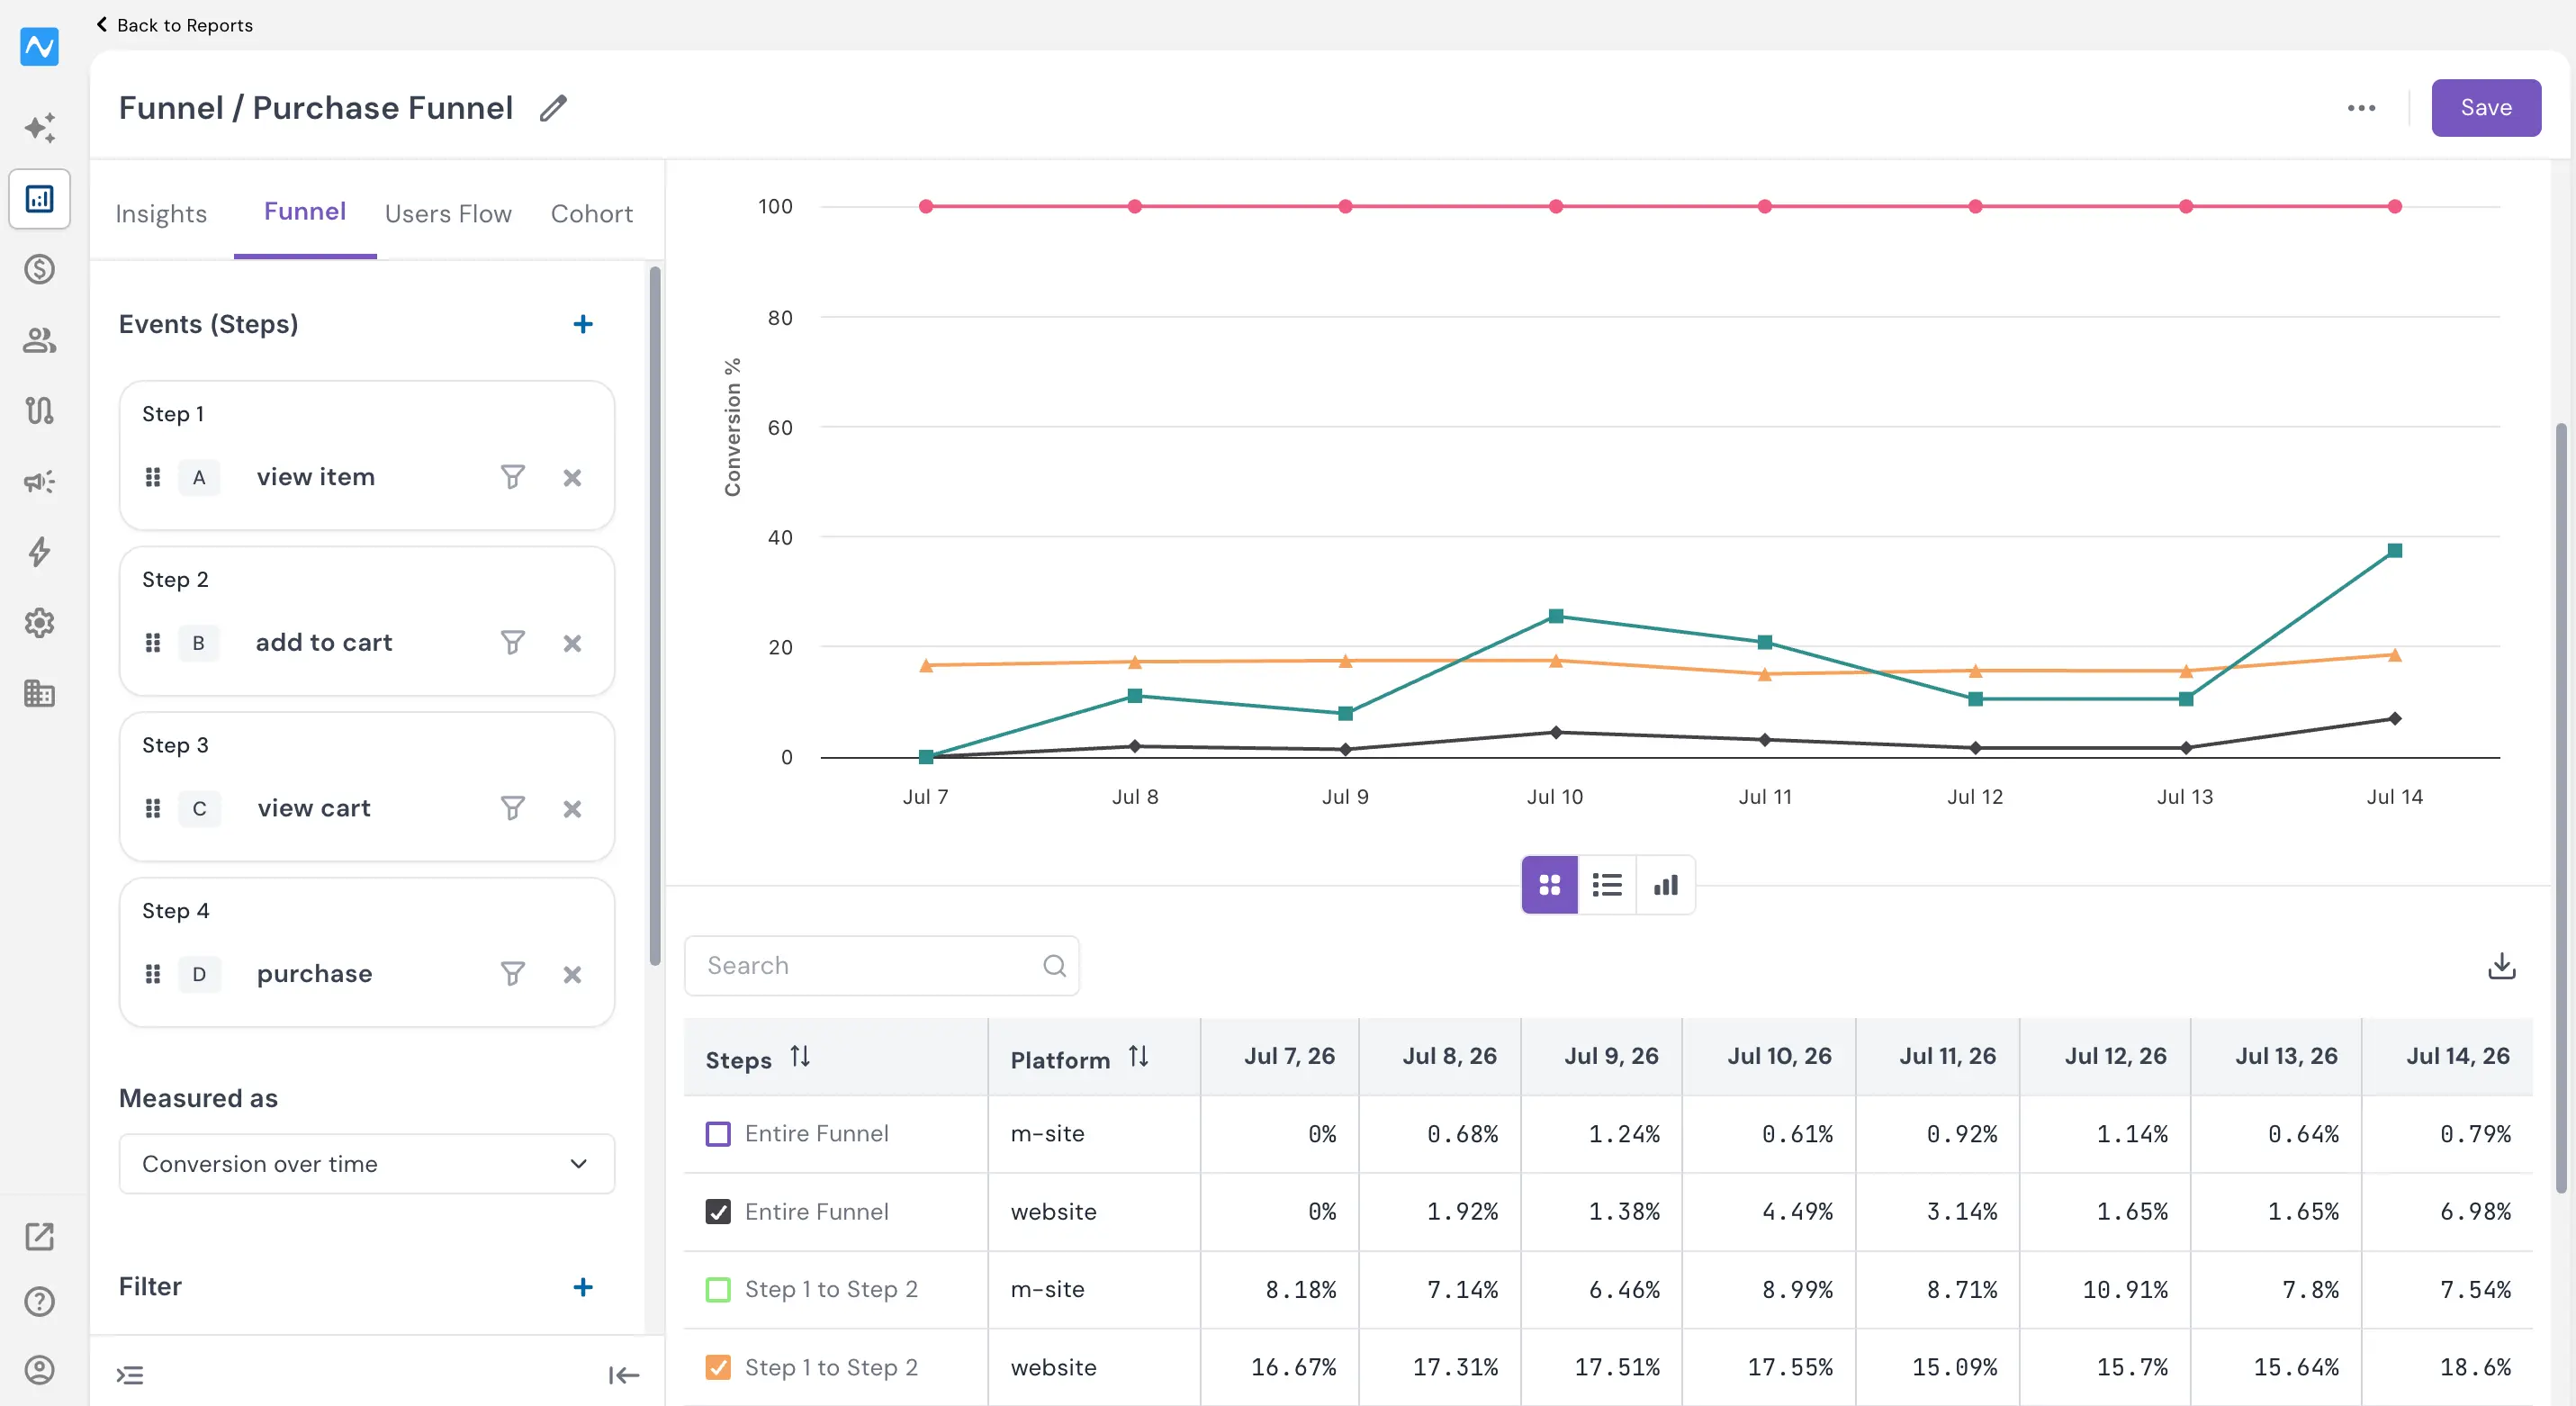
Once Conversion over time is selected, NVECTA plots your funnel's daily conversion in a trend graph and lists the same data in an accompanying table. You'll see the Entire Funnel conversion alongside each step-to-step conversion (for example, Step 1 to Step 2, Step 2 to Step 3), so overall and stage-level movement sit side by side.
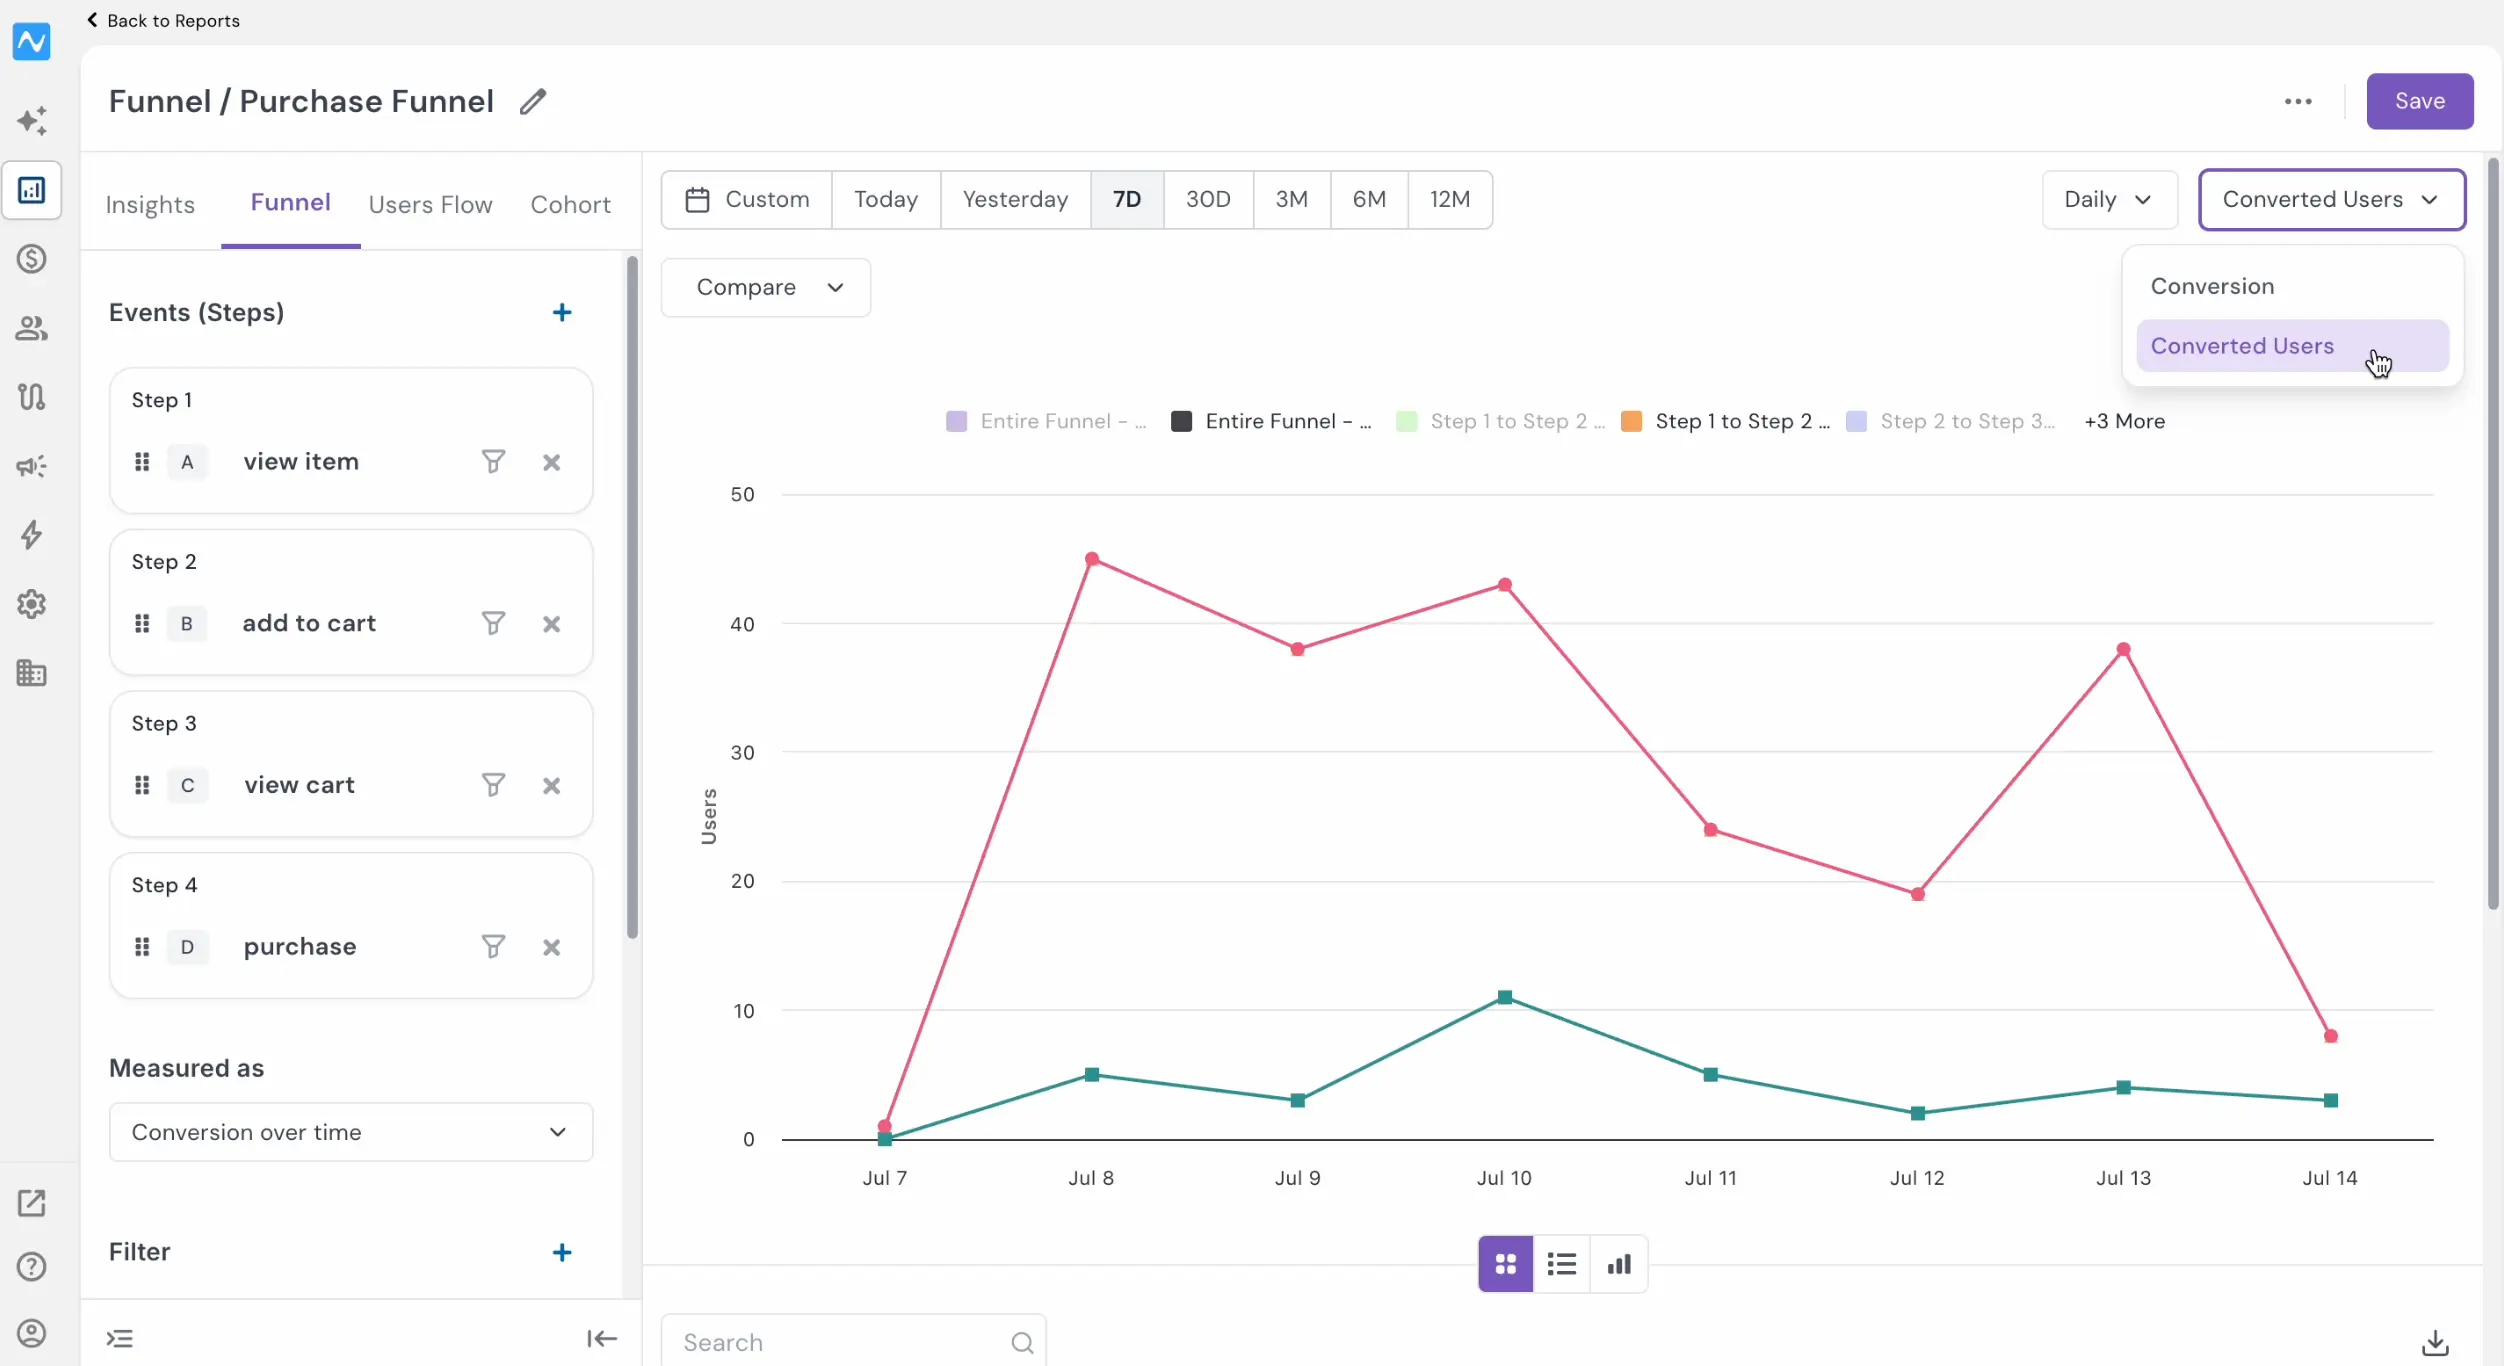
By default, the view shows conversion percentage. To see the actual number of converted users instead, click the Conversion dropdown in the top-right corner and select Converted Users. The graph and table update to reflect counts rather than percentages, letting you switch between "what proportion converted" and "how many converted" in a click.
Problem it solves
A range-level conversion number tells you the outcome but hides the story behind it, so a mid-month drop or a single weak step can stay invisible. Conversion over time turns that flat number into a day-by-day trend for every stage, making drop-offs, seasonality, and step-specific friction easy to catch and act on.
With this update, funnels move from a single snapshot to a continuous view of how conversion evolves, day by day and step by step.