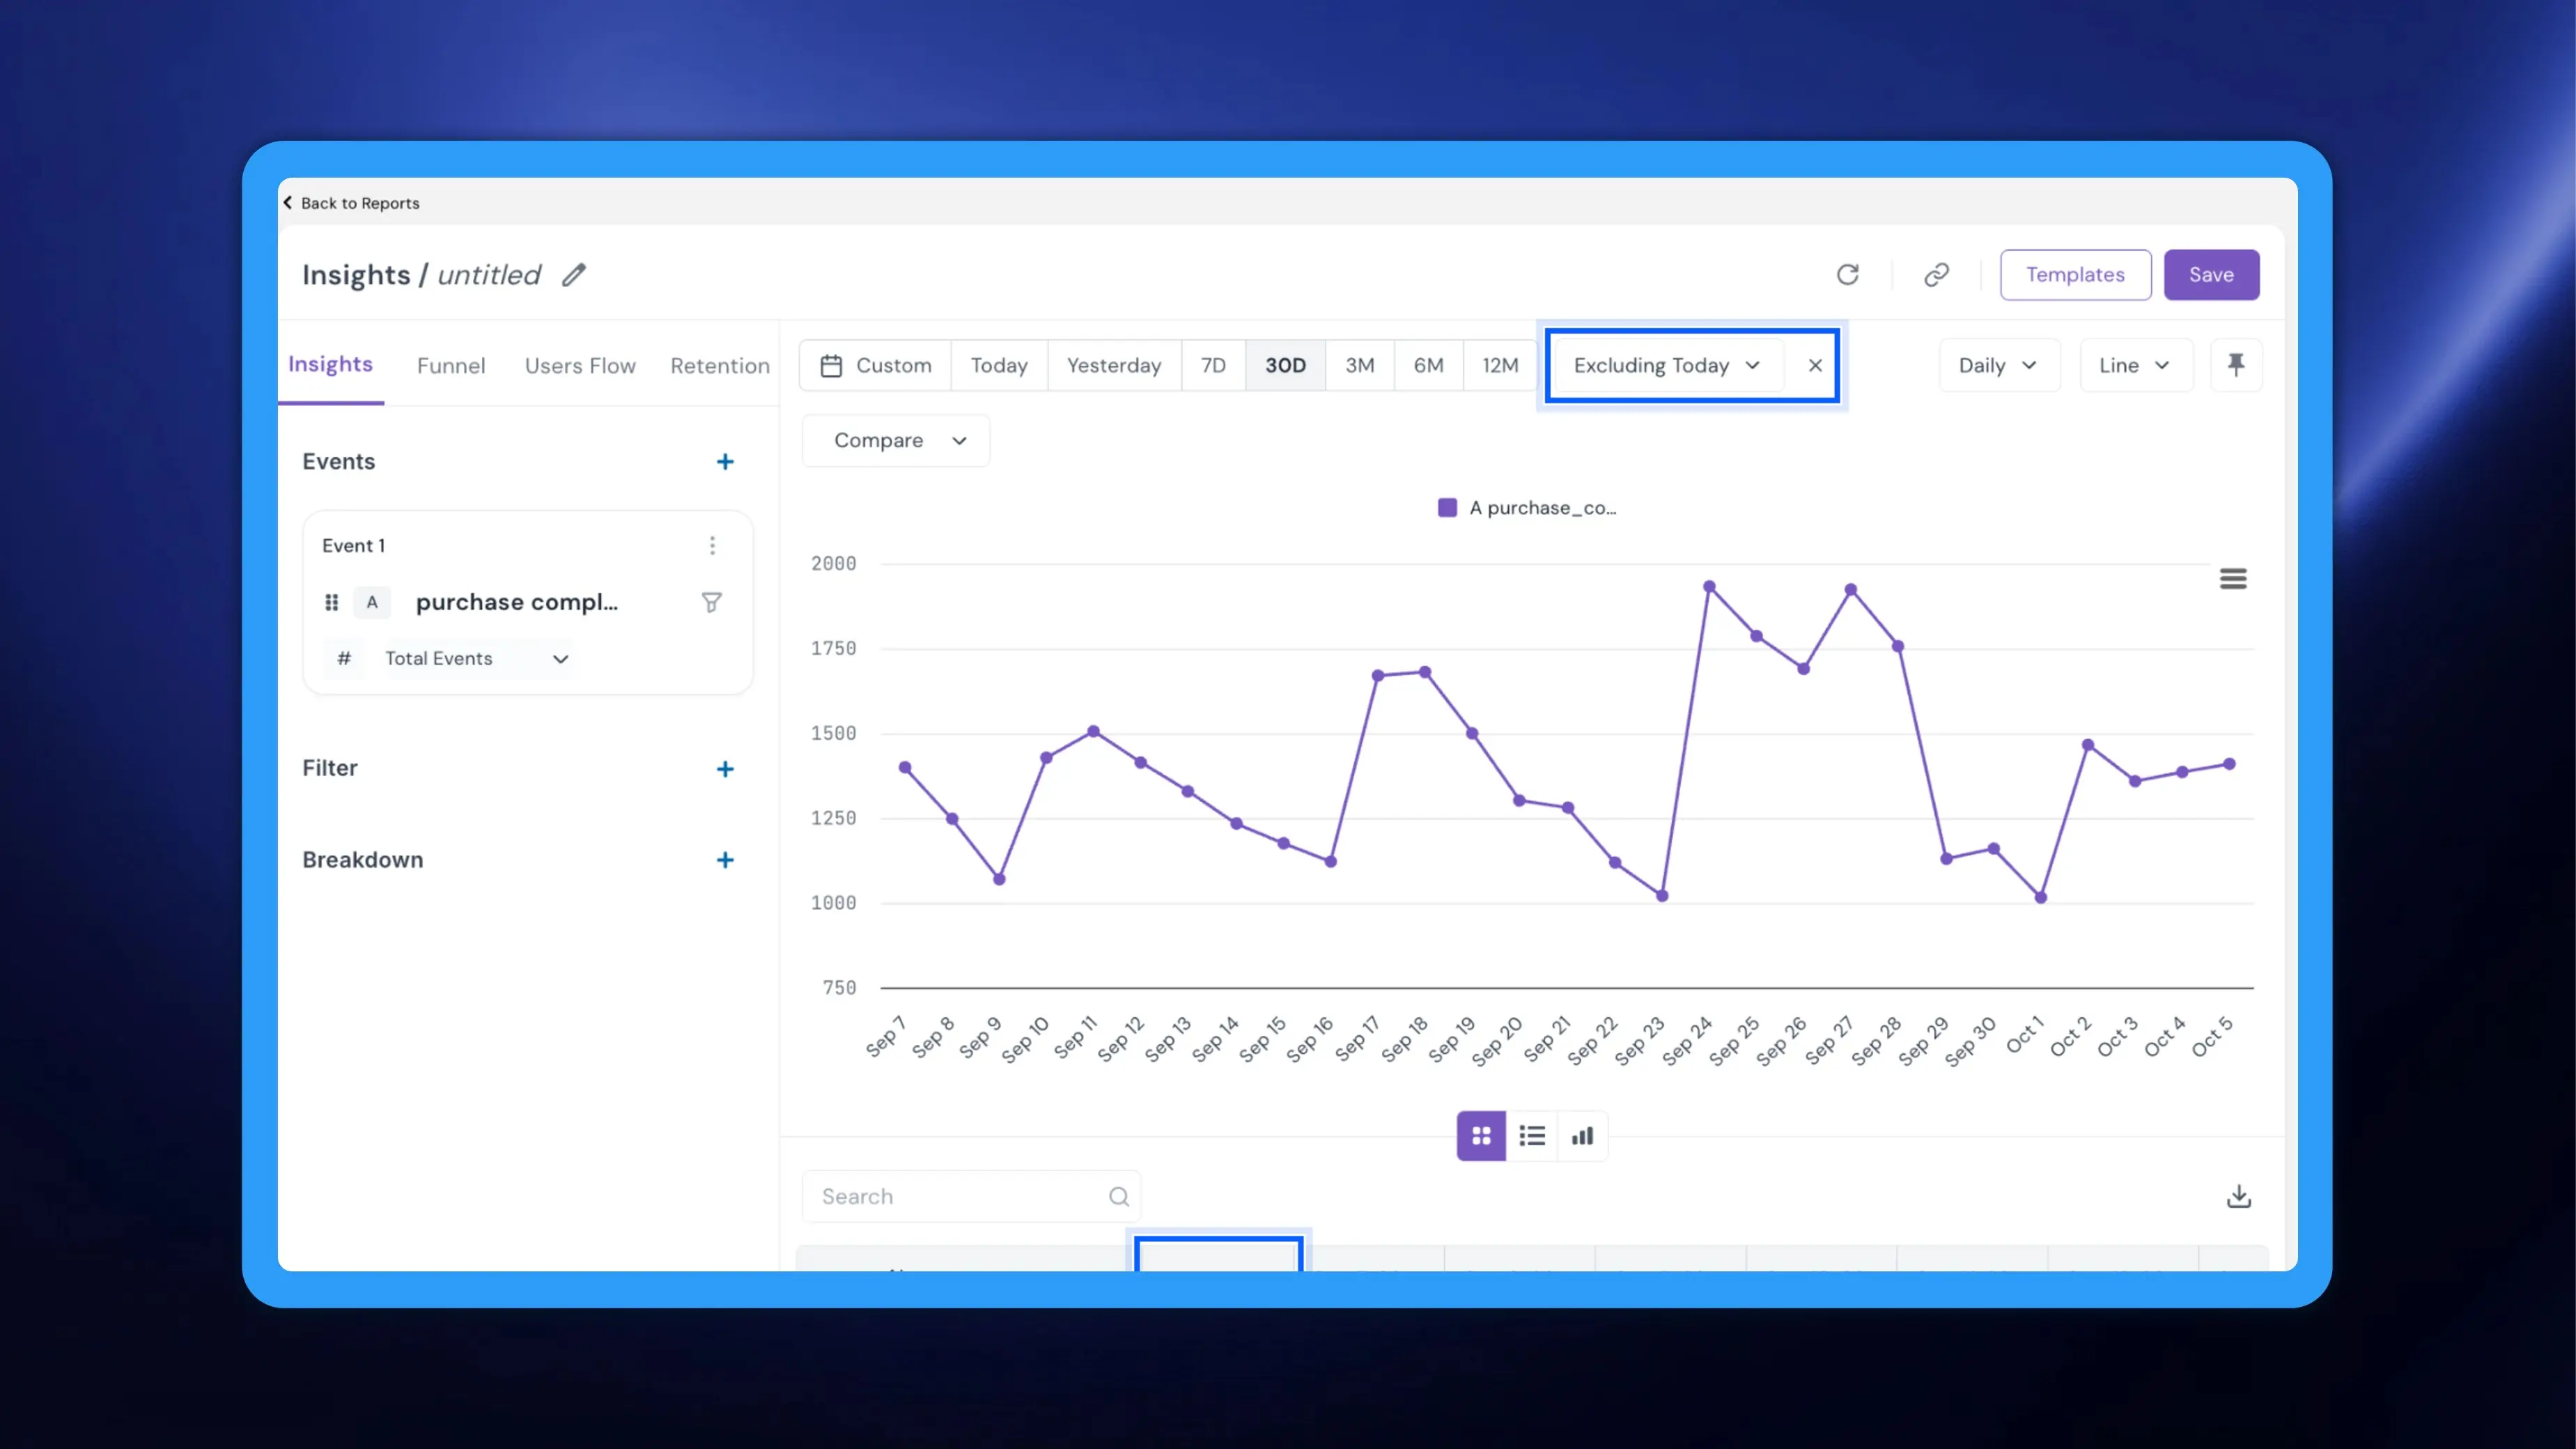
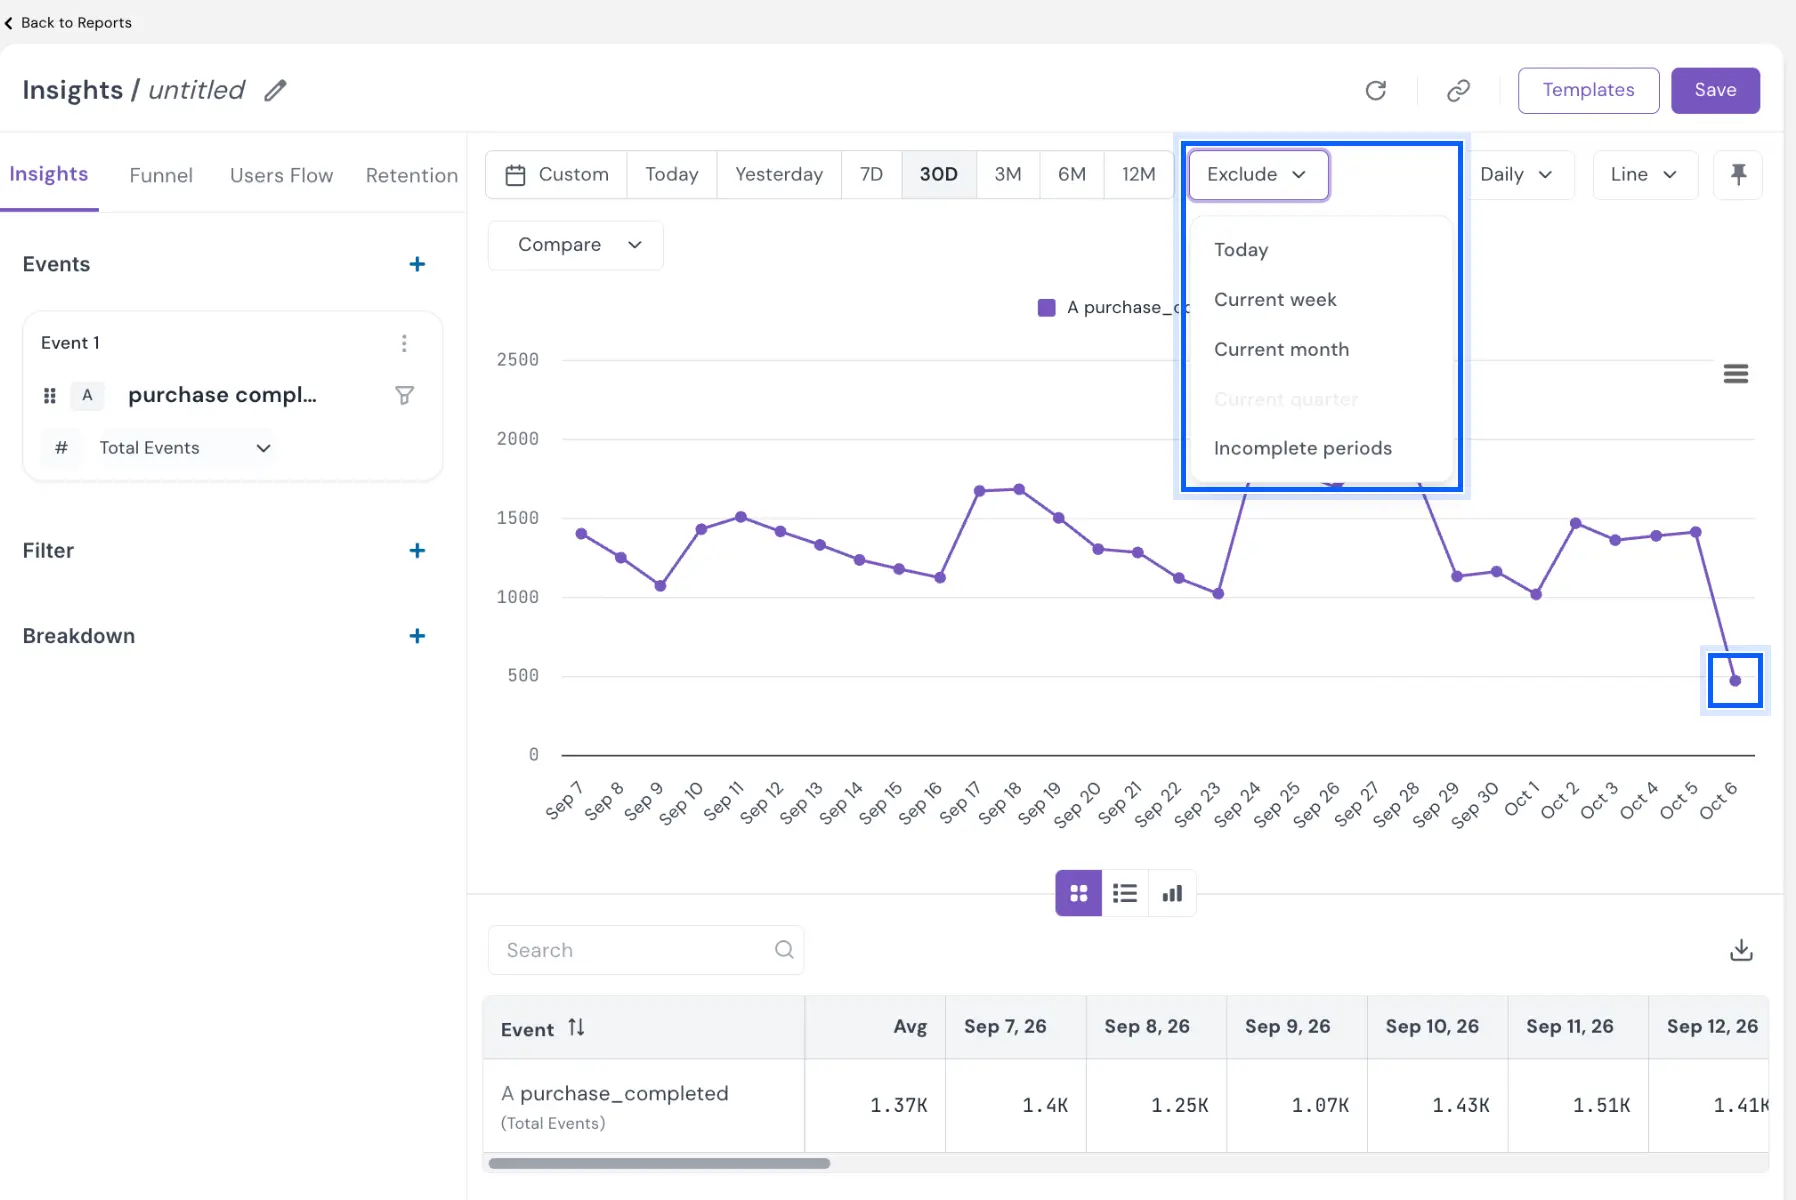
A daily trend that ends on today always looks like a drop, because the last point counts only the hours that have passed so far. The same happens to the current week in a weekly view or the current month in a monthly one. That partial point drags down averages and sets off false alarms. NVECTA now lets you leave today, the current week, the current month or any incomplete period out of an Insights report in one click, so every point you read is a complete one.
How to use it
Go to Analytics → Insights. The Exclude dropdown sits right after the date presets (Custom, Today, Yesterday, 7D, 30D, 3M, 6M, 12M).
Open Exclude and choose what to leave out:
- Today
- Current week
- Current month
- Current quarter
- Incomplete periods, which leaves out whichever period is still in progress at the granularity you are viewing.
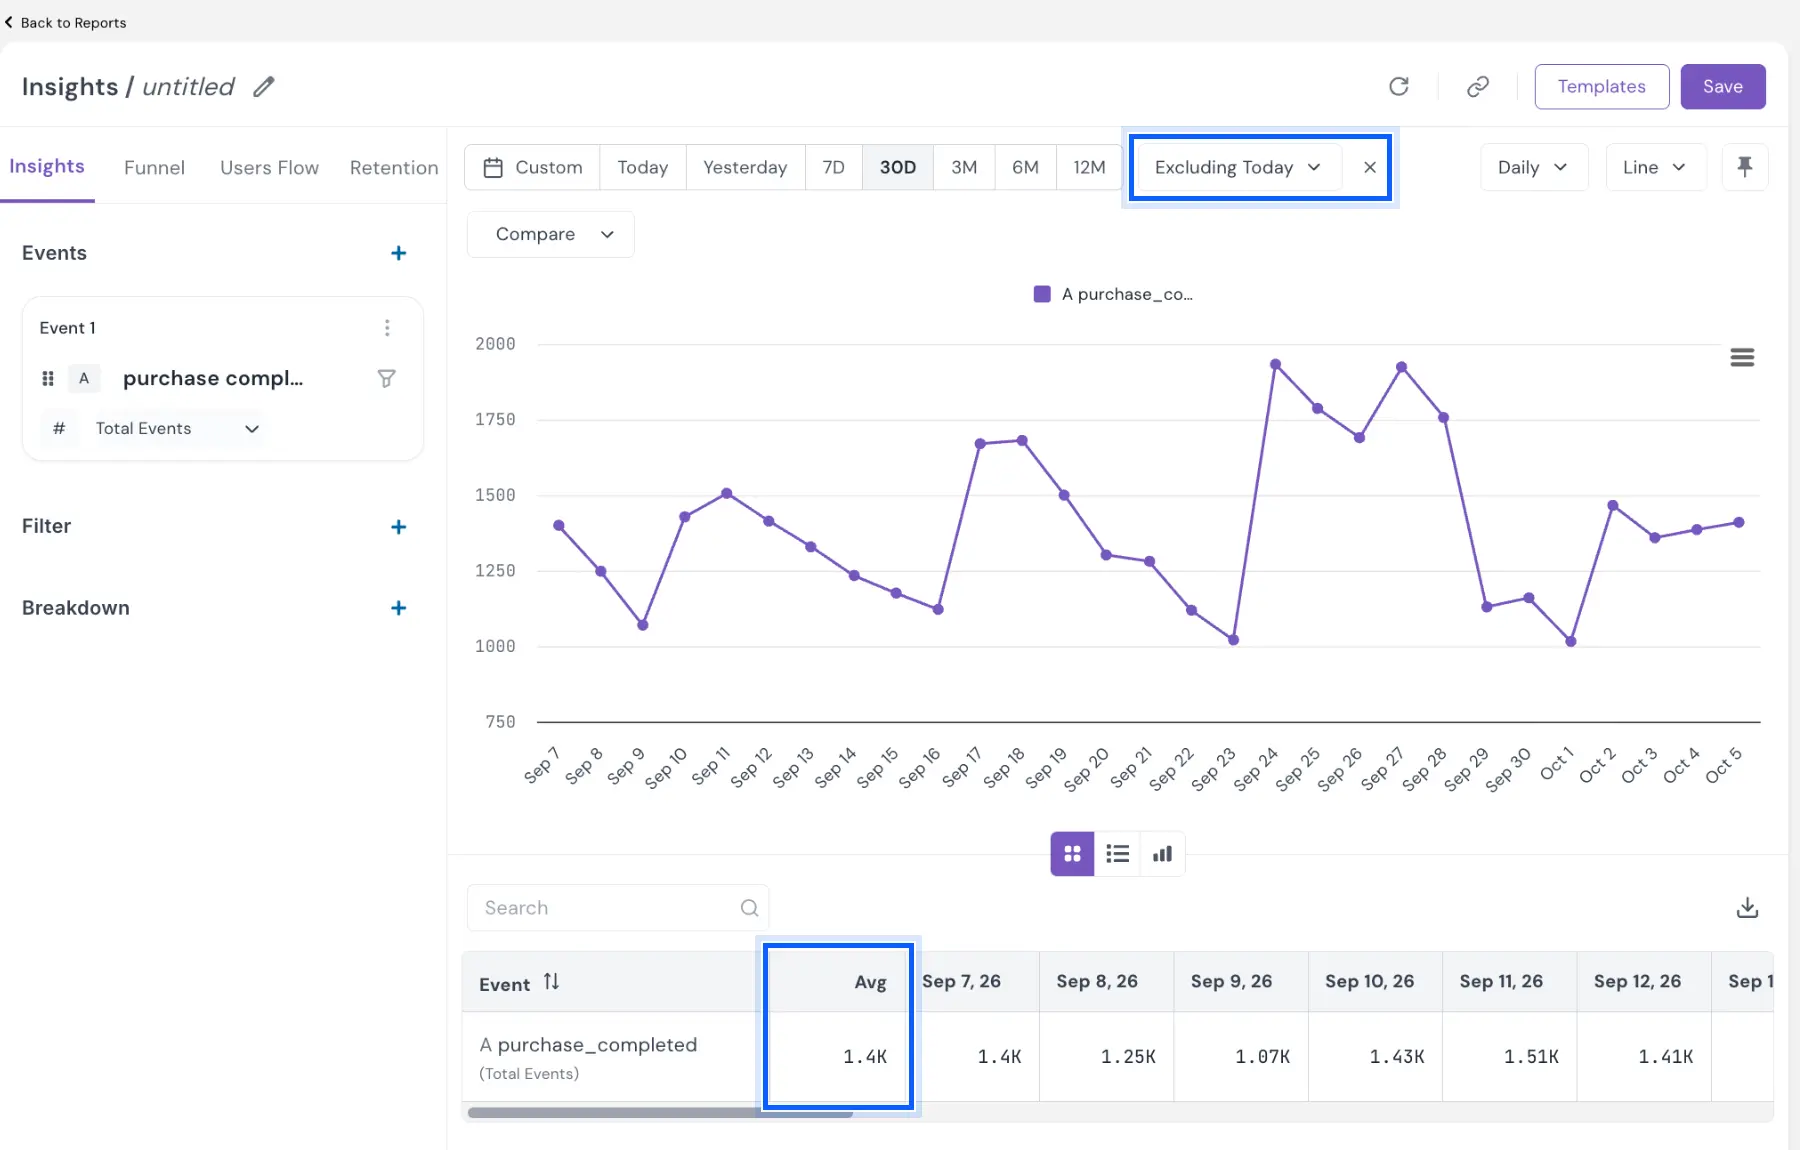
The button changes to show your choice, for example Excluding Today, and the chart, the table and the Avg column recalculate without the partial period. Click the × beside the button to bring it back. Nothing is deleted; the excluded data is only left out of this view.
Example
An online fashion store's growth lead checks daily orders for the last 30 days every morning. At 10 a.m. the latest point always sits far below the rest, and the 30-day average looks weaker than it is. With Exclude set to Today, the chart ends on yesterday's full day and the average reflects complete days only. For Monday's weekly review, the lead switches the granularity to Weekly and chooses Current week, so the trend ends on last week's complete total.
Problem it solves
Partial periods are not wrong, only early, but on a chart they read as a decline. Excluding them keeps trend lines, averages and period-over-period reads honest, without changing your date range or exporting data to trim it by hand.
Your trends now end on the last complete period, so a dip on the chart is a real one.