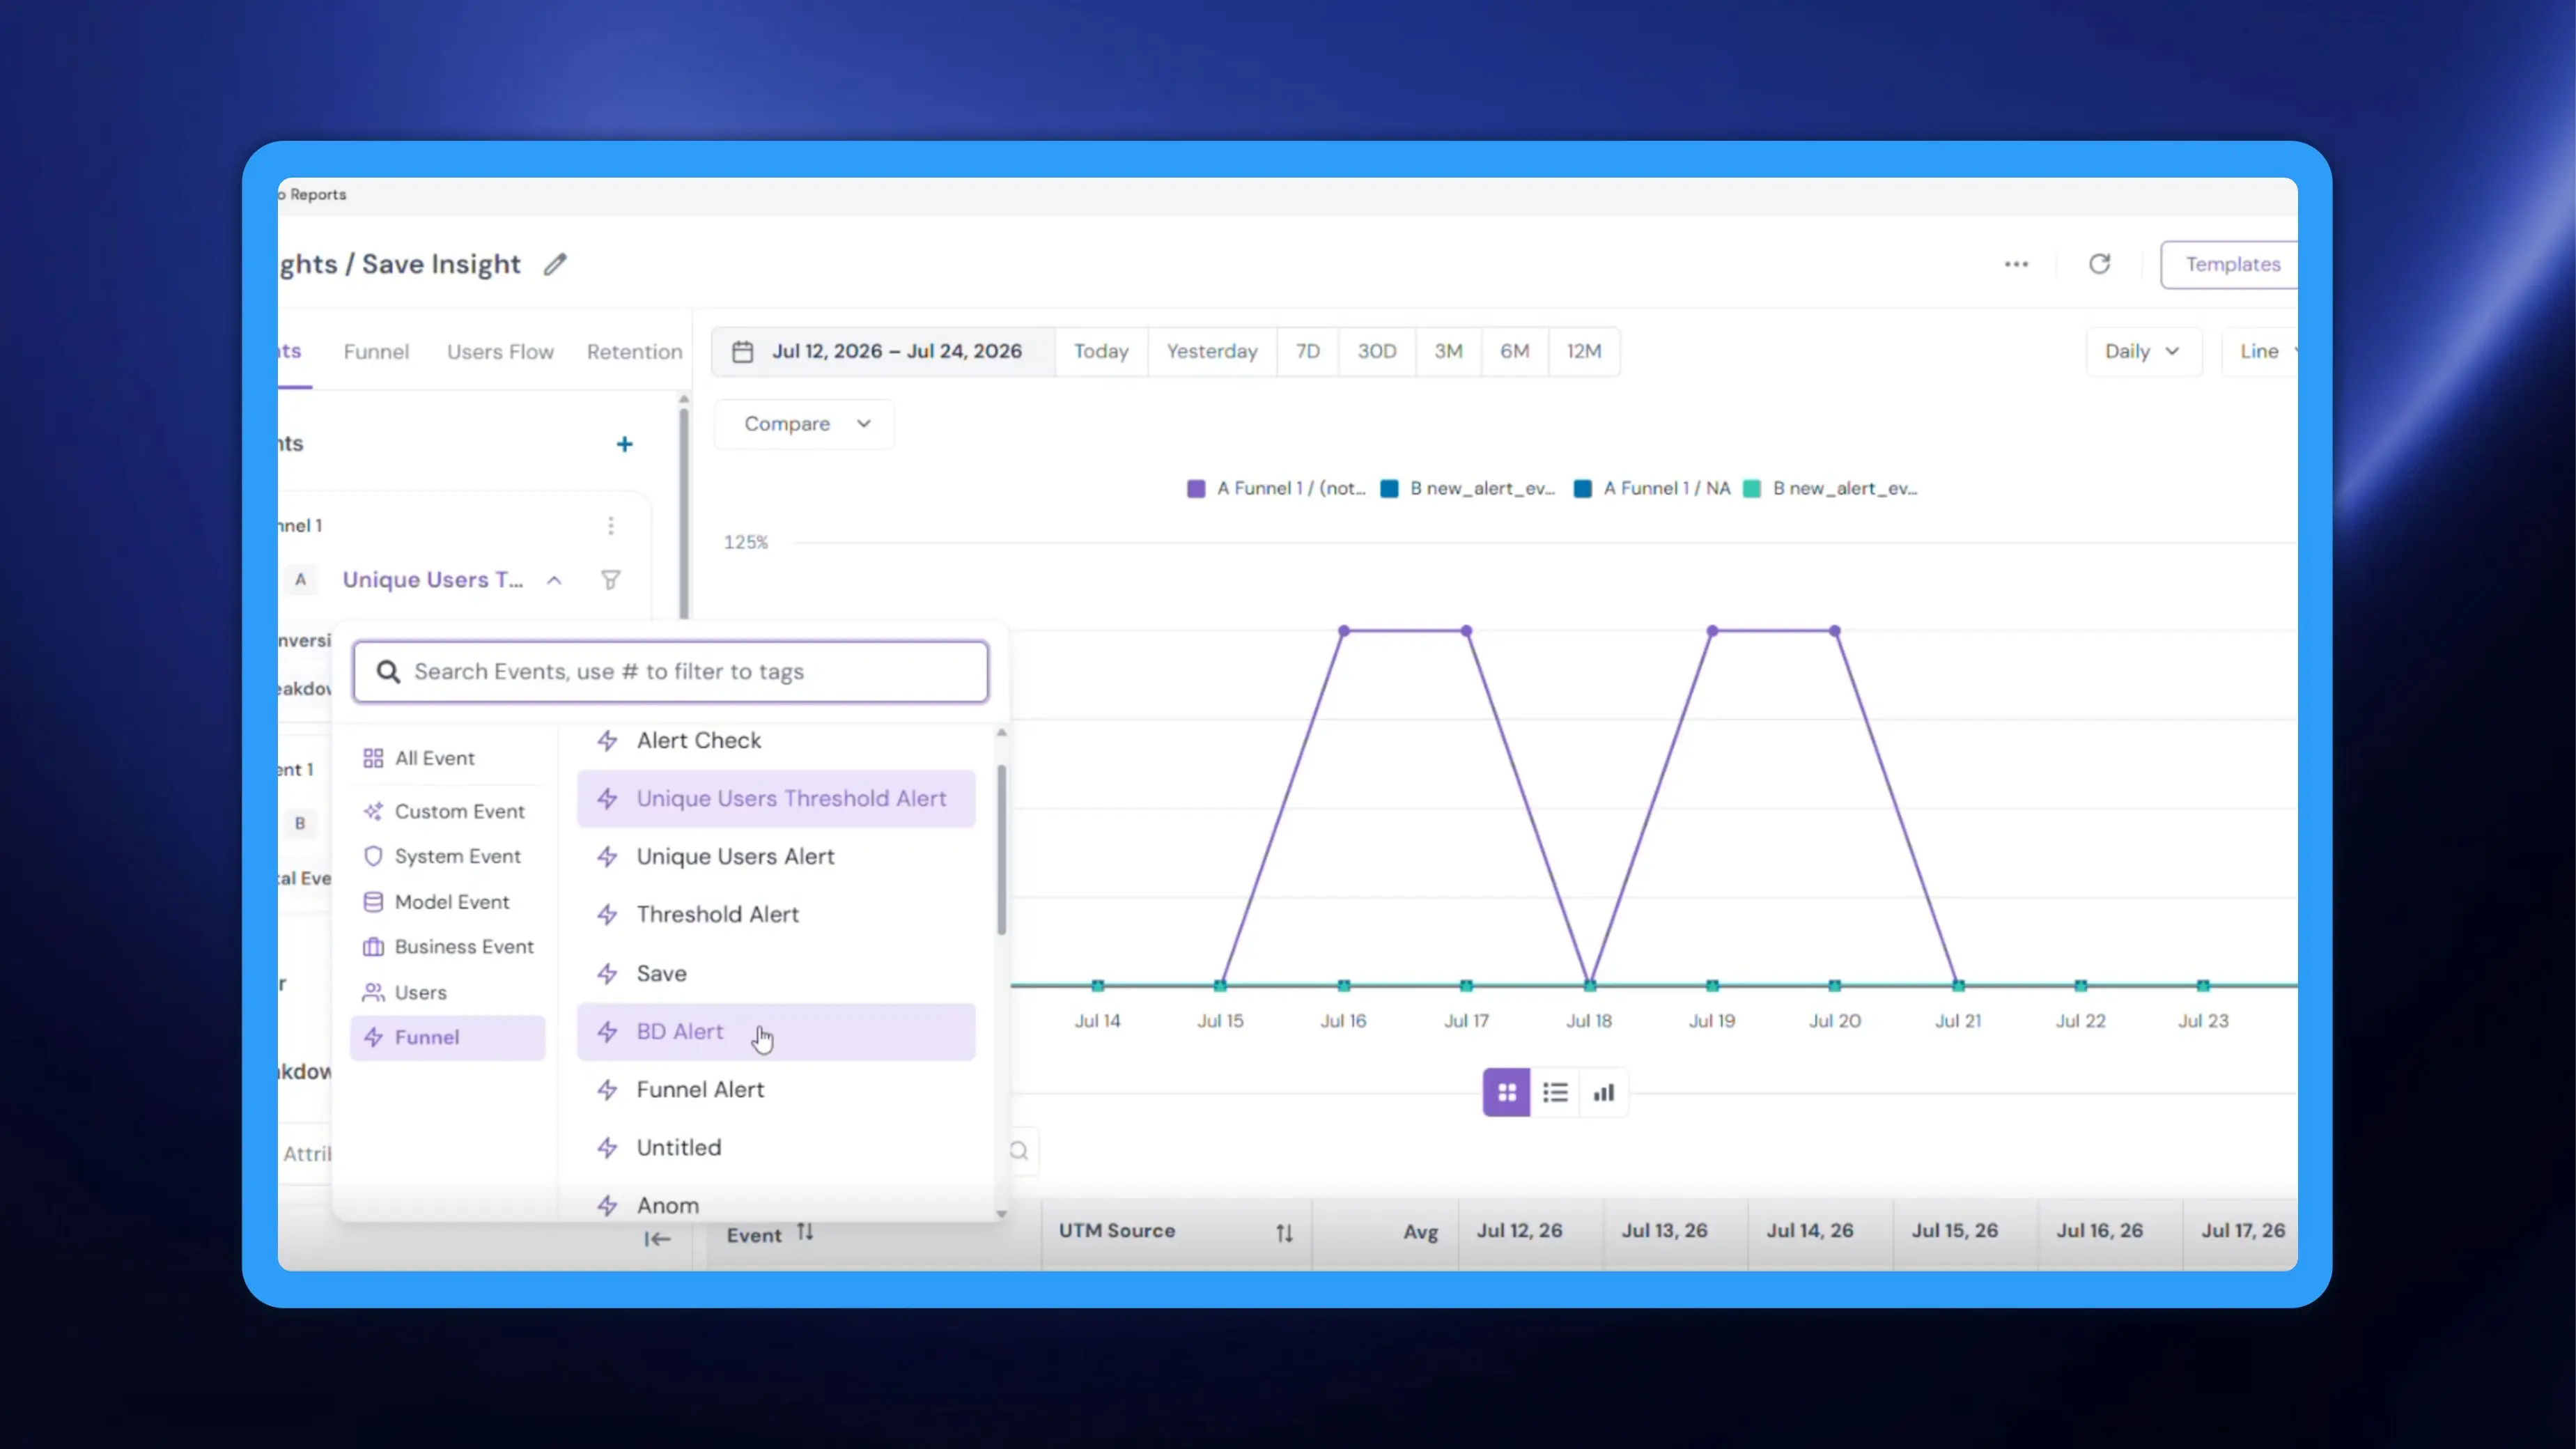
A funnel and an Insights report have always answered separate questions. The funnel showed conversion between steps, Insights showed how events move over time, and putting the two together meant opening both reports and reconciling them by hand. NVECTA now lets you pull any funnel you have already saved straight into an Insights report as a series of its own. You choose the funnel, decide whether to plot conversions or users, scope it to the entire funnel or to a single step-to-step transition, and break it down by an attribute at the step you care about – all next to the other events in the same report.
How to use it
Go to Analytics → Insights and open or create an insight report.
If you are new to Insights, kindly go through Insights report: A multi-event analysis in the knowledgebase for a thorough tutorial, and How to create a funnel for building the funnel itself.
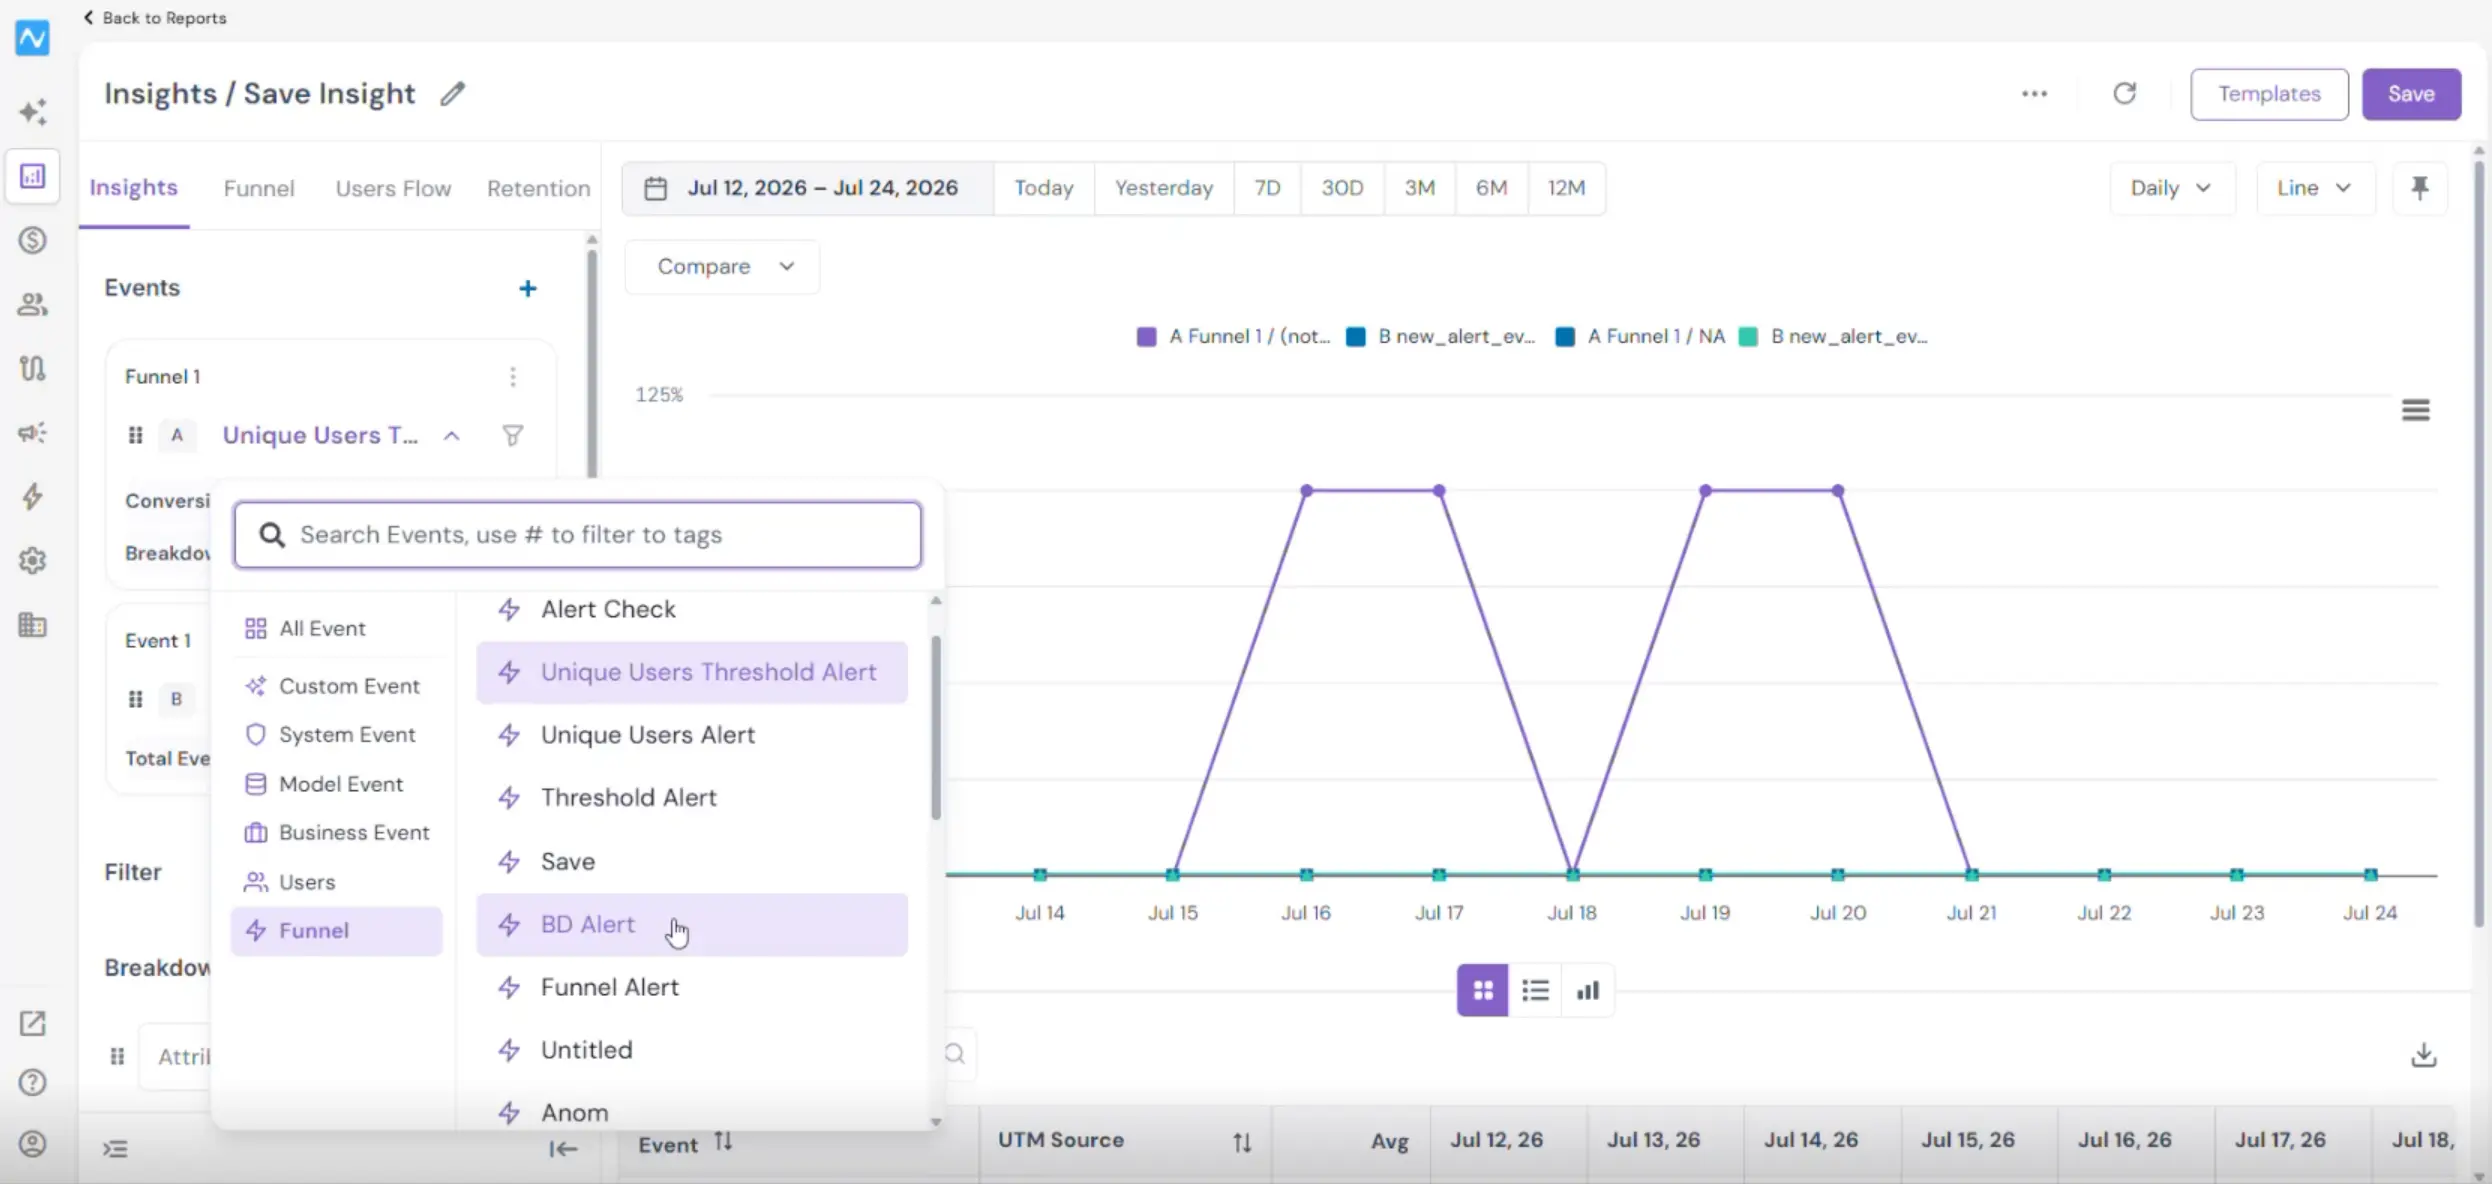
- Click + in the Events panel, select Funnel in the category column, and pick the funnel you want. It lands in Events as its own card and takes a series letter exactly like an event does.
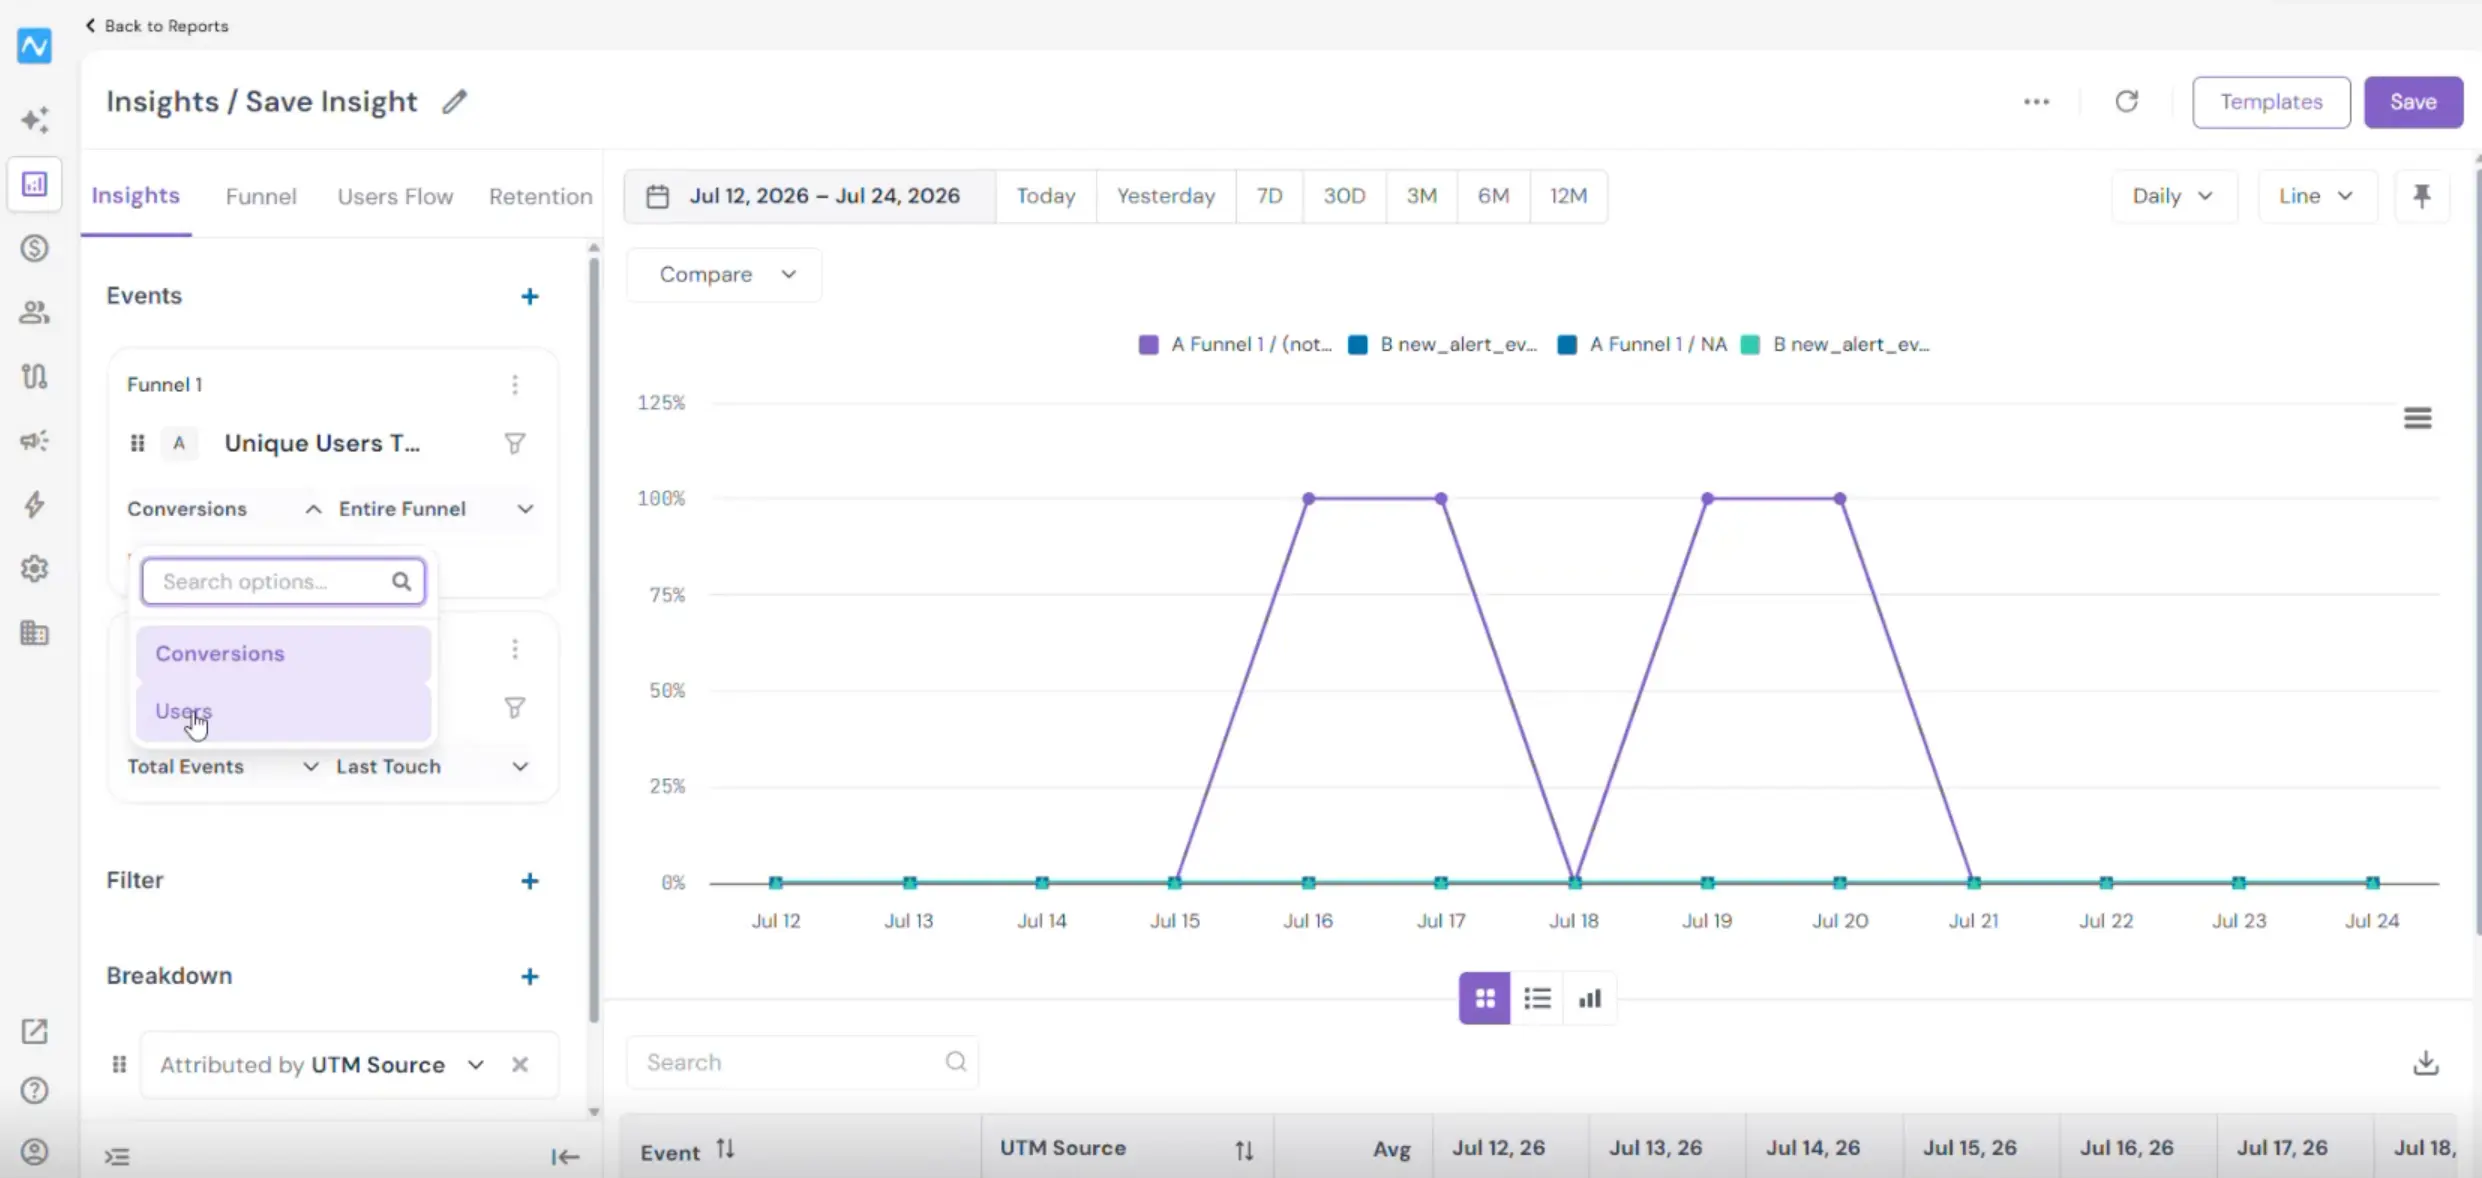
- Set what you want to measure with the first dropdown on the card: Conversions or Users.
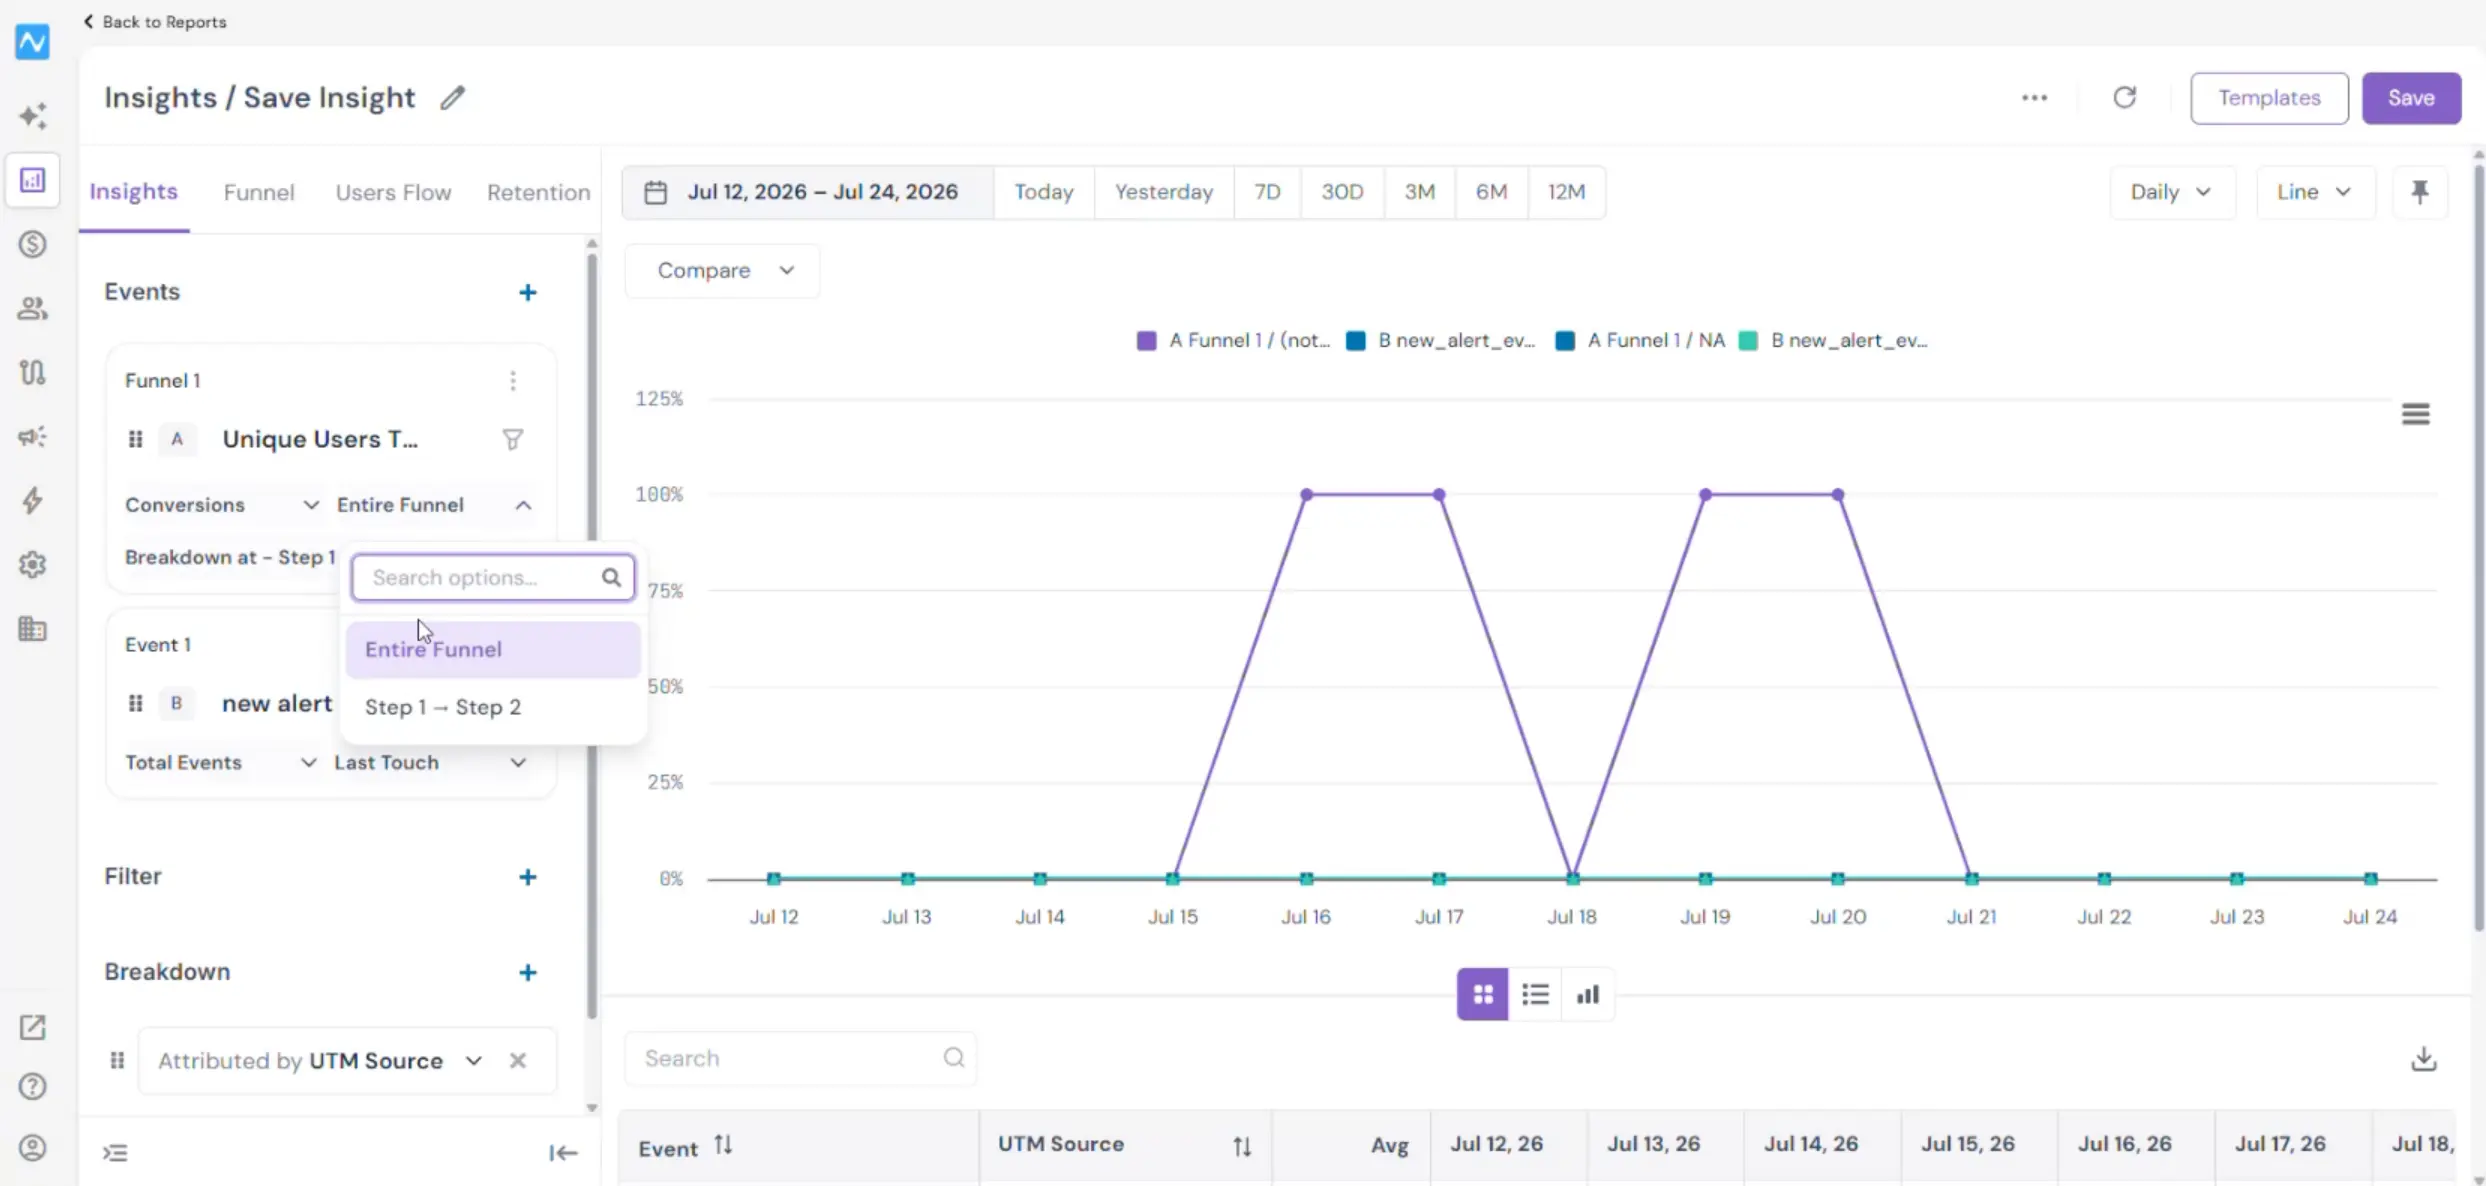
- Set the scope with the second dropdown: Entire Funnel for the whole journey, or a step-to-step option such as Step 1 → Step 2 for a single transition.
- If you want to split this funnel event choose the Breakdown at – dropdown on the funnel card: Breakdown at – All Steps or a single step such as Breakdown at – Step 1 or Breakdown at – Step 2.
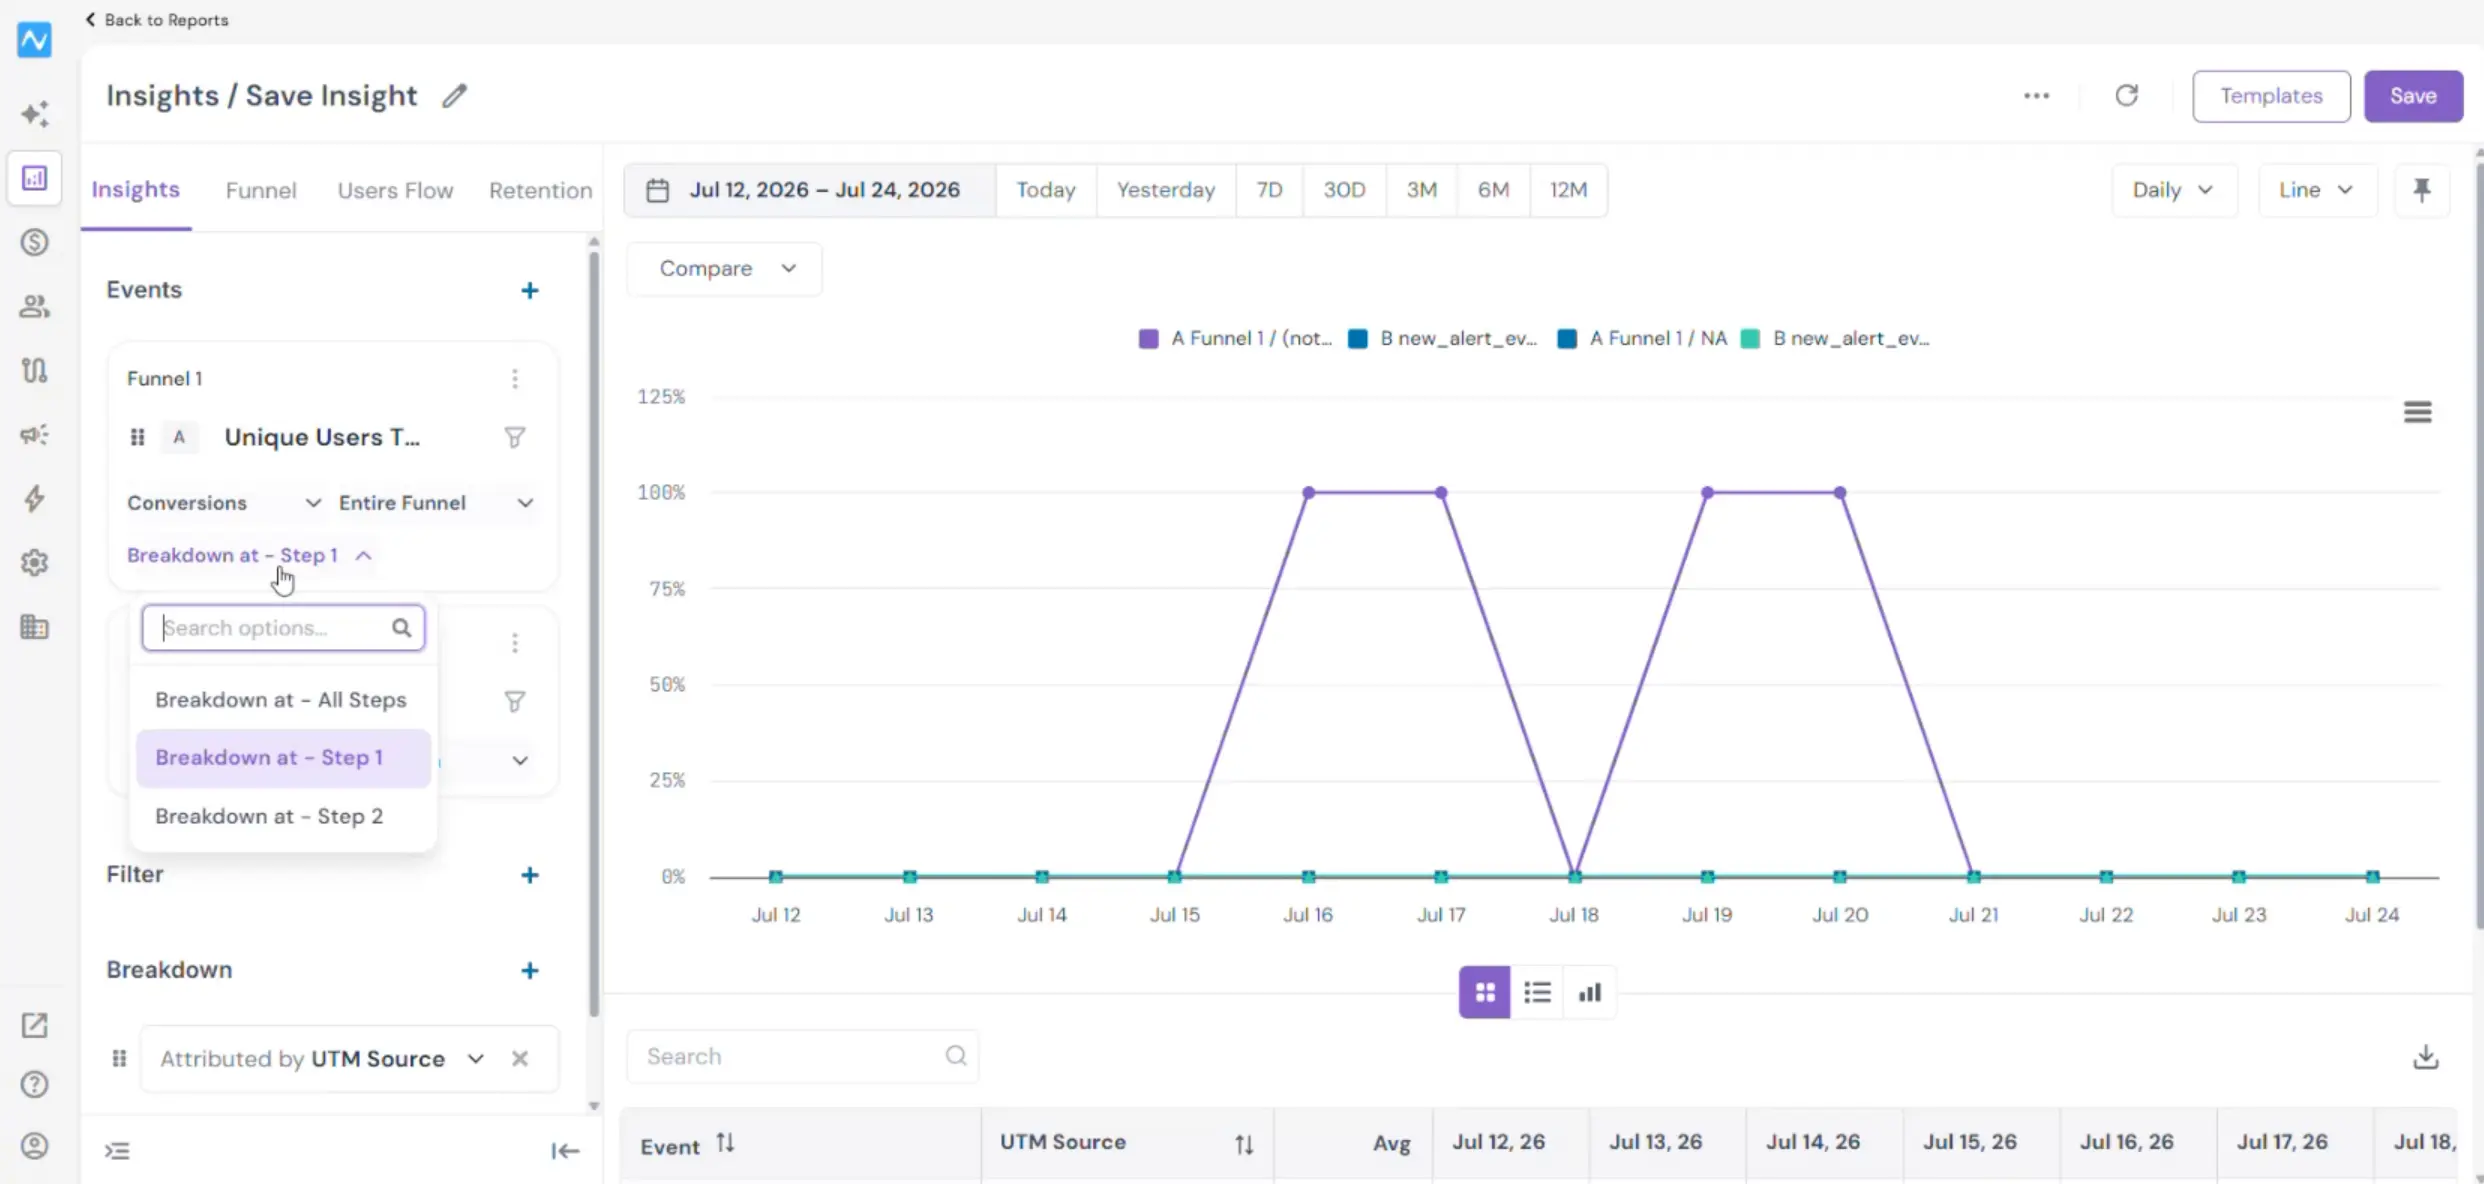
- Read the result. The funnel plots as its own line in the chart and is labelled in the legend with its series letter, funnel name and breakdown value. Switch the visualisation to Table and you get the total conversions for the period, one row per breakdown value plus an Overall row.