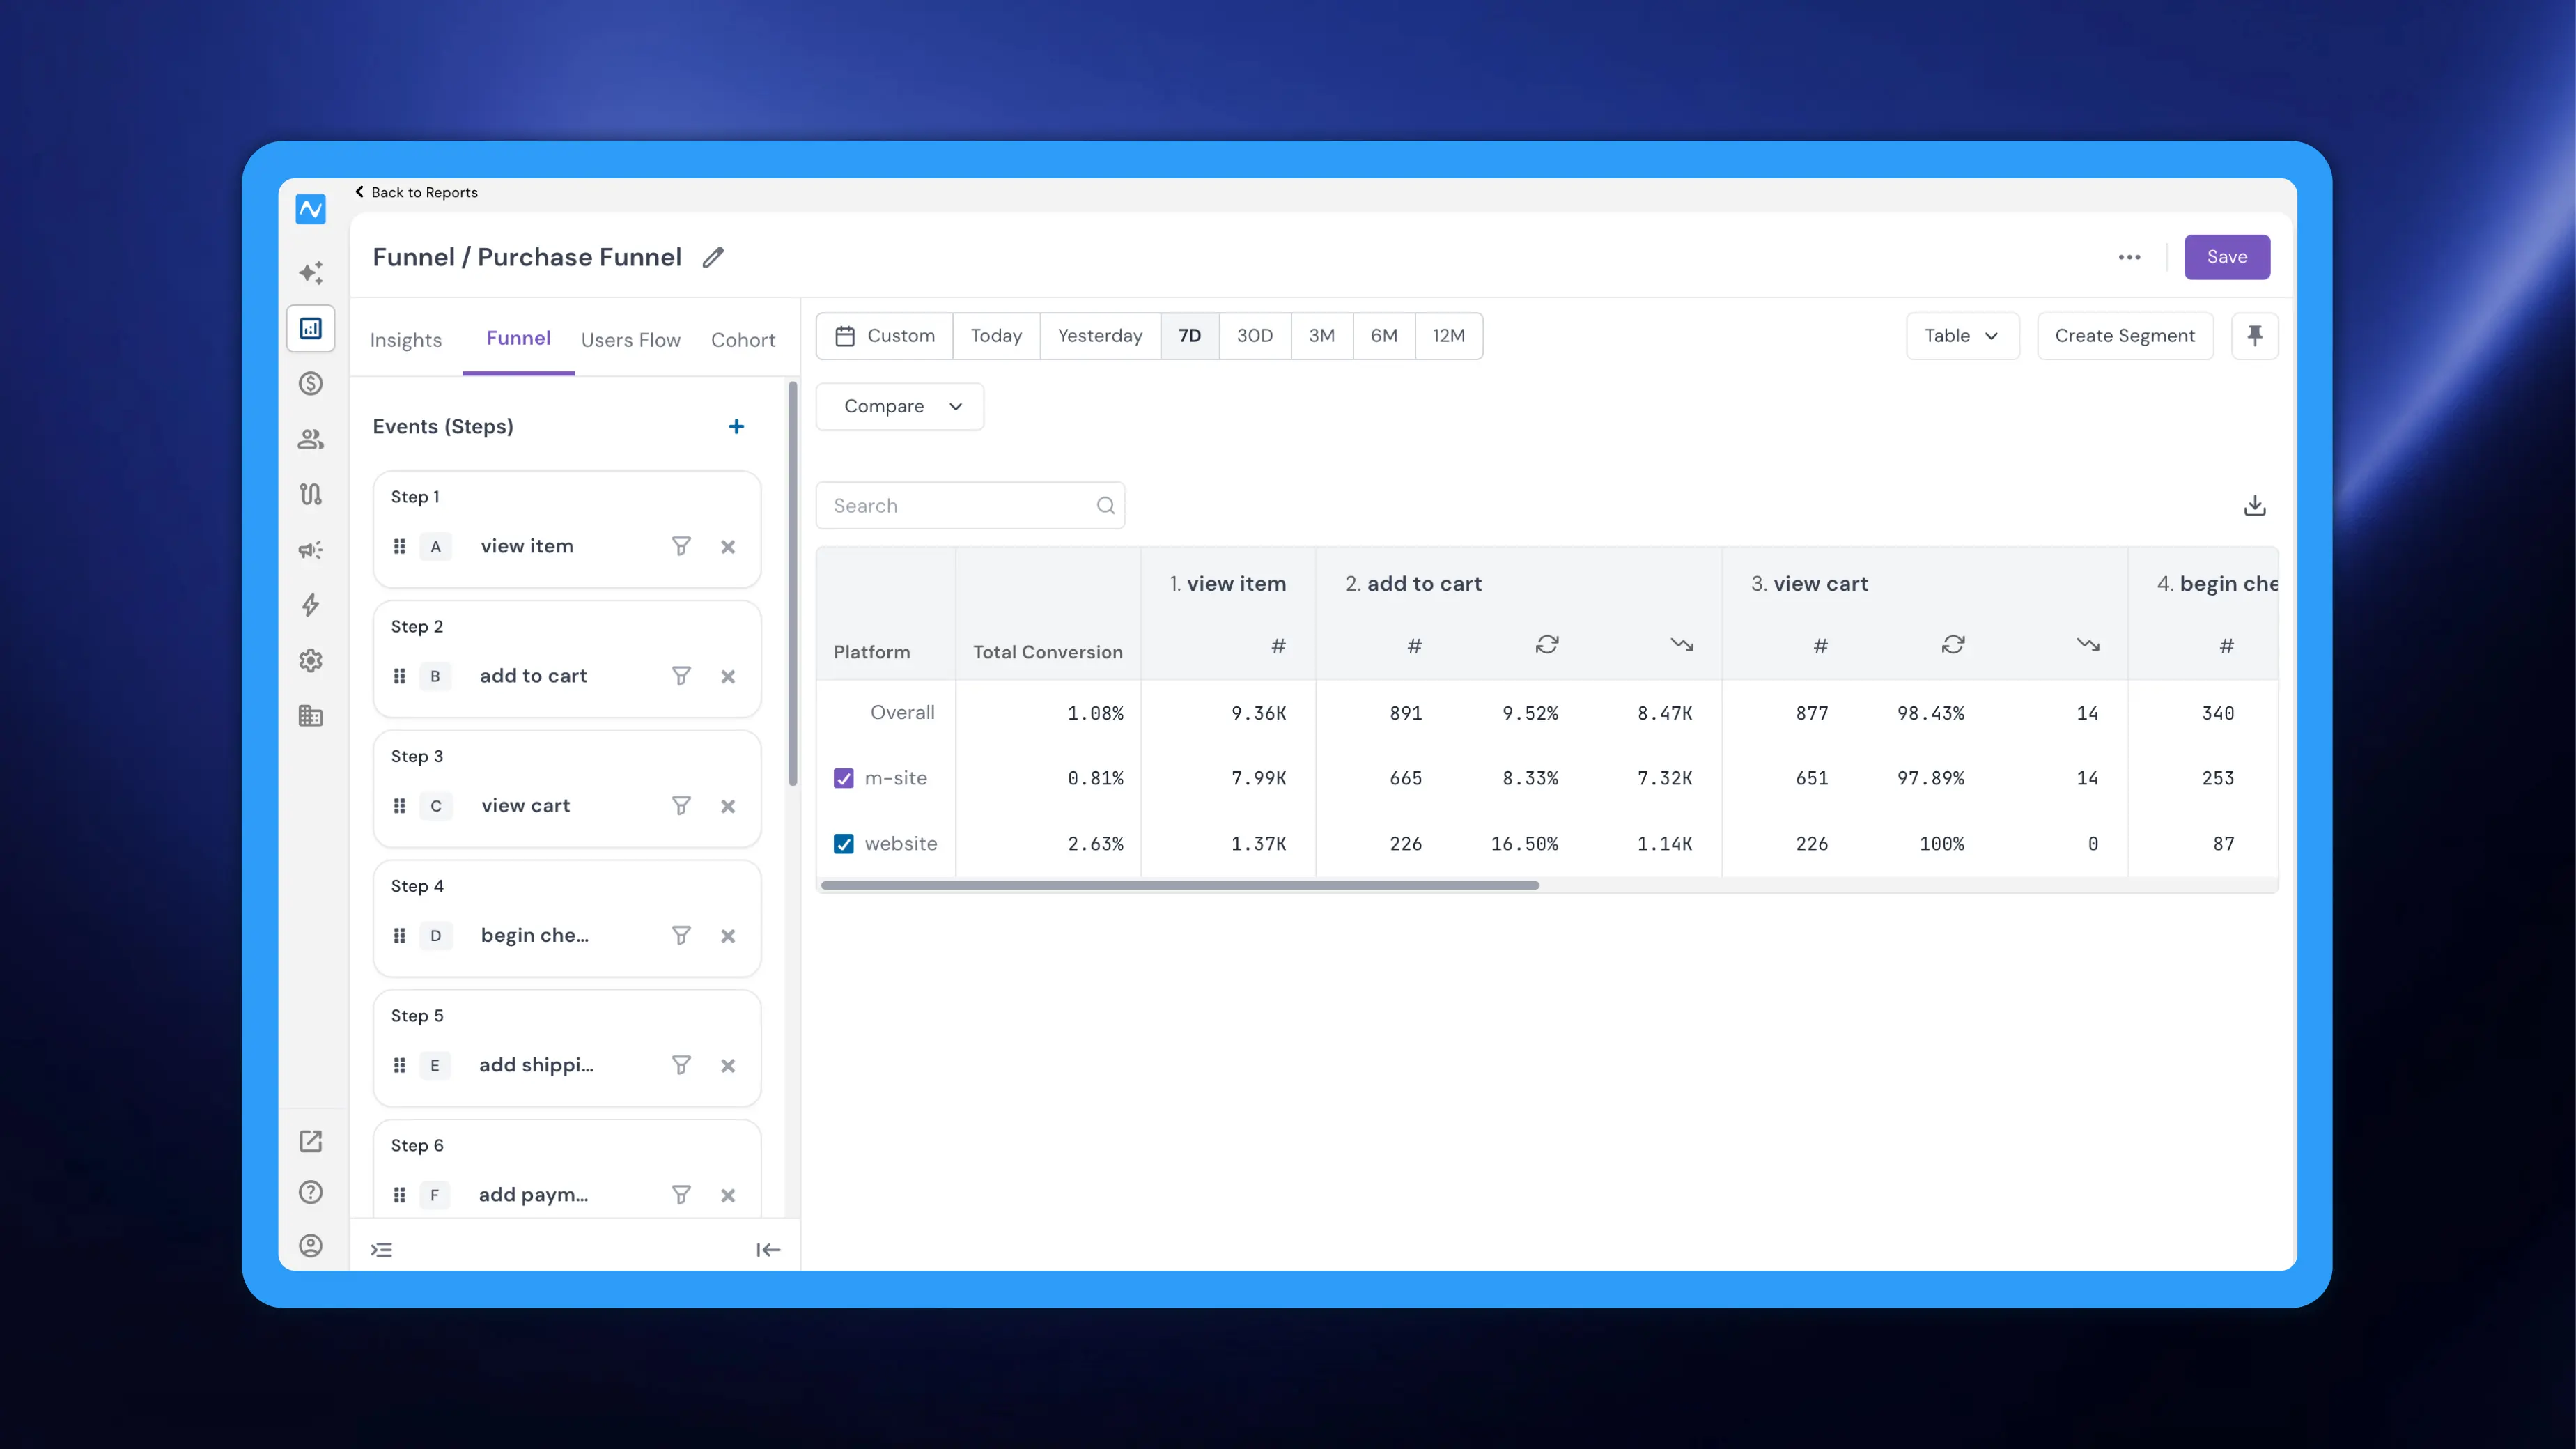
We've reworked how funnel results are displayed. Previously, the table laid out results step by step with limited context. Now the funnel table opens with Total Conversion, followed by a column for each event/step in your funnel, and every step is broken down into the sub-metrics that actually matter, so you can read entry, conversion, drop-off, and timing side by side without piecing them together yourself.
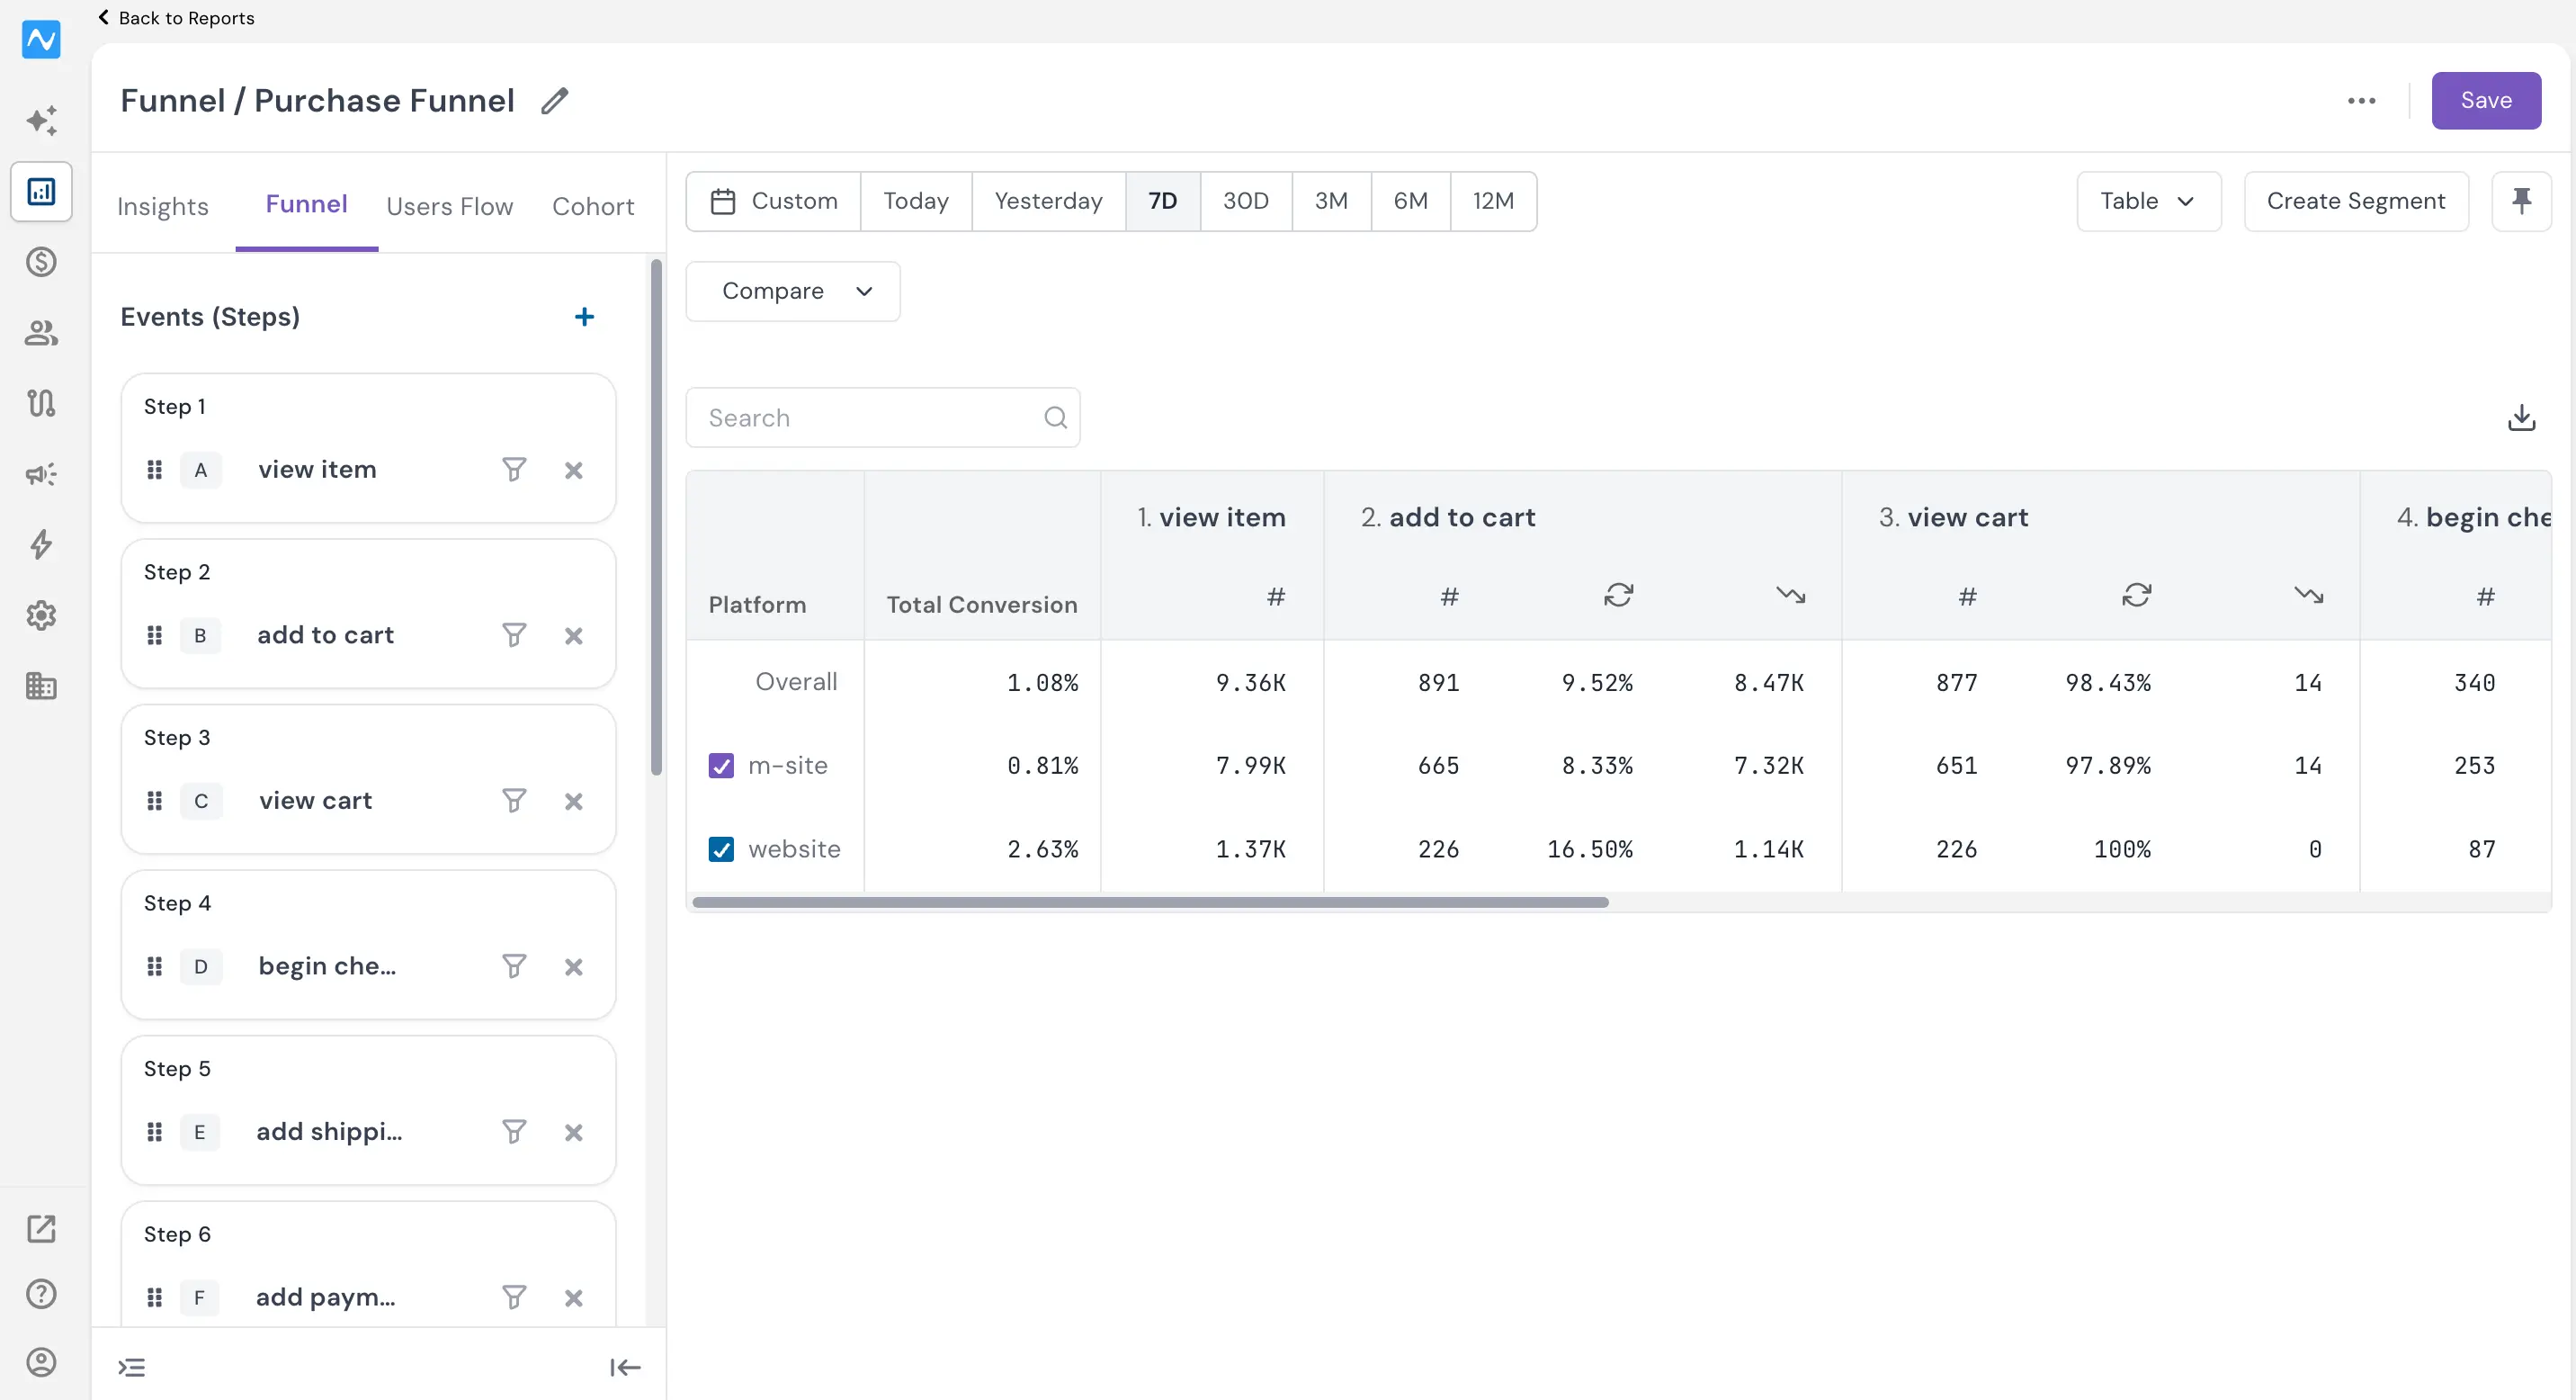
How to read the new table
The first column shows your funnel's Total Conversion. Each step then gets its own column:
- The first step shows the number of users who entered the funnel.
- Every step after that splits into sub-columns: how many users reached that step (#), the step-to-step conversion %, how many users dropped off (in count), and the average time it took users to move from the previous step to this one.
Funnel steps view
Switch the view to Funnel steps and each step is drawn as a bar representing its conversion percentage. Hover over any bar to see the exact conversion percentage and the converted-users count for that step.
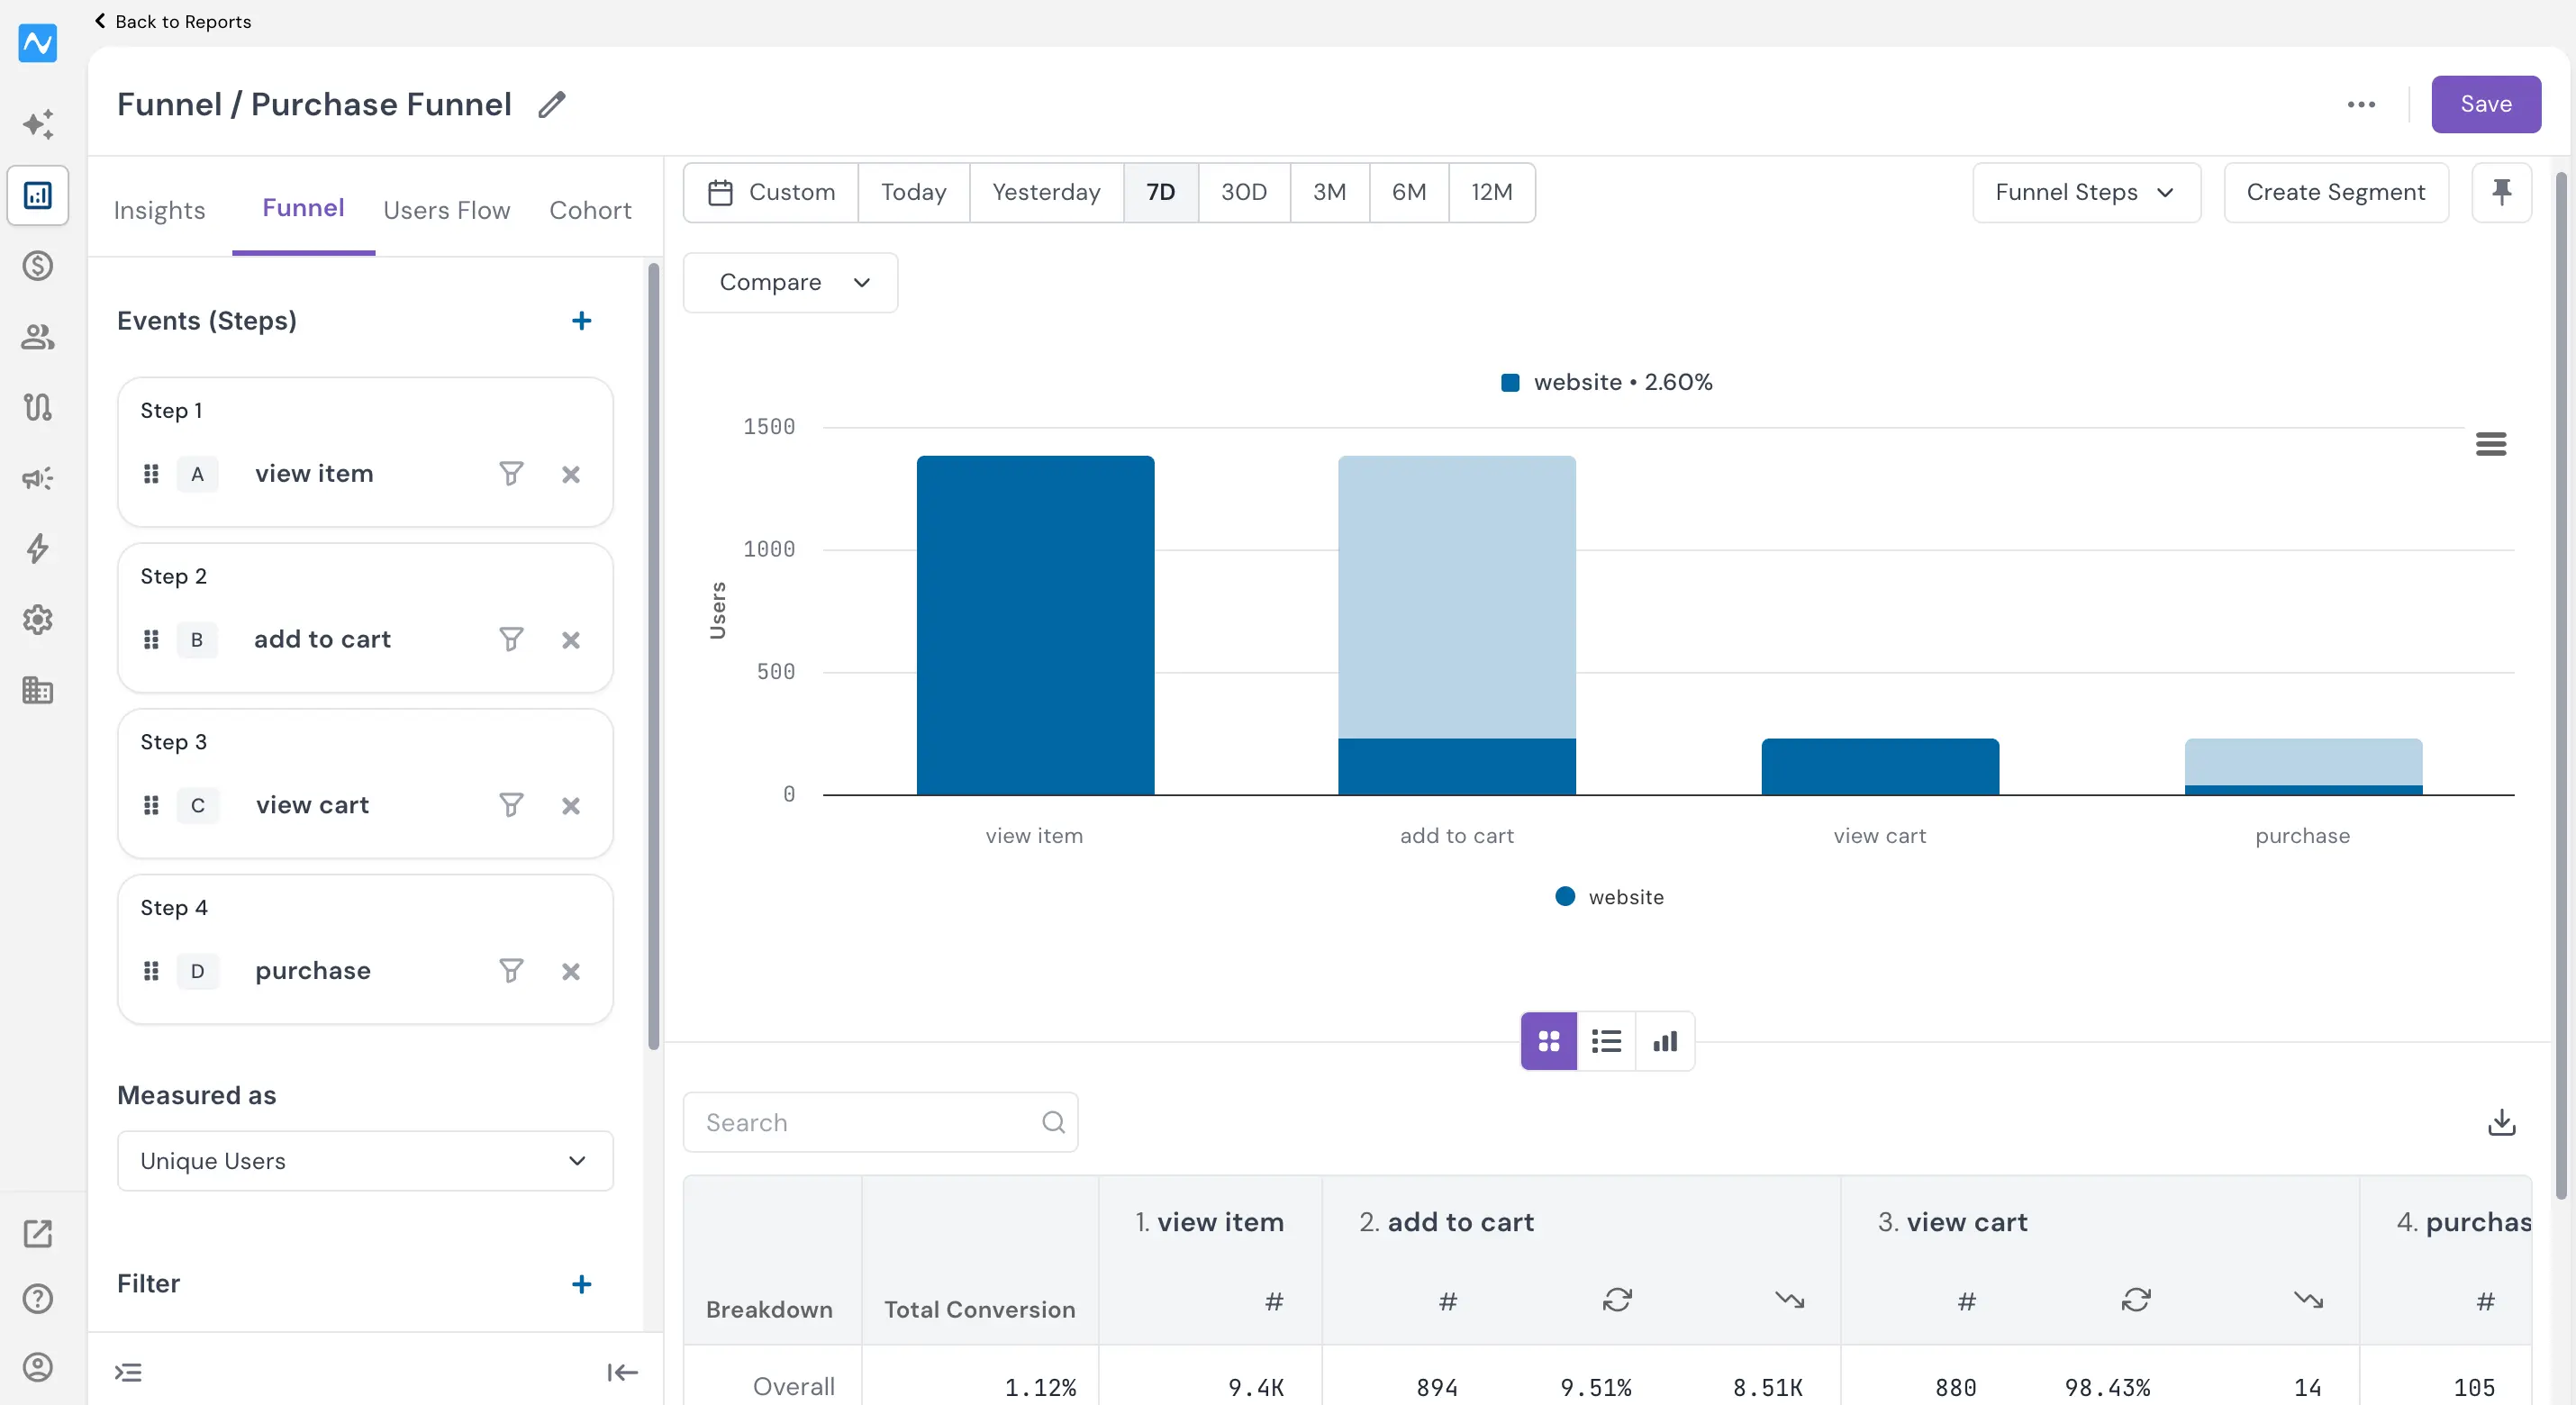
With a breakdown applied
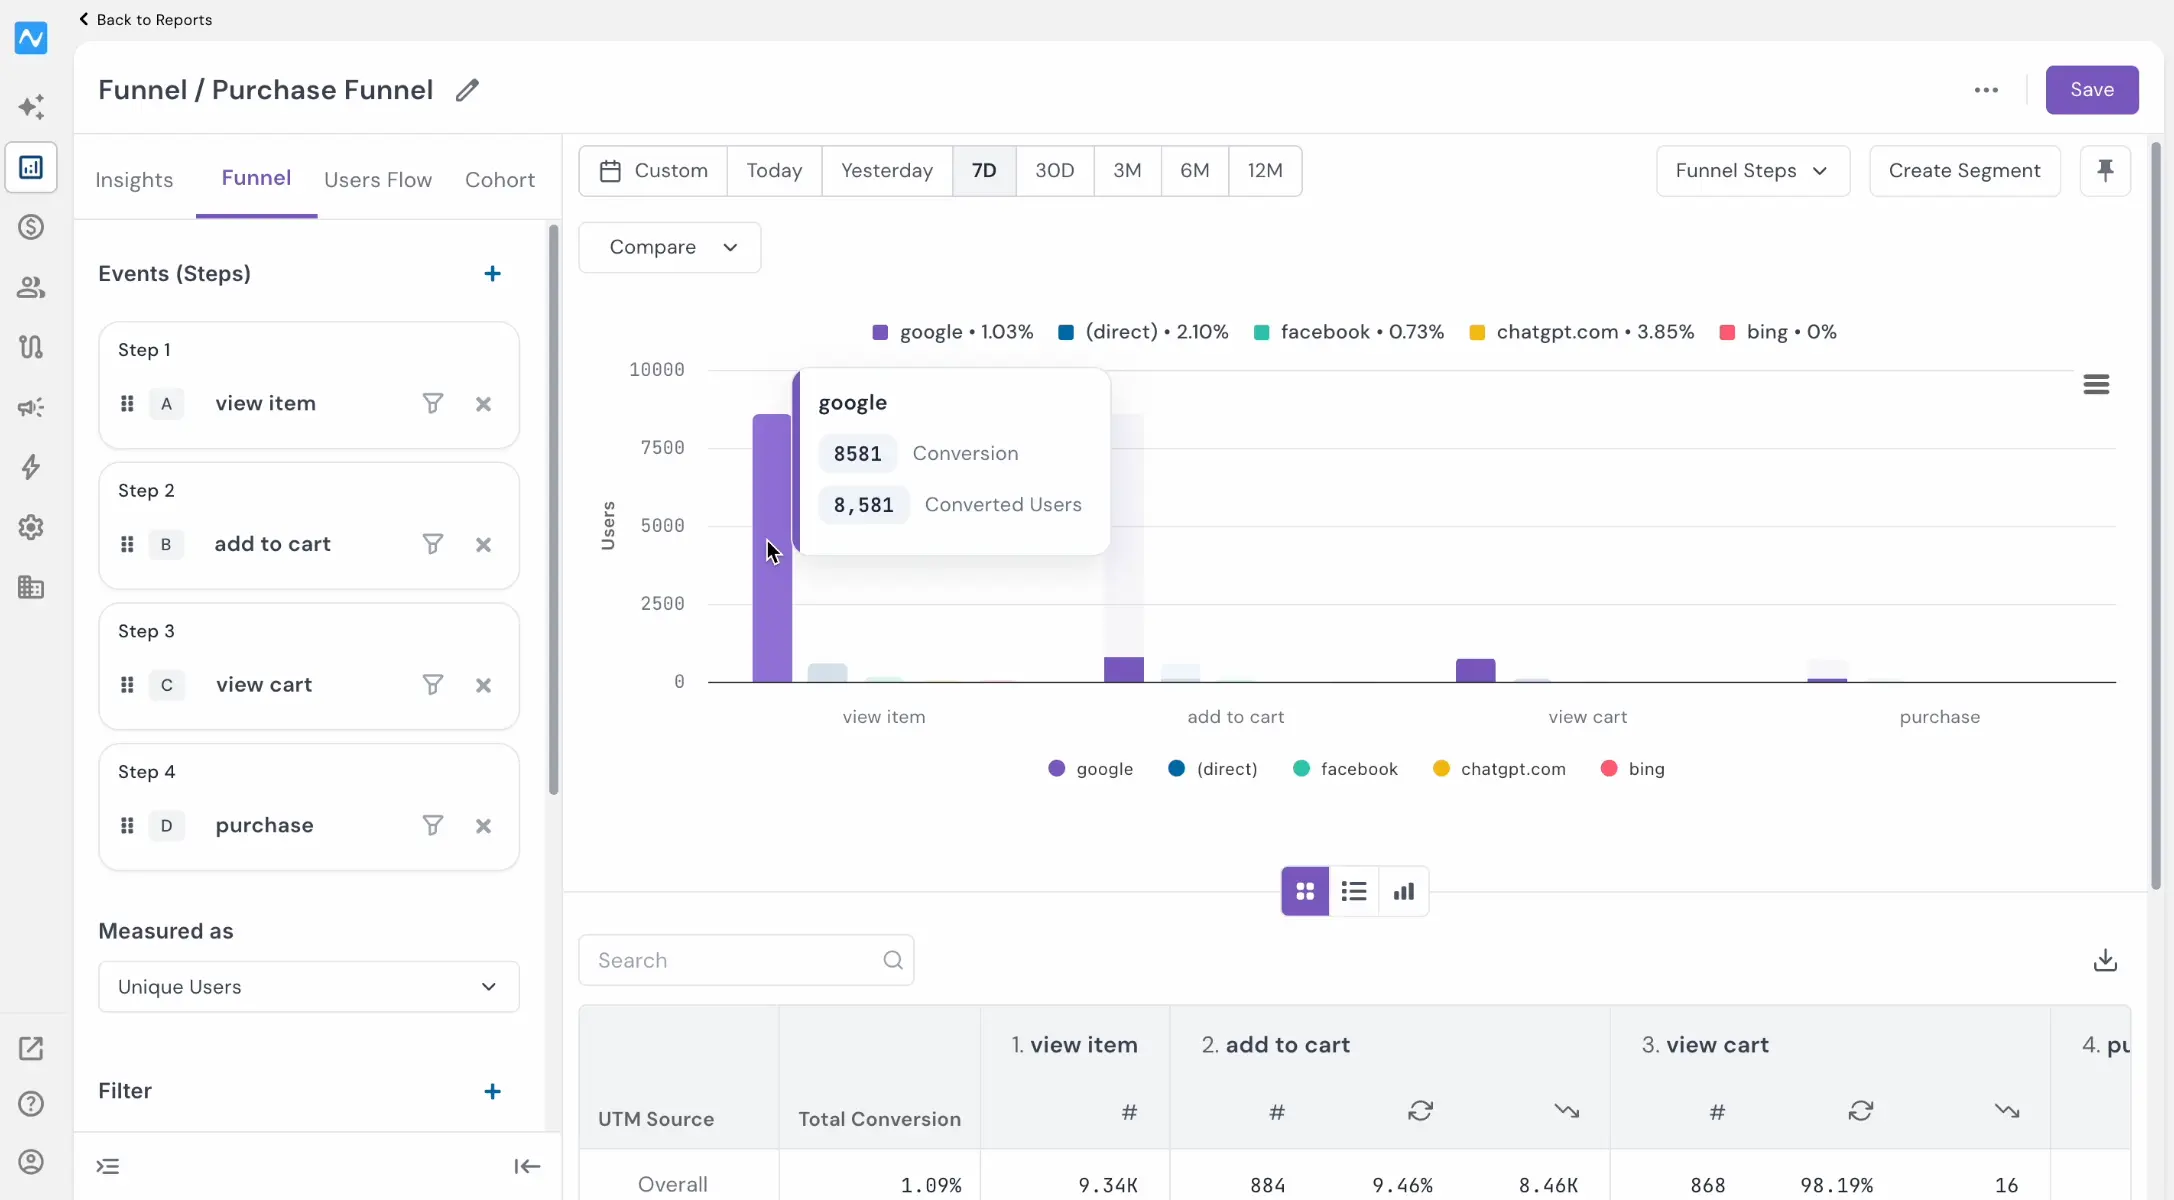
Add a Breakdown (for example, by UTM Source) and the table lists the top 5 attribute values, each with its total conversion plus, at every step, the users who reached it, the conversion %, and the drop-off count, so you can see exactly which sources convert and where they leak.
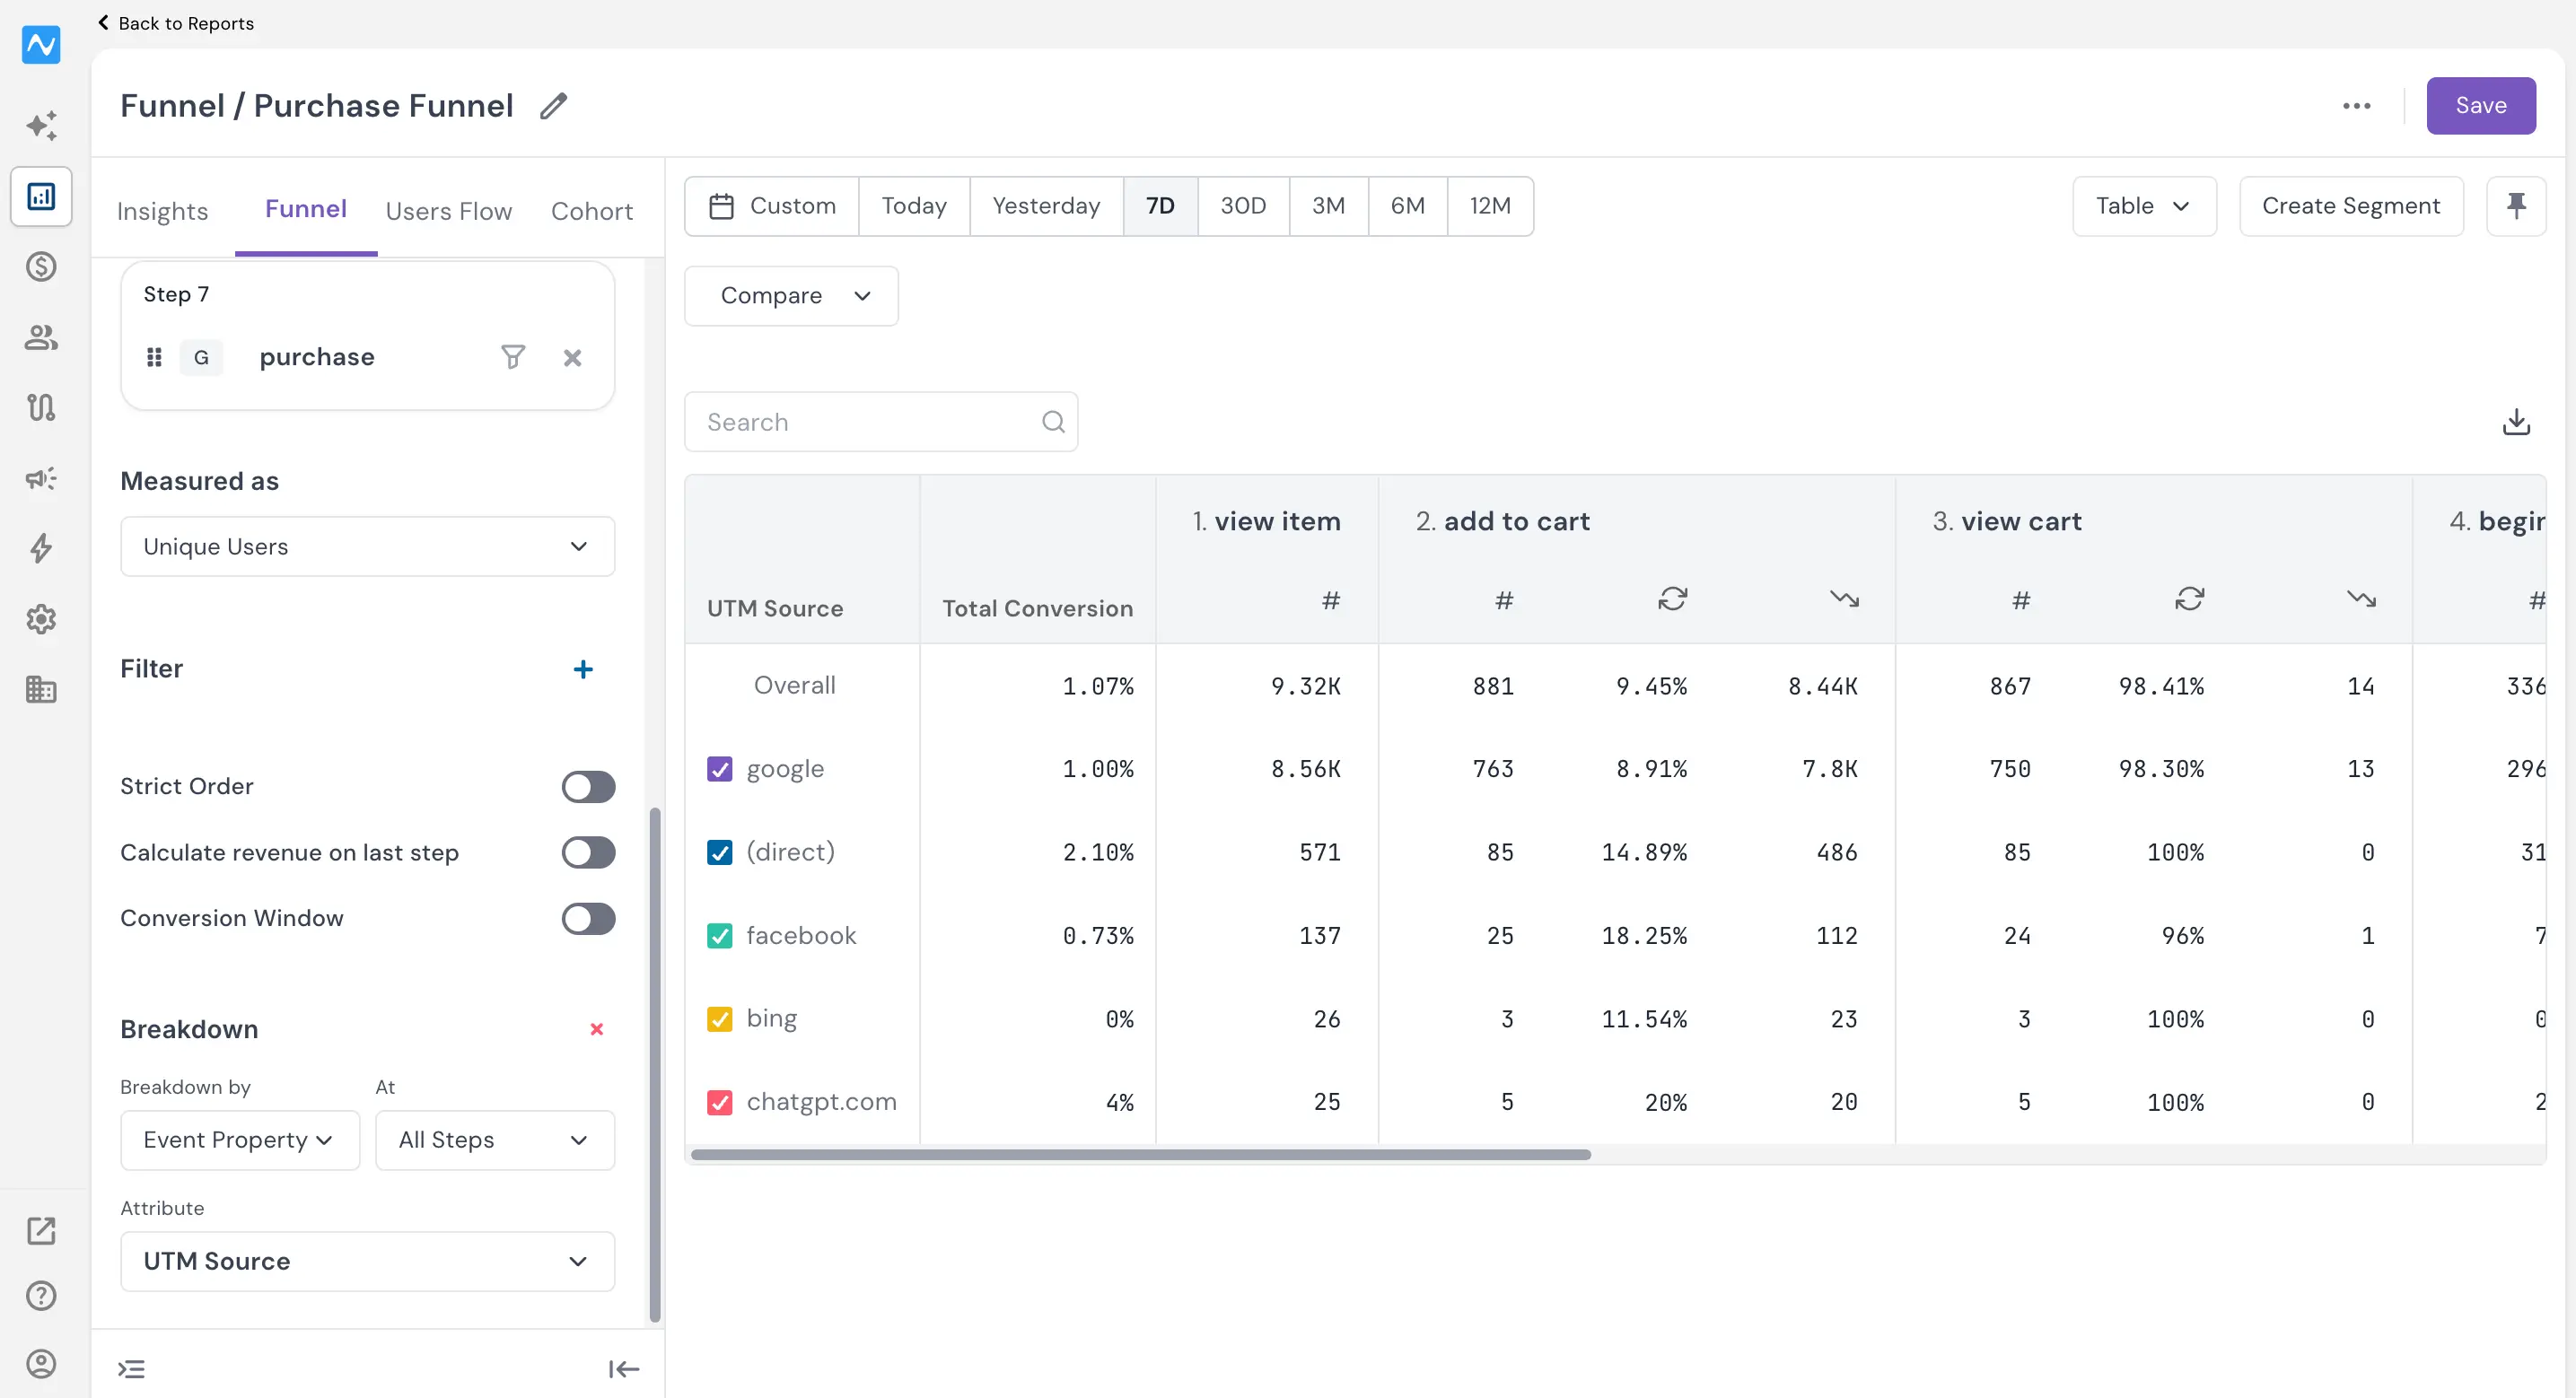
The same breakdown works in Funnel steps view: each attribute gets its own bar per step, and hovering shows that attribute's conversion percentage and total count.
Problem it solves
The old step-by-step table made it hard to see conversion, drop-off, and timing together, and harder still to compare how different sources moved through the funnel. The redesigned layout puts all of those numbers next to each step and extends the same detail to breakdowns, so you can pinpoint exactly where, and for whom, the funnel is losing users.
With entry counts, conversion, drop-off, and time-to-convert in one view, the funnel now tells you not just how many converted, but where and why the rest didn't.