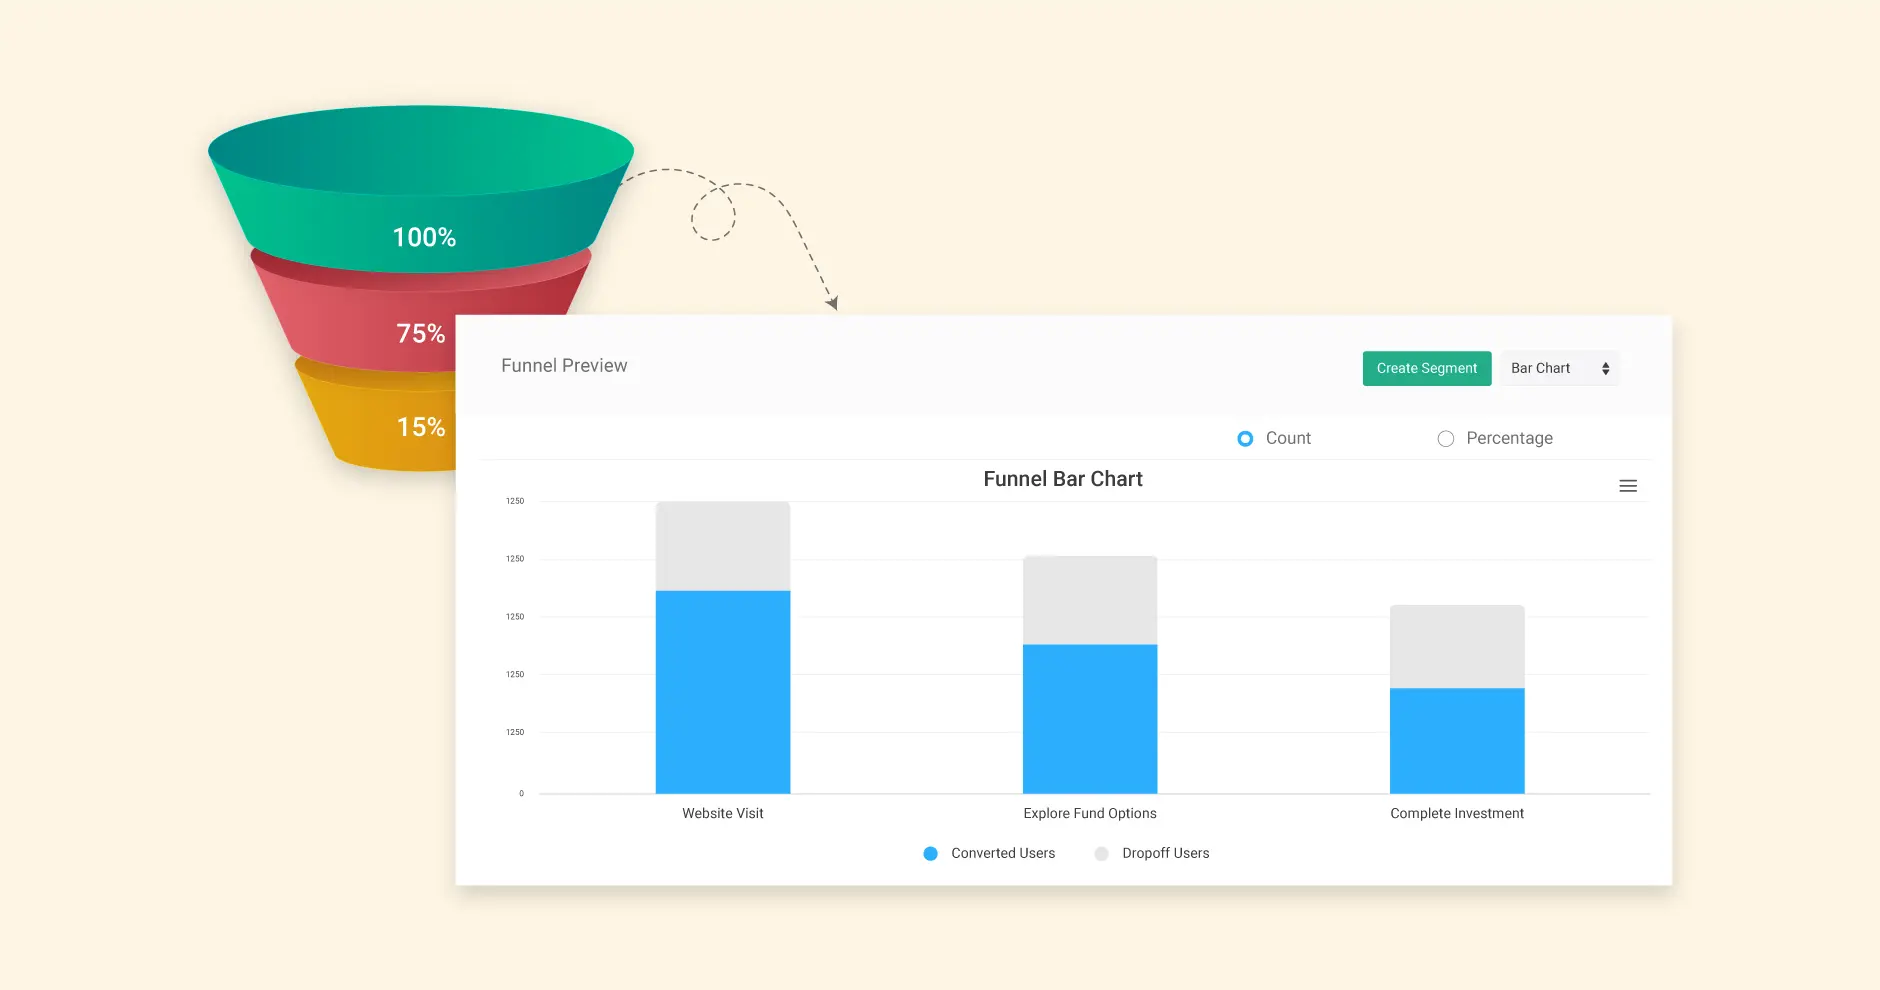
This new feature allows you to easily compare the number of users who either convert or drop off at each stage through bar charts. Presenting funnel data in a bar chart format gives you a quick and easy overview of performance across different stages, making it perfect for analysis and gaining actionable insights.
UpdateOctober 24, 2024
Introducing funnel data in bar chart
Share this post
Was this page useful?