The all-new Insights section gives you the power to compare and analyze multiple events at once, along with different attributes and trend types like total events or unique users. It offers deeper visibility into user behavior, going beyond what the standard event reports section provides.
To get started, navigate to the Analytics panel and click on Insights. Use the Insights list dropdown to create a new report. If it’s your first visit, you’ll see a Create button right away.

You’ll then enter the Edit Insight window. Here, select the date range you want to analyze, choose an event, apply attribute filters if needed, and pick the trend type you’d like to track (e.g., total events, unique users, etc.). To compare multiple events in the same view, click the Add Step button and repeat the process for each additional event.

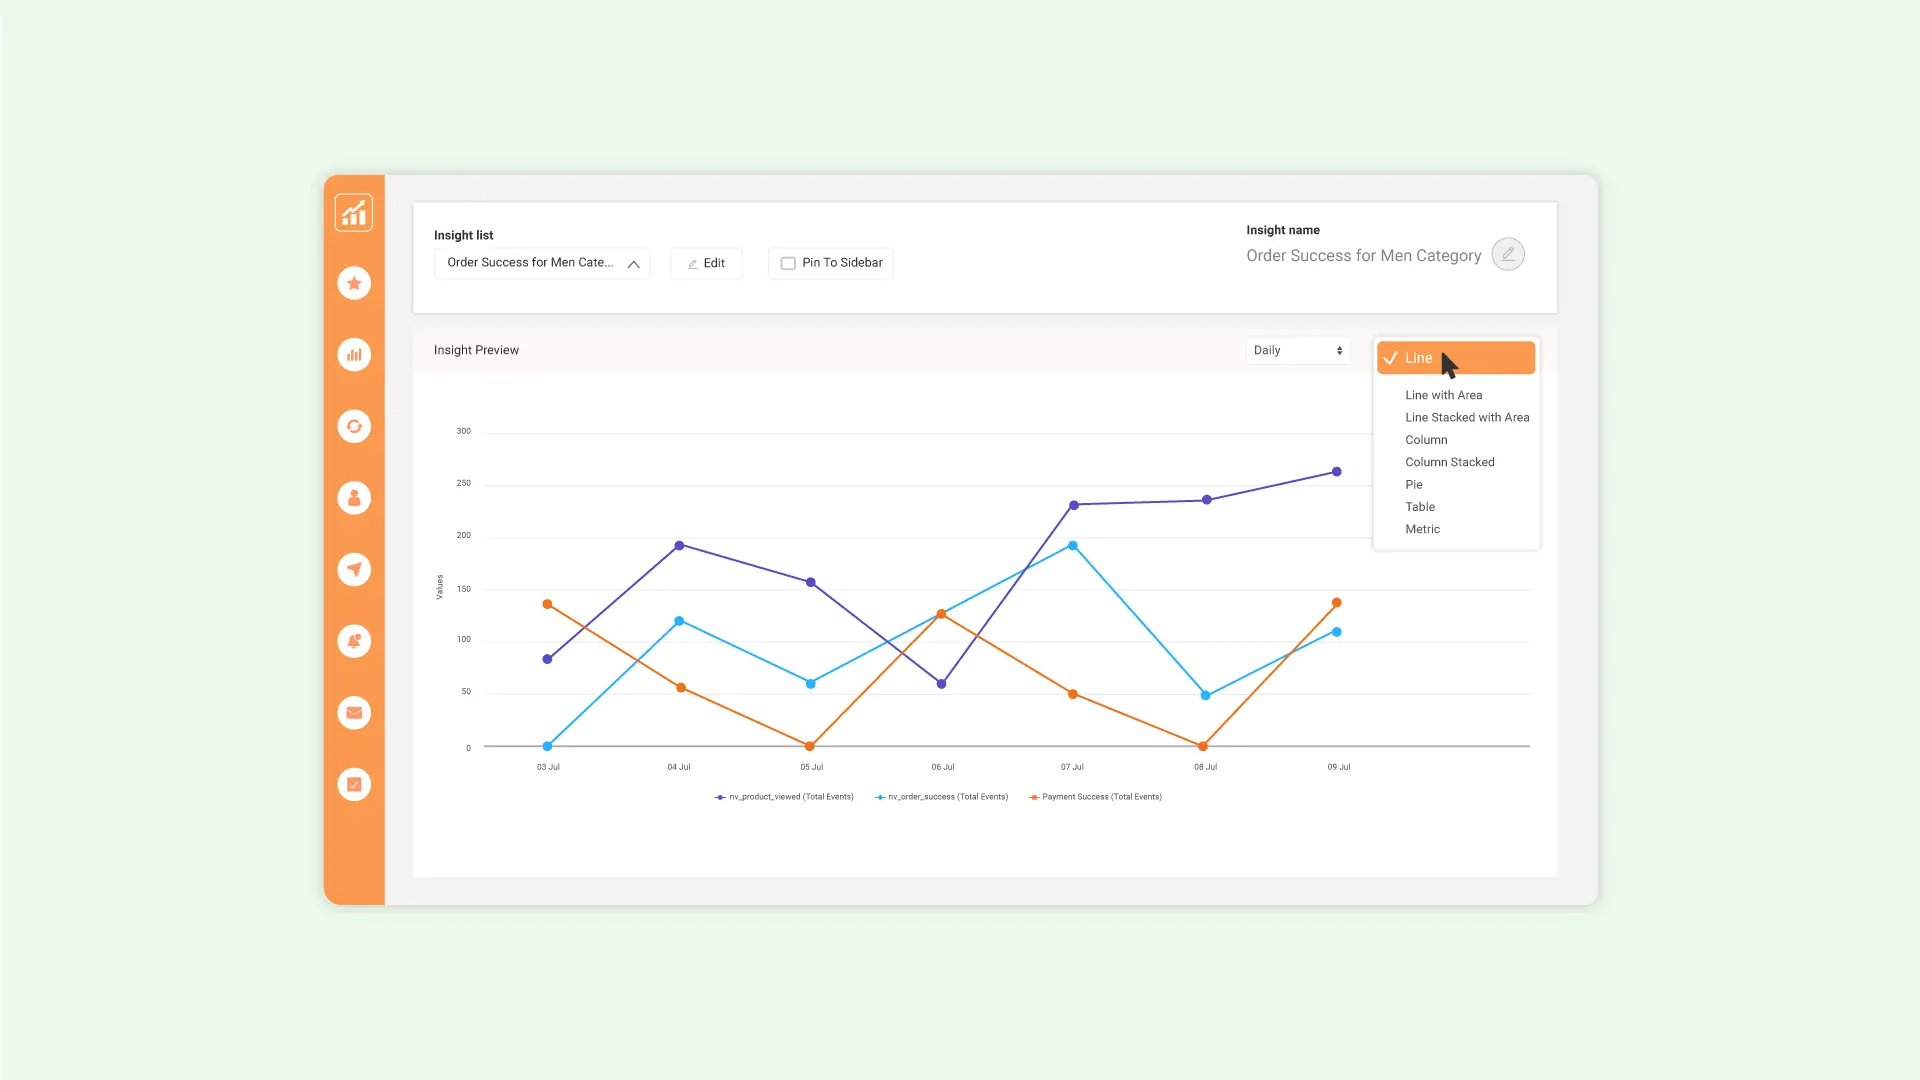
Once your setup is complete, click View Insight Report. A preview section will display your selected events as a graph and a table for easy comparison. From the dropdown at the top right, you can change the chart type. Available options include: Line, Line with Area, Stacked Line, Column, Stacked Column, Pie, Table, and Metric.

Additionally, you can toggle visibility of specific events in the graph by clicking their names at the bottom, ideal for focusing on particular metrics without altering your report.
To save your work, click **Save **button at the top, give your report a name, click Create, and it will appear in the Insights list for future access.
This enhanced Insights section helps you quickly compare key user actions across events, making trend analysis more flexible, visual, and insightful.