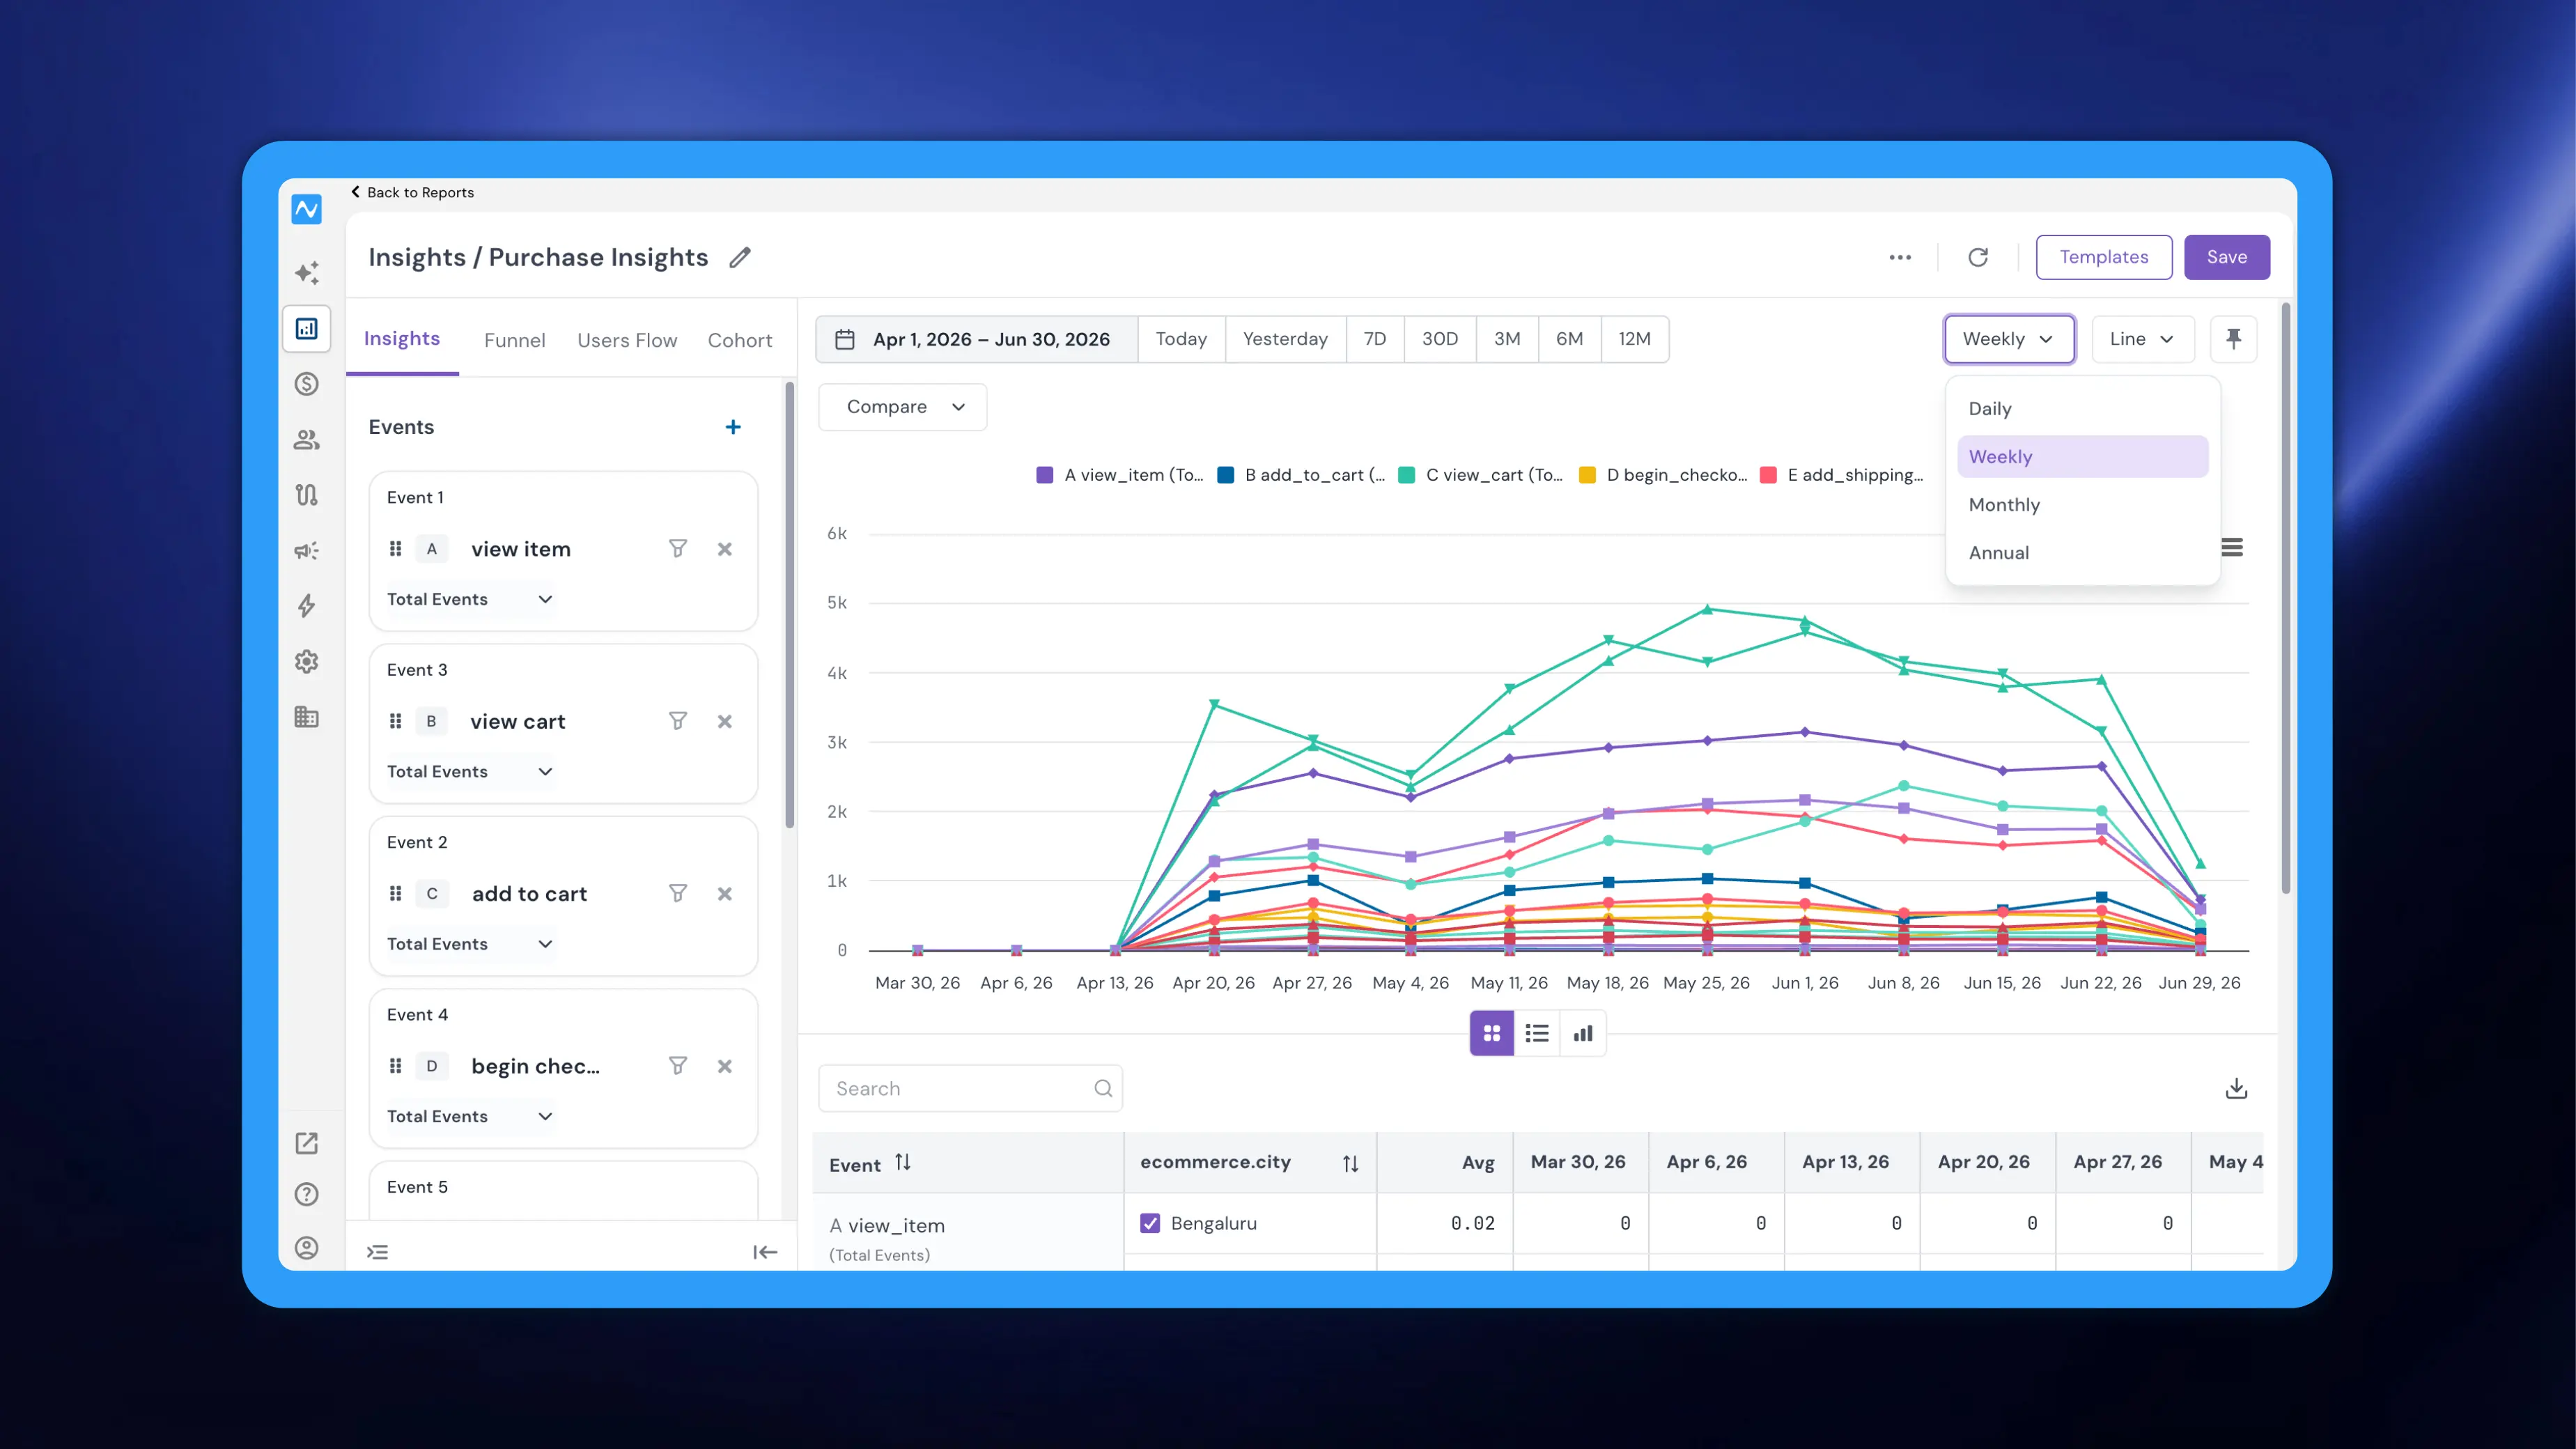
Until now, Insights trends and tables always defaulted to daily granularity, even across a 12-month range. That made large date ranges heavy to load and slowed down processing, including the Ask AI copilot, which had to work through far more data points than the view actually needed. This update fixes that by automatically matching the default time scale to the date range you select, and it introduces hourly data to Insights for the first time.
How it works
When you open or change the date range on an Insights report, NVECTA now picks a sensible default granularity for both the trend graph and the table:
- Under 7 days → Hourly
- 7 to under 45 days → Daily
- 45 days to 6 months → Weekly
- Over 6 months → Monthly
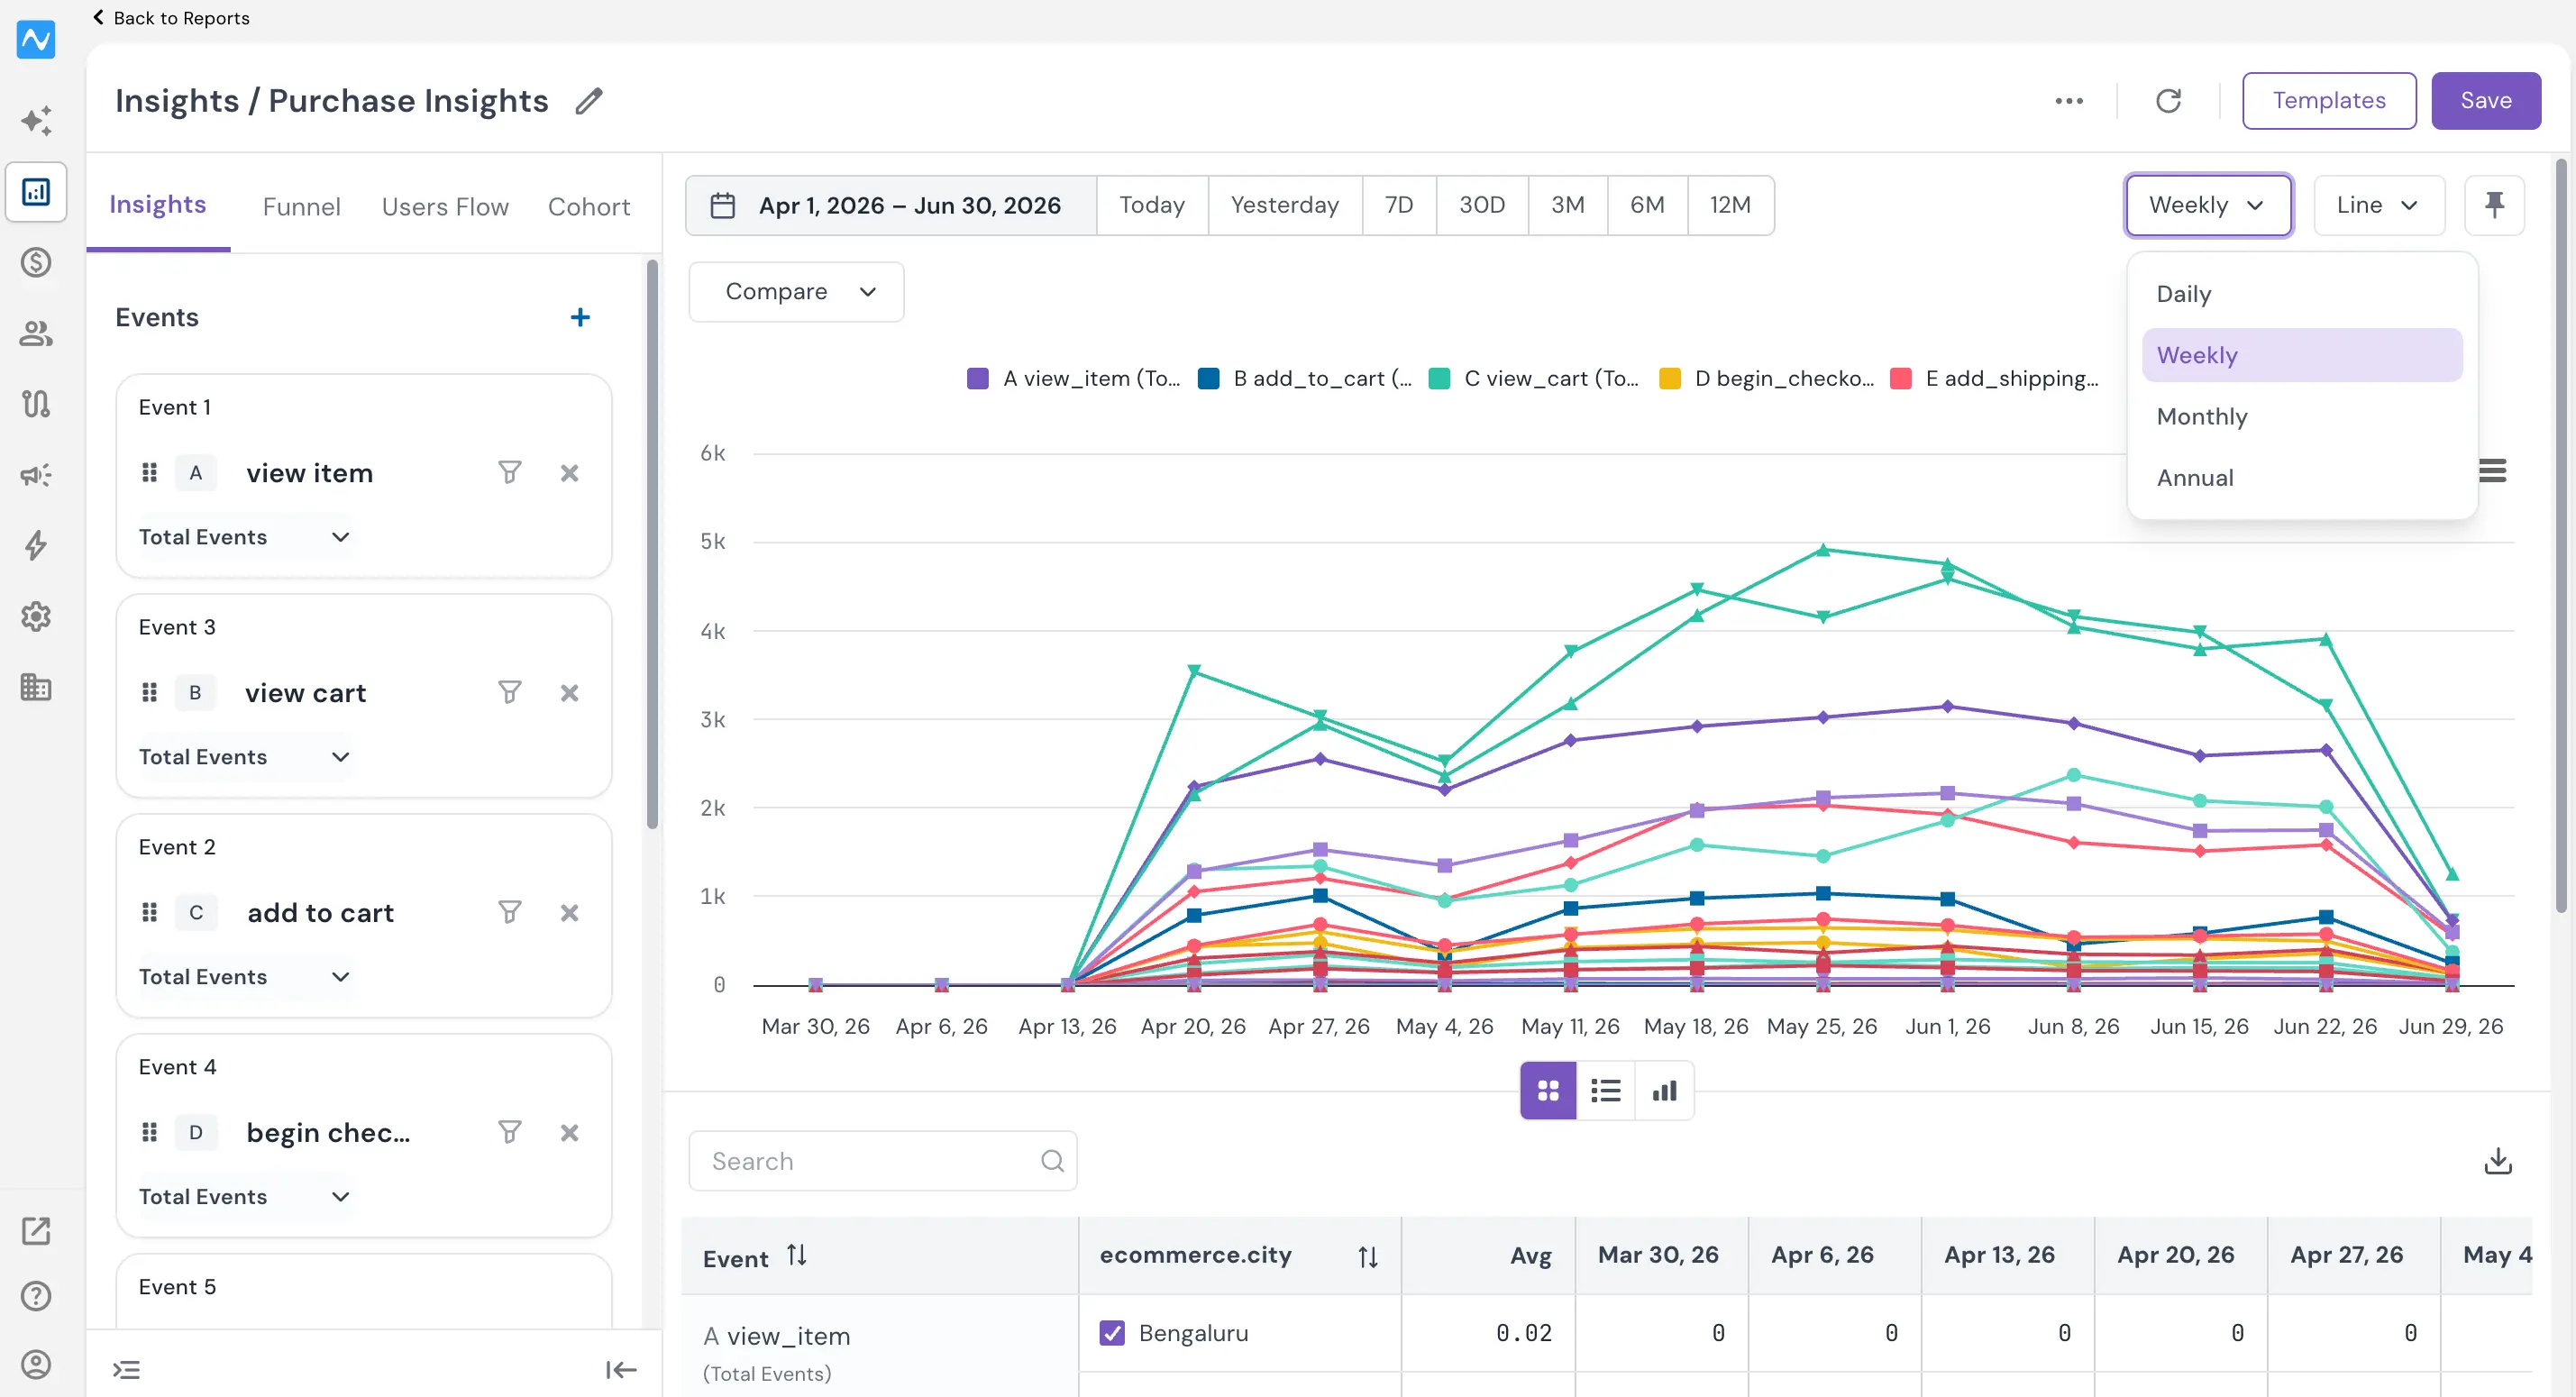
For example, selecting a 3-month range now defaults to Weekly instead of pulling every single day. You stay in full control: to override the default, just use the granularity dropdown in the top-right corner and switch to Hourly, Daily, Weekly, or Monthly as needed.
Problem it solves
A daily-by-default view doesn't scale, a year of daily points is dense, slow to render, and noisy to read, and it made the AI copilot slower to respond because it had to process far more rows than the question required. Matching granularity to the selected range keeps every view fast and readable by default, while the new hourly option lets you zoom right into short windows when you need fine-grained detail. You get quicker charts, lighter tables, and faster AI answers, without giving up the ability to change the time scale whenever you want.