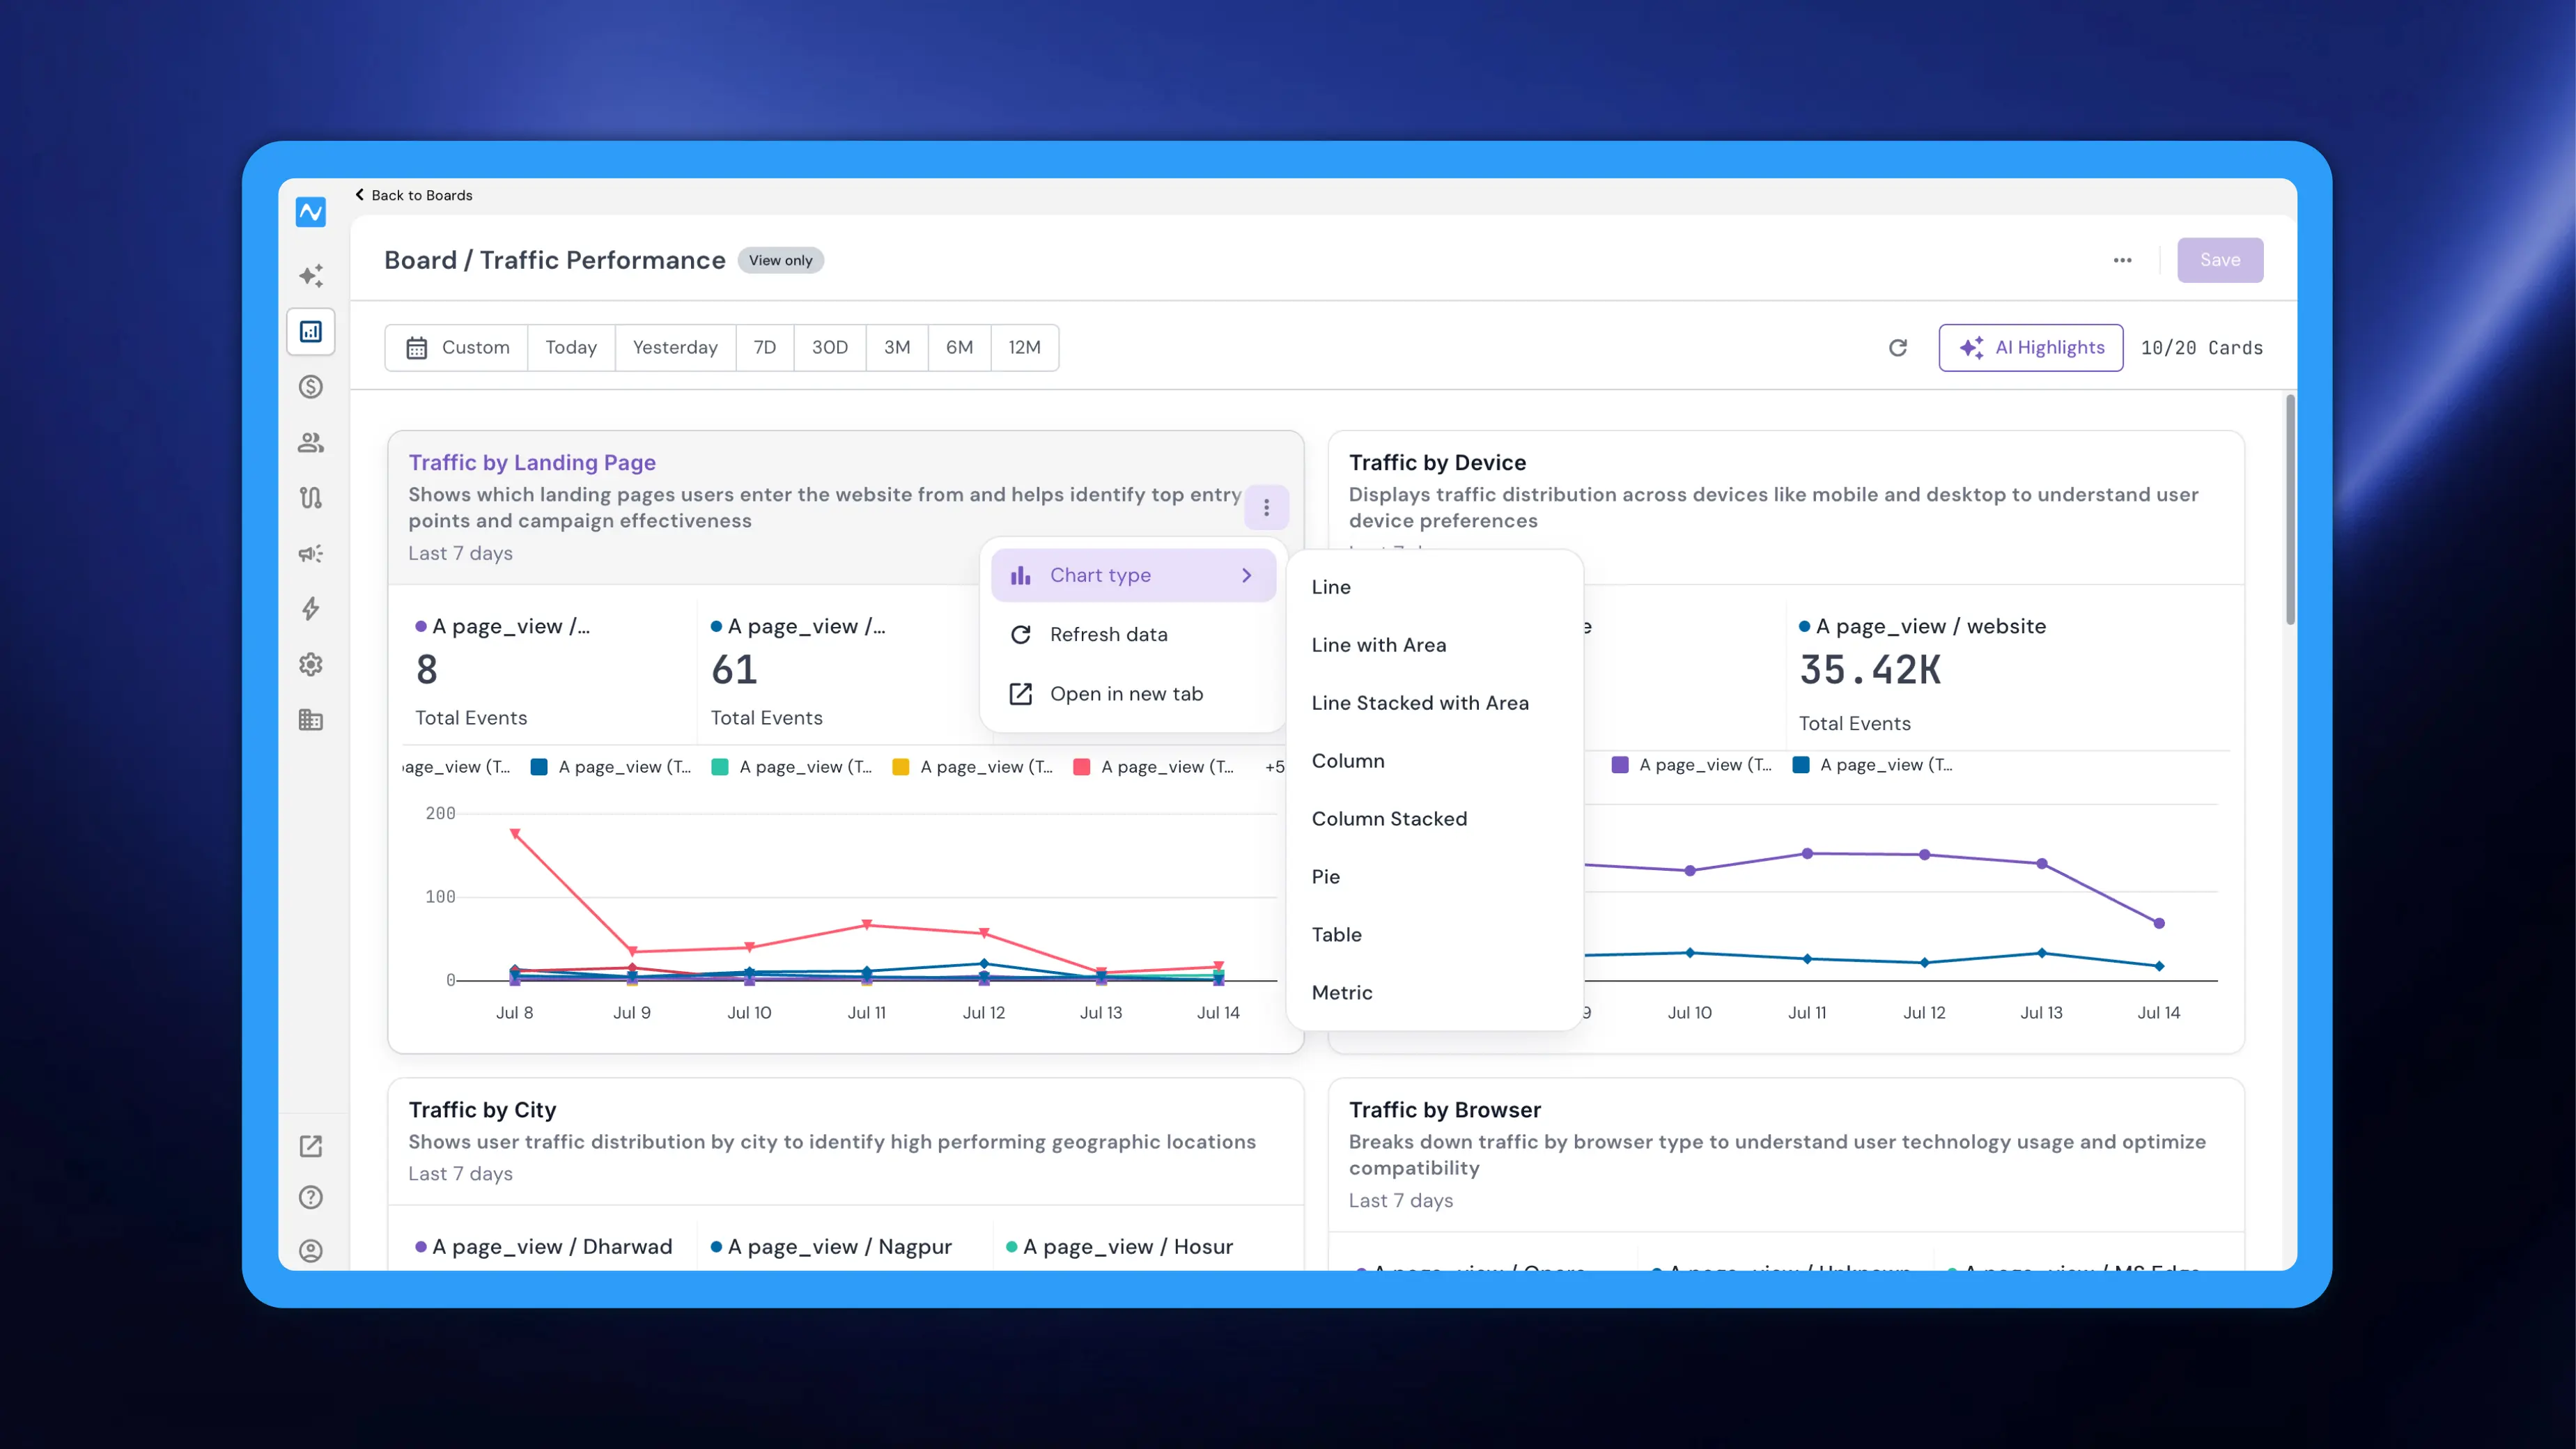
This month we've updated the Boards UI to align with the newer Insights reports experience, giving analytics one consistent look across the product. All your existing boards and any new ones you create will automatically appear in this refreshed interface, with no migration or setup needed on your end.
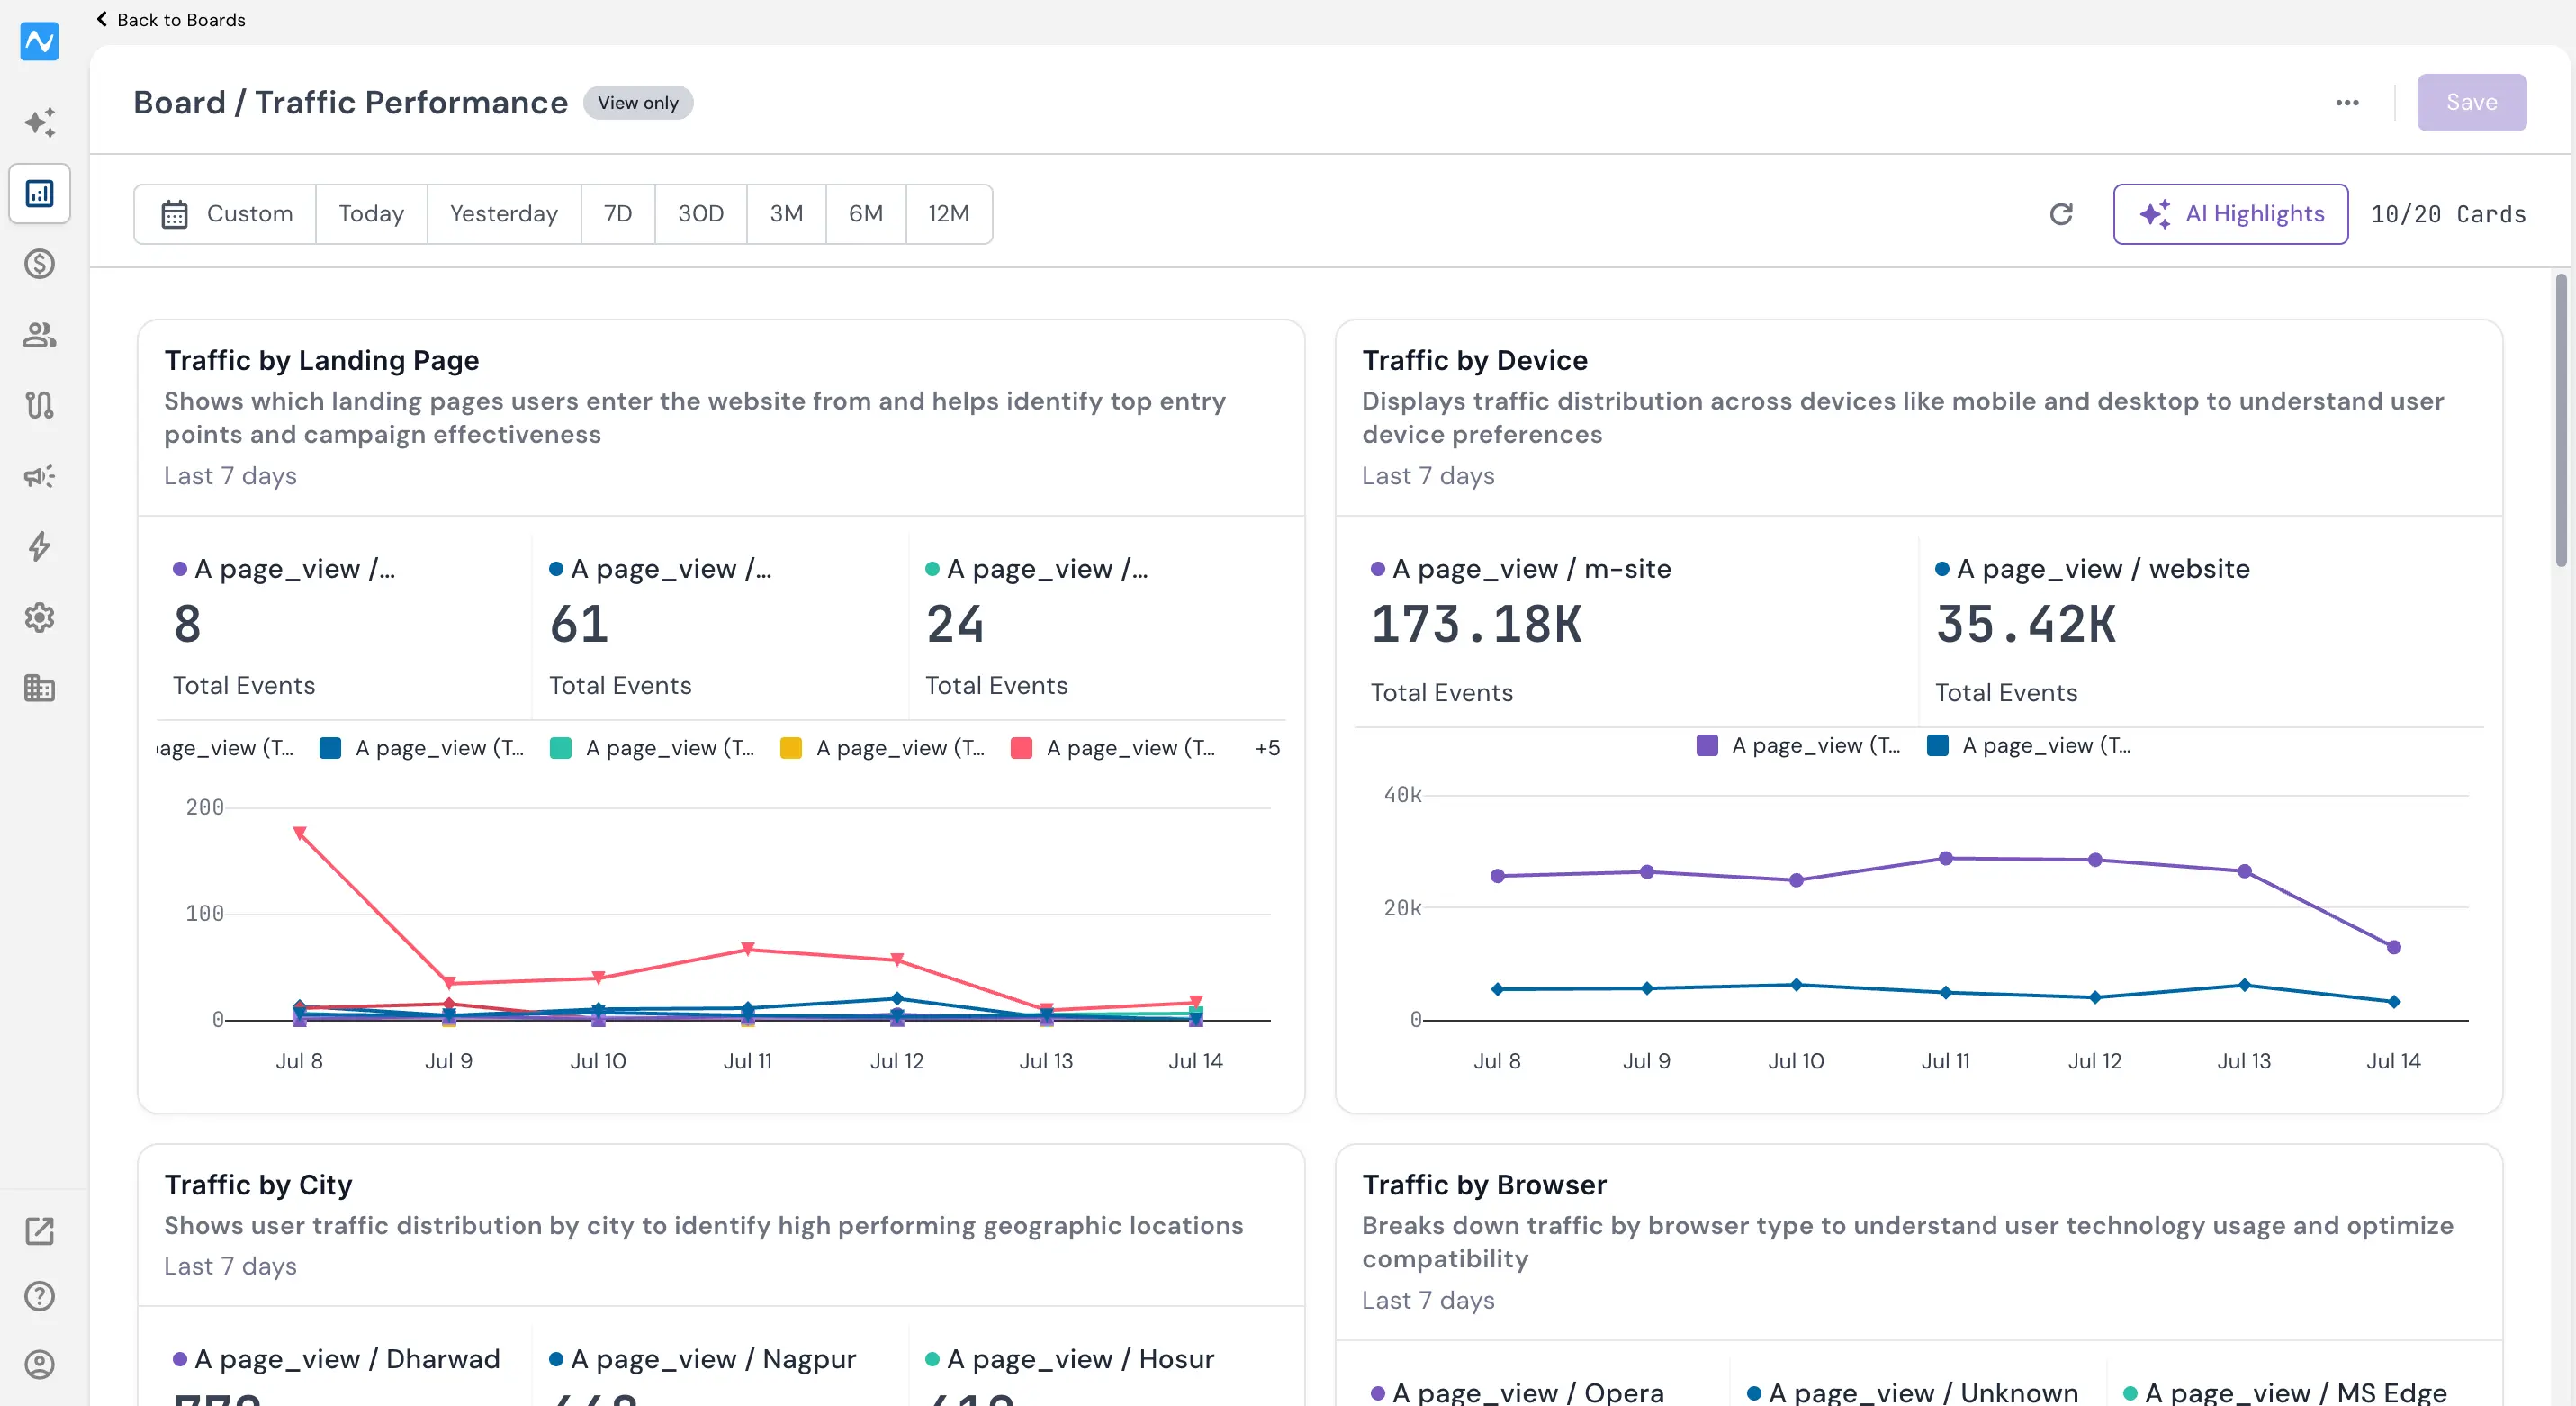
What's new
The layout and all the features you already rely on remain exactly the same, so there's nothing to relearn. The one addition worth calling out: you can now change a card's chart type directly from the board. Click the three-dot (⋯) menu on any card and open Chart type to switch between Line, Line with Area, Line Stacked with Area, Column, Column Stacked, Pie, Table, and Metric, without opening the report to edit it.
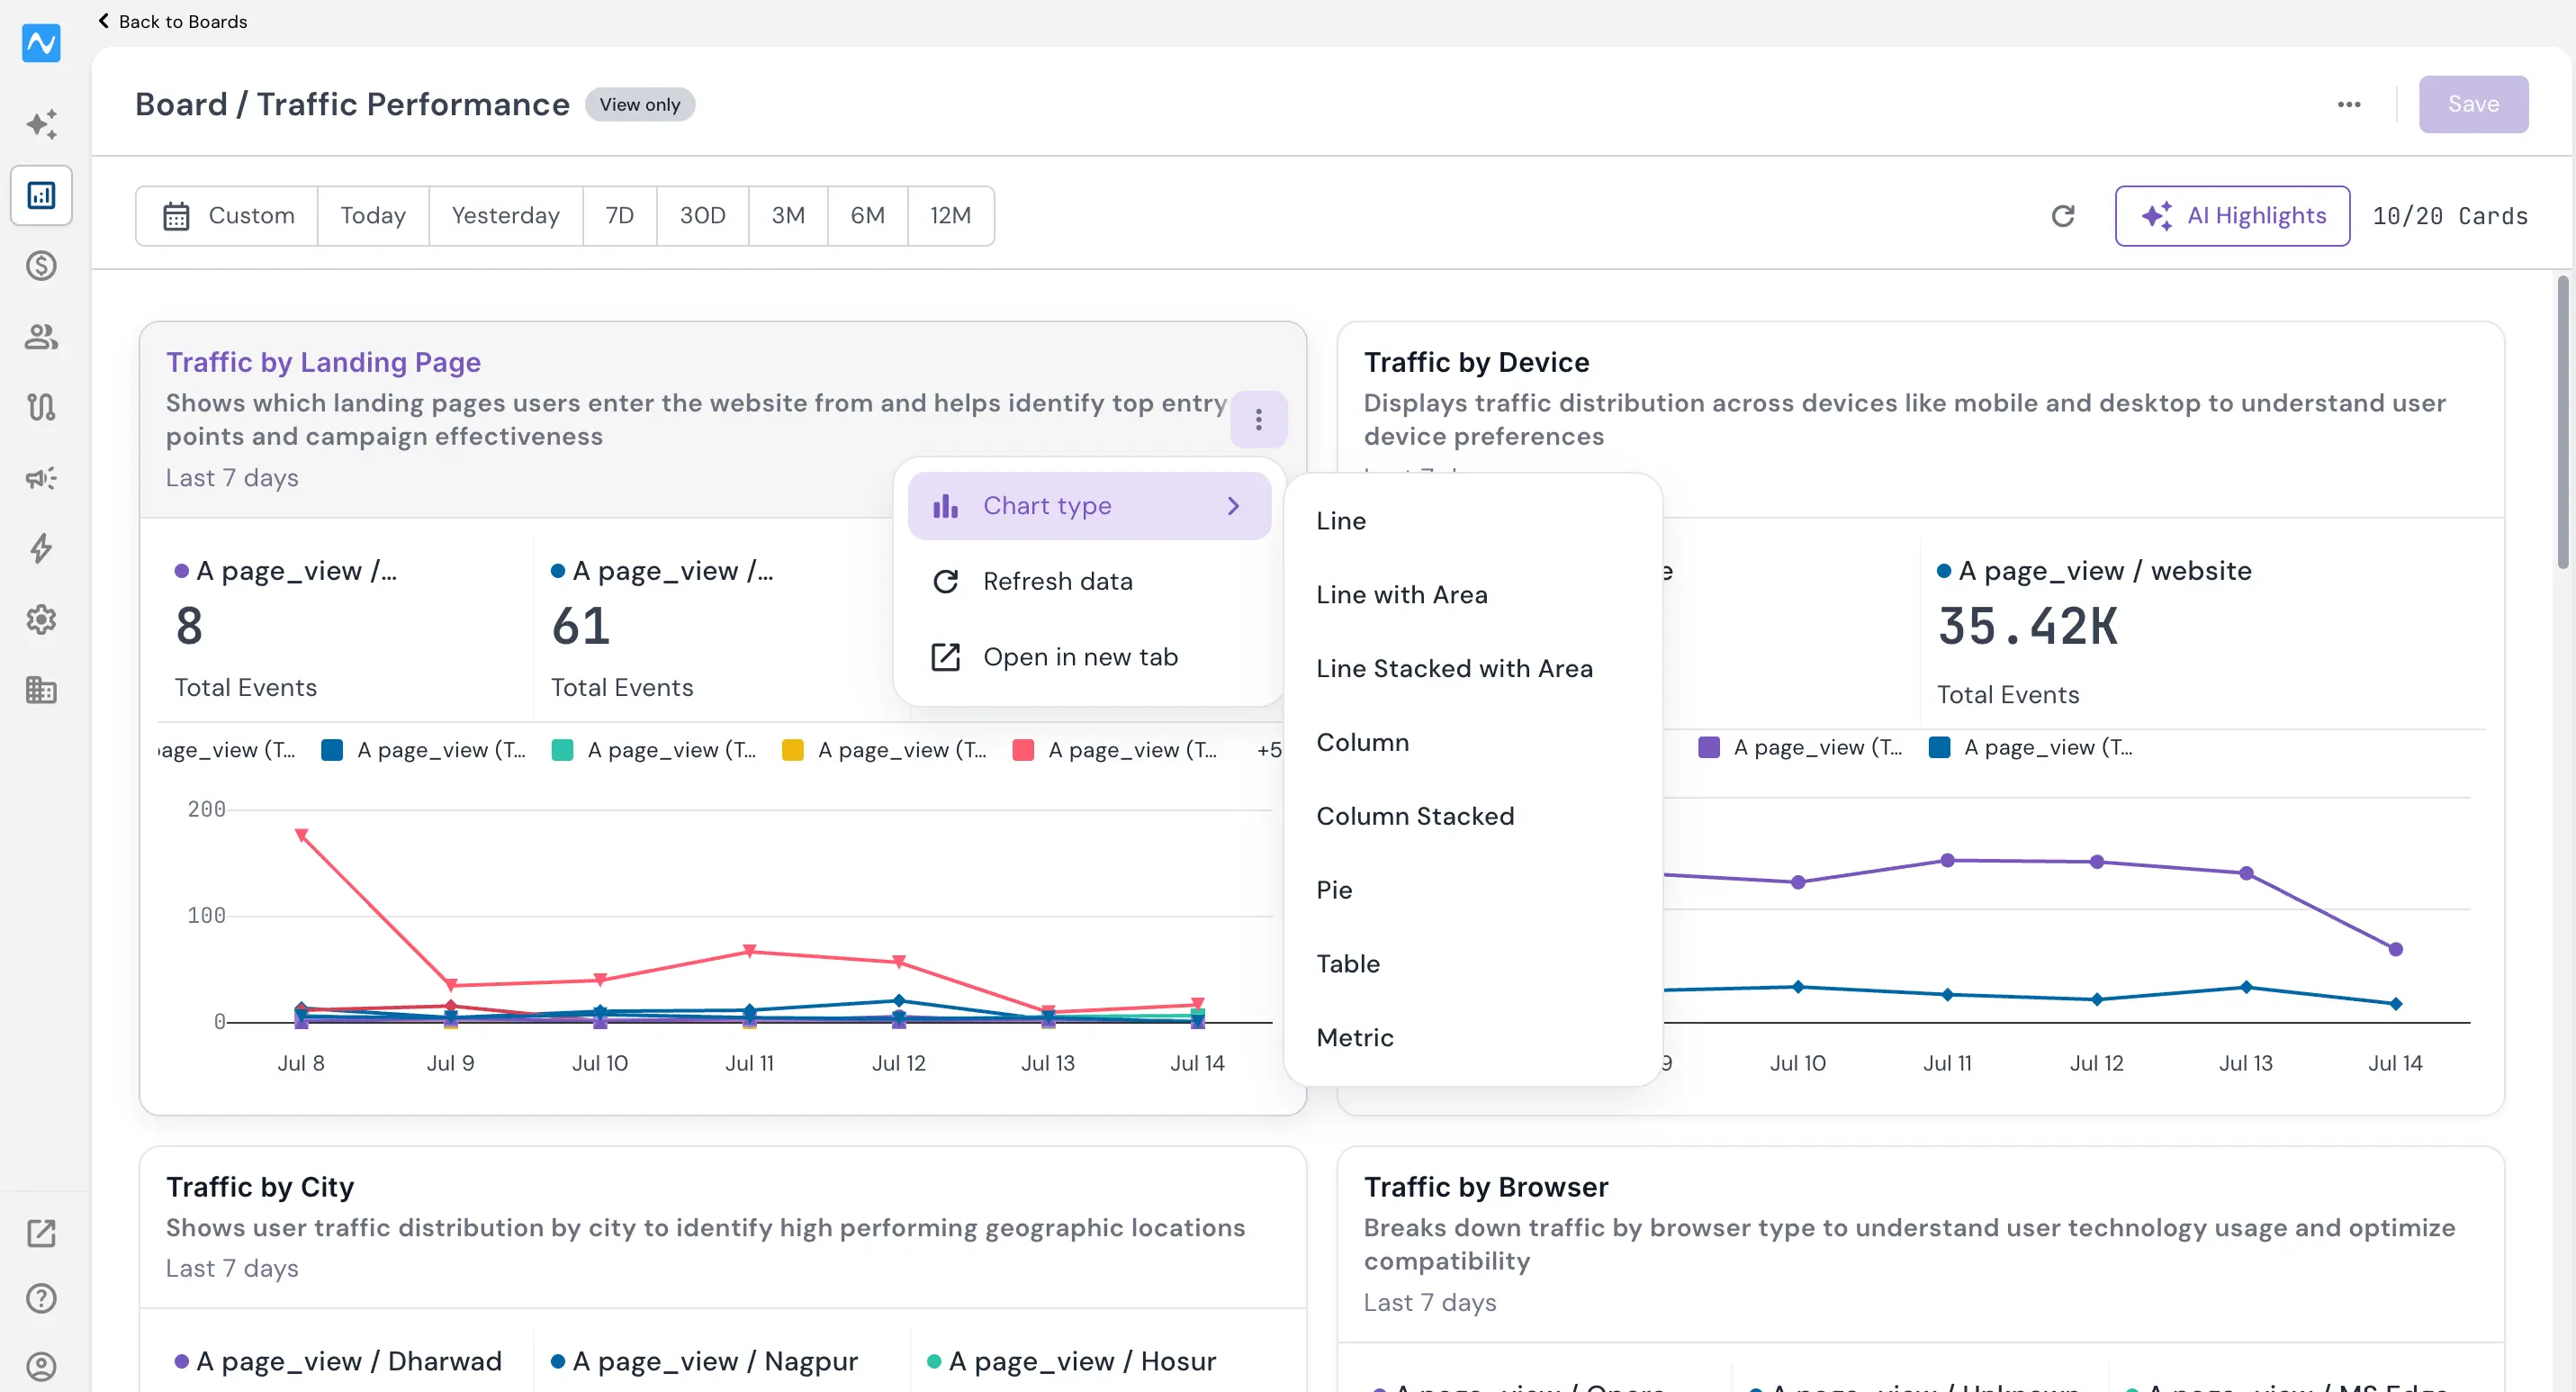
With a consistent interface and inline chart-type switching, boards are now quicker to read, tweak, and keep tidy.