Previously, running multi-event analysis, such as insights, funnels, user flows, and cohorts, meant navigating between separate sections of the platform. This scattered workflow made it harder to compare perspectives on the same set of events and slowed down the analysis loop.
NVECTA now introduces an all-new Reports section that brings every multi-event analysis report under a single roof, making it faster to build, manage, and switch between report types without losing context.
Where to find it
Go to Analytics → Reports. You'll see a centralised list of all your saved reports, along with the last-updated date, report type, and a three-dot action menu with options to Edit, Duplicate, or Delete each report.
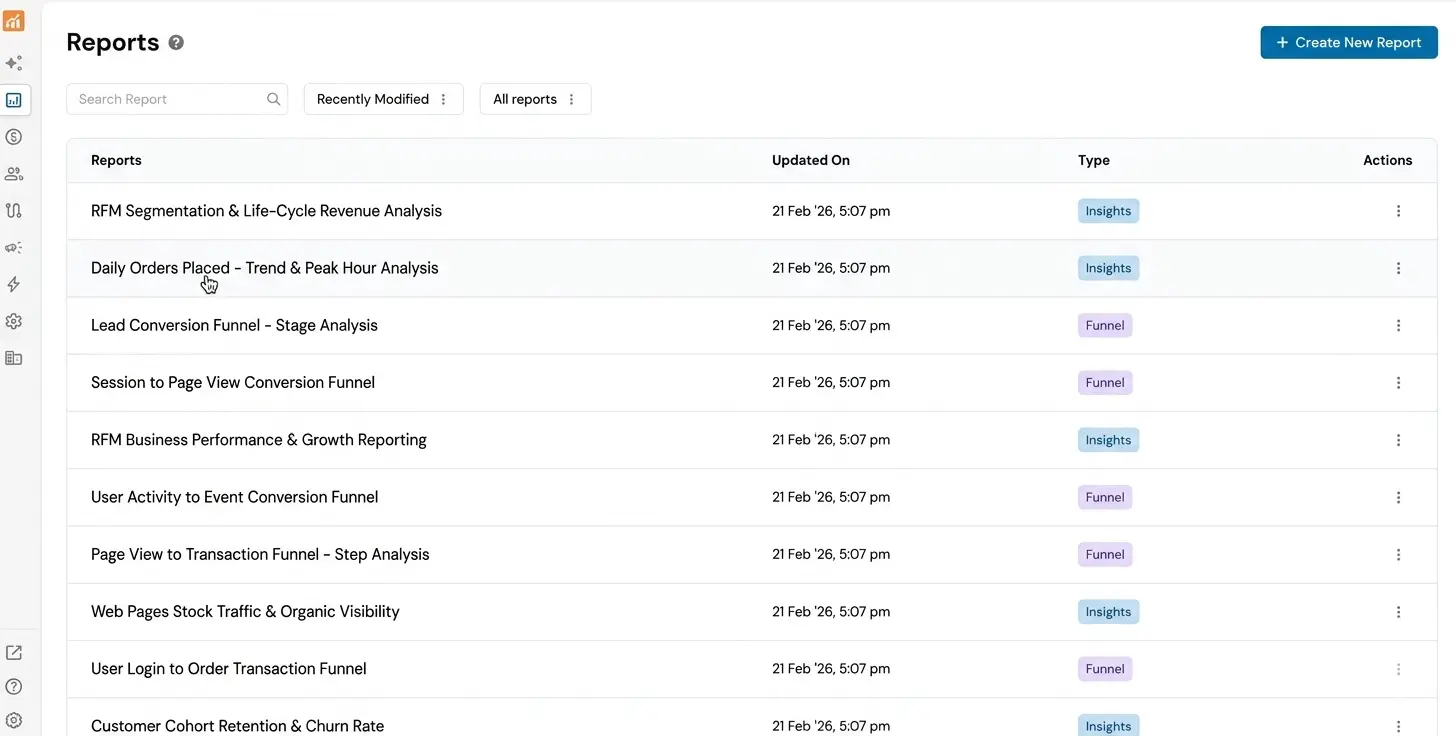
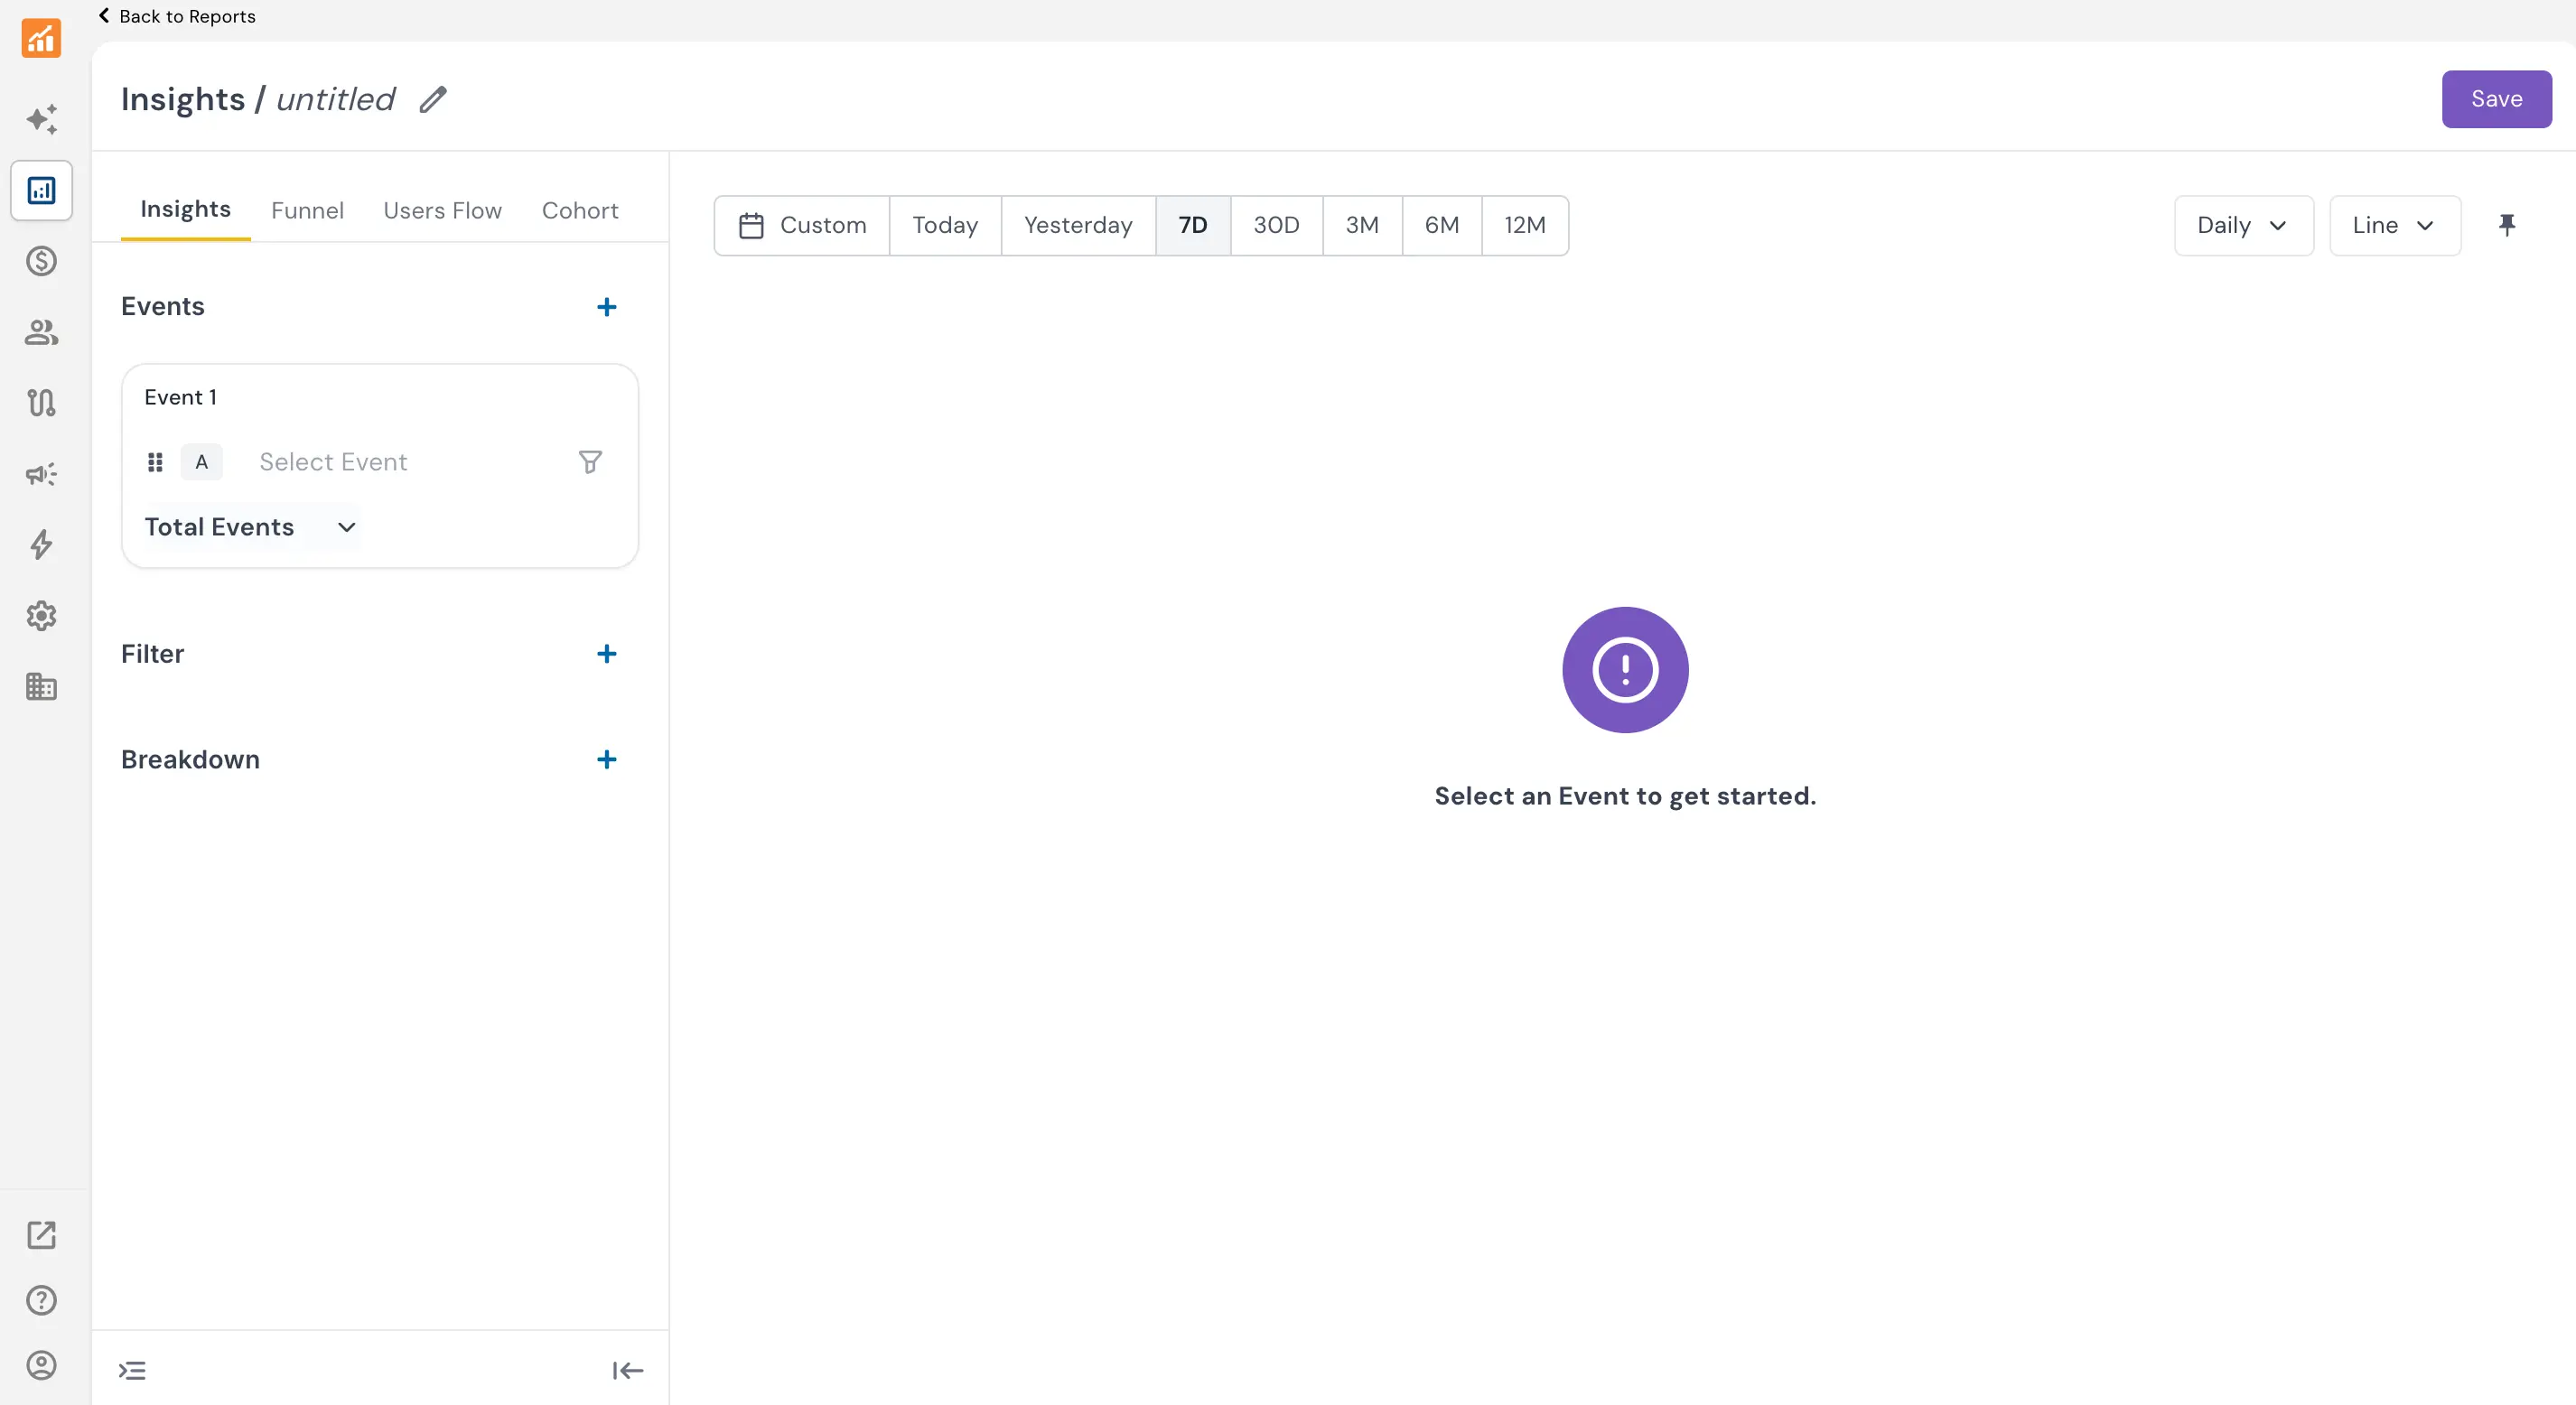
To create a new report, click Create New Report and choose your preferred report type: Insights, Funnel, Users Flow, or Cohort.
How it works
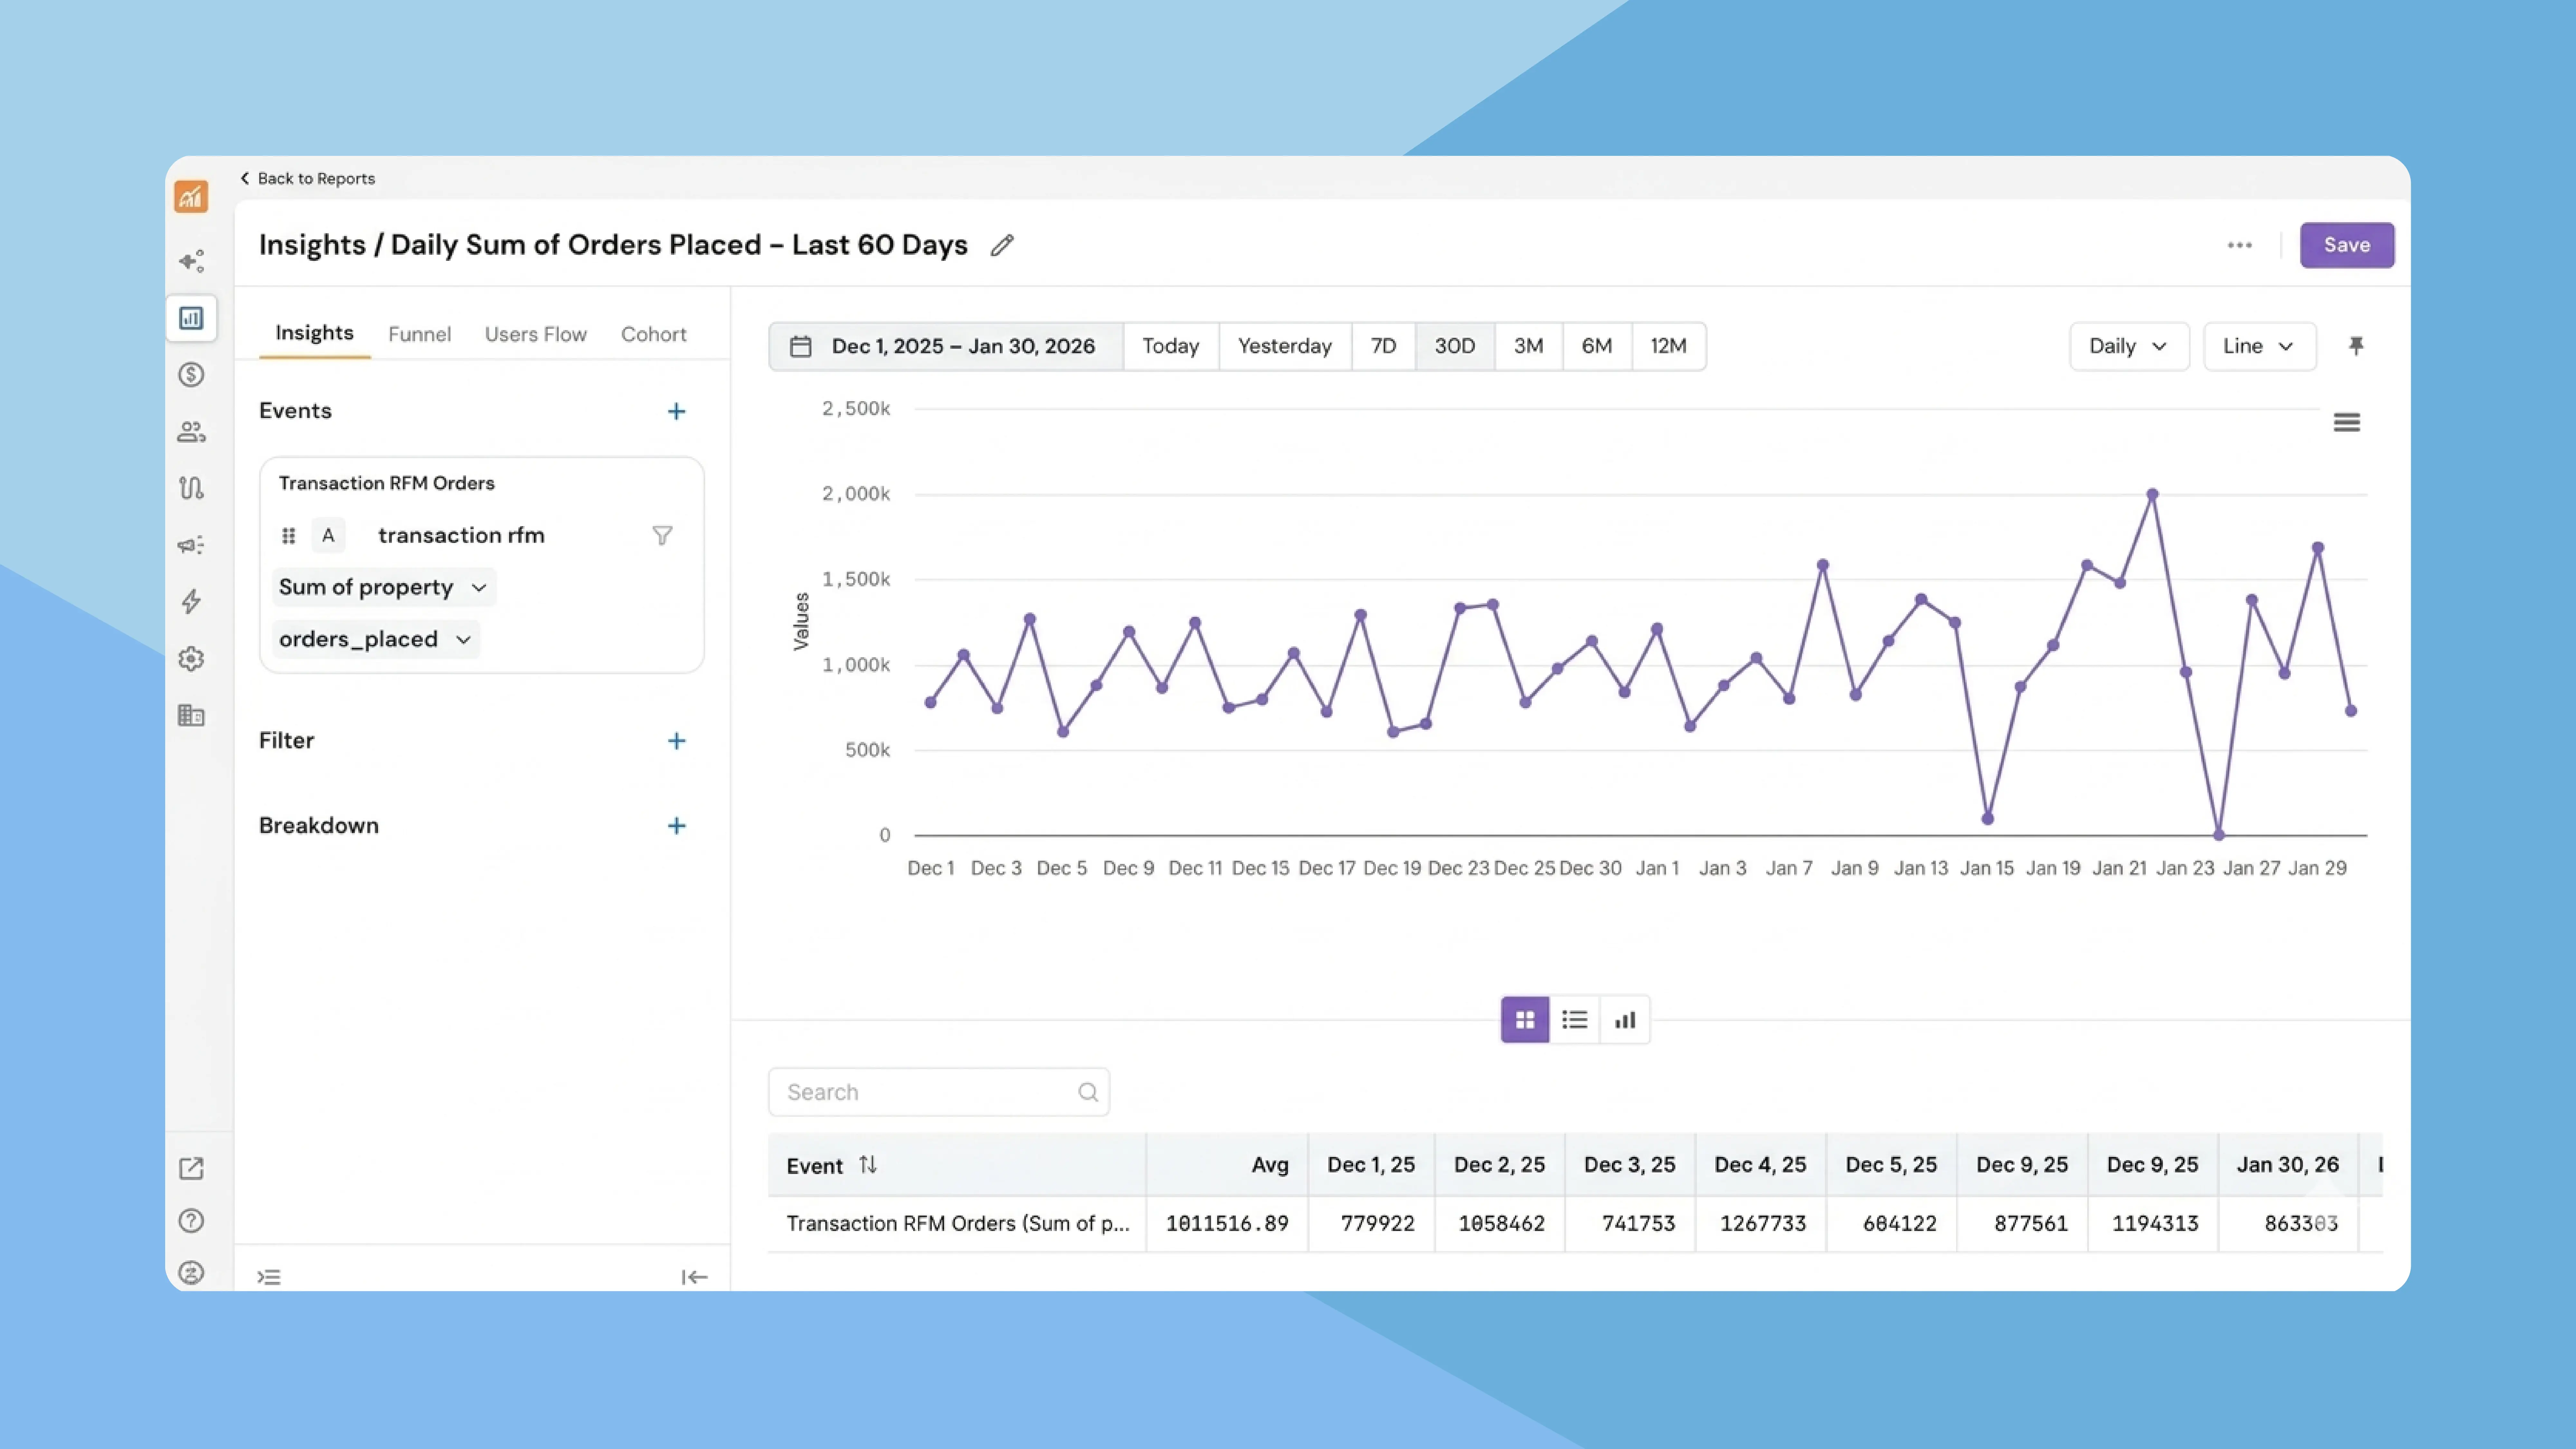
Once you select a report type, a left-side panel lets you define your events, filters, breakdown, and more. Click Apply to generate the report. You can also resize this panel, move it to the right, or collapse it entirely to maximise chart space.
The key advantage of this unified layout is seamless switching between report types. After configuring your events and filters for one report, simply click a different report tab — Insights, Funnel, Users Flow, or Cohort — and NVECTA carries forward the same events and settings. This means you can go from viewing a trend line in Insights to analysing drop-offs in a Funnel to tracking retention in a Cohort, all without reconfiguring anything.
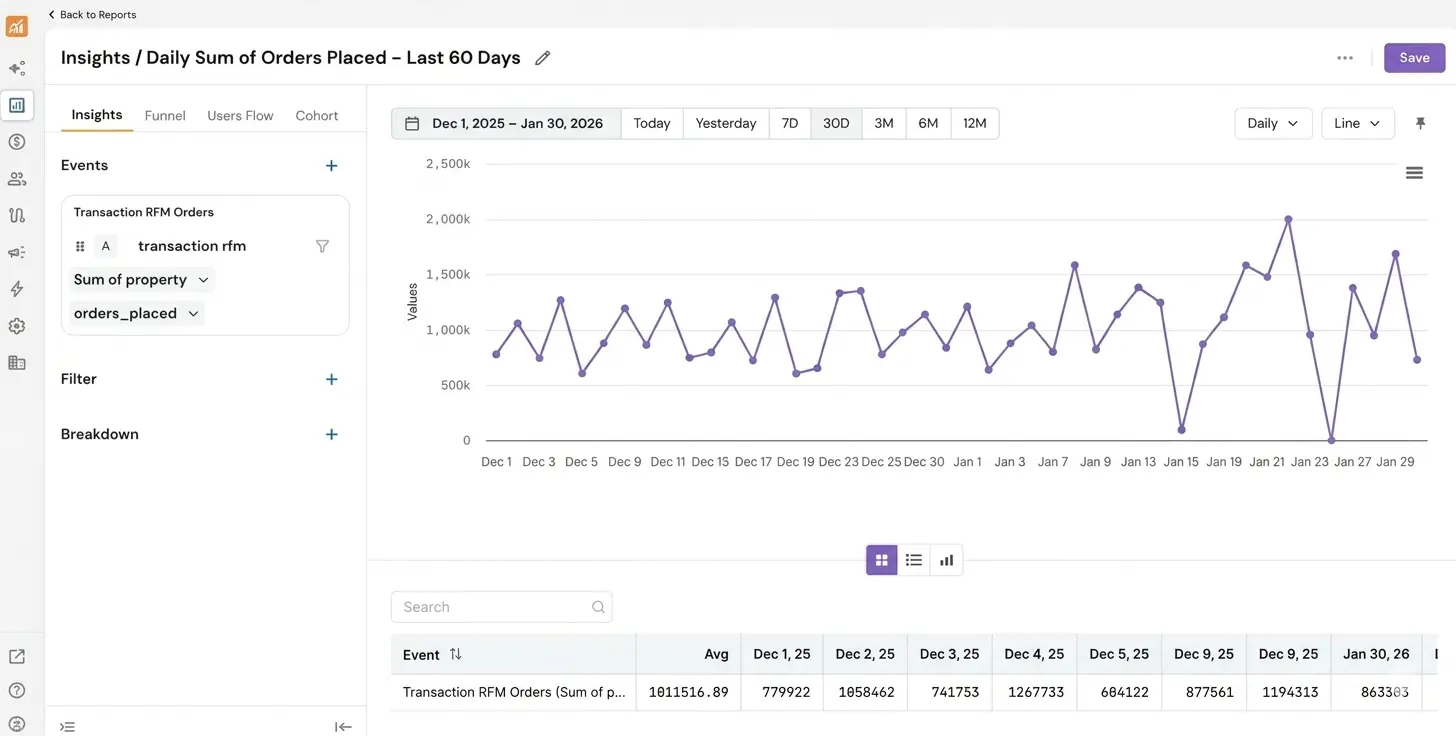
The report dashboard also provides a rich set of controls to customise your view. A date filter with quick presets (Today, Yesterday, 7D, 30D, 3M, 6M, 12M) plus a custom range option. Alongside it, you can toggle between Daily, Weekly, Monthly, and Annually granularity. A chart-type selector lets you pick the visualisation that fits your data best, including Line, Line with Area, Line Stacked with Area, Column, Column Stacked, Pie, Table, and Metric.
Problem it solves
When analysis tools are spread across different pages, teams waste time rebuilding the same event selections for each report type and lose the thread of their investigation.
With Reports, NVECTA gives teams a single starting point for all behavioural analytics, reducing setup time and making multi-perspective analysis effortless.
| Month | Savings |
|---|---|
| January | $250 |
| February | $80 |
| March | $420 |