A. Market Attribution
Understanding which marketing channels actually drive revenue is critical for budget decisions. To make this easy, we are now introducing a Market Attribution dashboard that lets you analyse revenue by metrics such as UTM Source, UTM Medium, UTM Campaign, and Traffic Source. The report ties each source directly to transactions, paying users, and revenue, giving you a clear picture of which external marketing efforts are delivering returns.
How to use it
Navigate to Revenue → Market Attribution. The dashboard is available alongside existing revenue analytics views.
Start by selecting a Revenue Event from the dropdown on the left. Optionally, apply an attribute filter to narrow the data further. Under Metric, select what you want to attribute revenue by — UTM Source, UTM Medium, UTM Campaign, or Traffic Source. You can also add a Breakdown by clicking the + icon to layer additional parameters for deeper analysis.
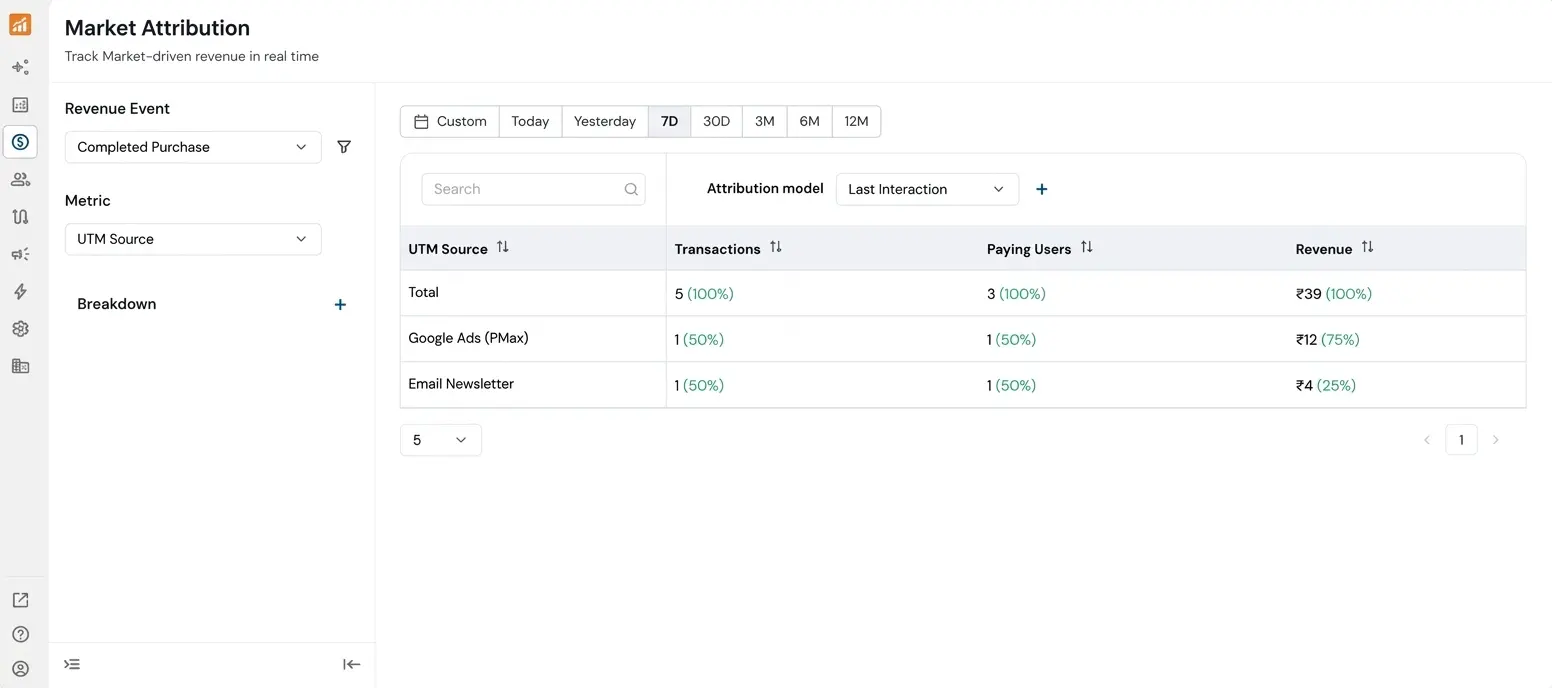
The report displays each attribution metric alongside its Transactions, Paying Users, and Revenue, with percentage shares shown for quick comparison. By default, data is shown for the last 7 days; use the date filter to adjust the time range.
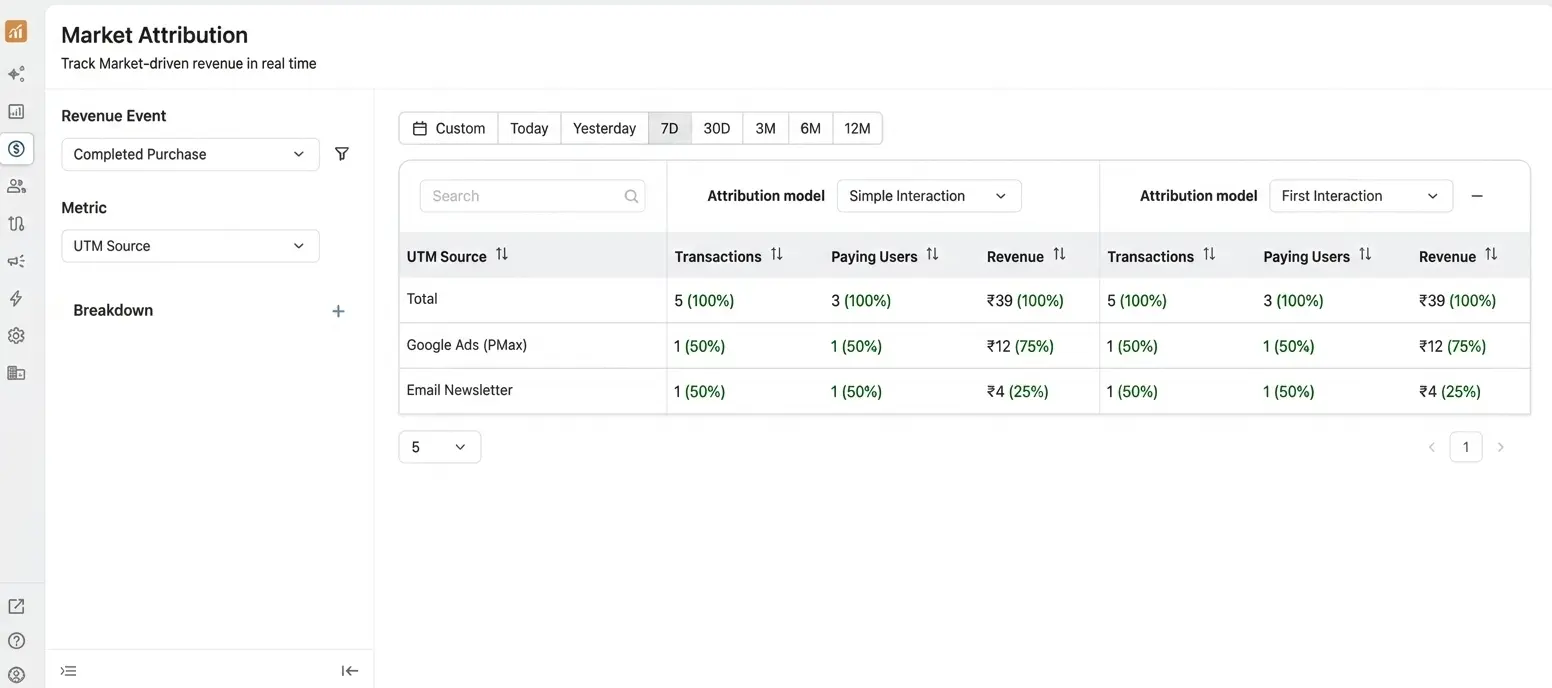
Attribution model selection — Use the Attribution model dropdown above the table to switch between Last Interaction, First Interaction, Simple Interaction, and Linear Interaction models.
Side-by-side model comparison — Click the + button next to the attribution model dropdown to add a second model. The table expands to show both models' metrics side by side, making it easy to compare how different models credit the same sources.
Problem it solves
Without a dedicated market attribution view, teams couldn't quickly answer questions like "which UTM source is generating the most transactions, paying users, and revenue?" or "how does first-touch vs. last-touch attribution change the picture?” This dashboard centralises that analysis, eliminates the need for manual cross-referencing, and lets teams compare attribution models in a single view to make more informed marketing spend decisions.
B. Campaign Attribution
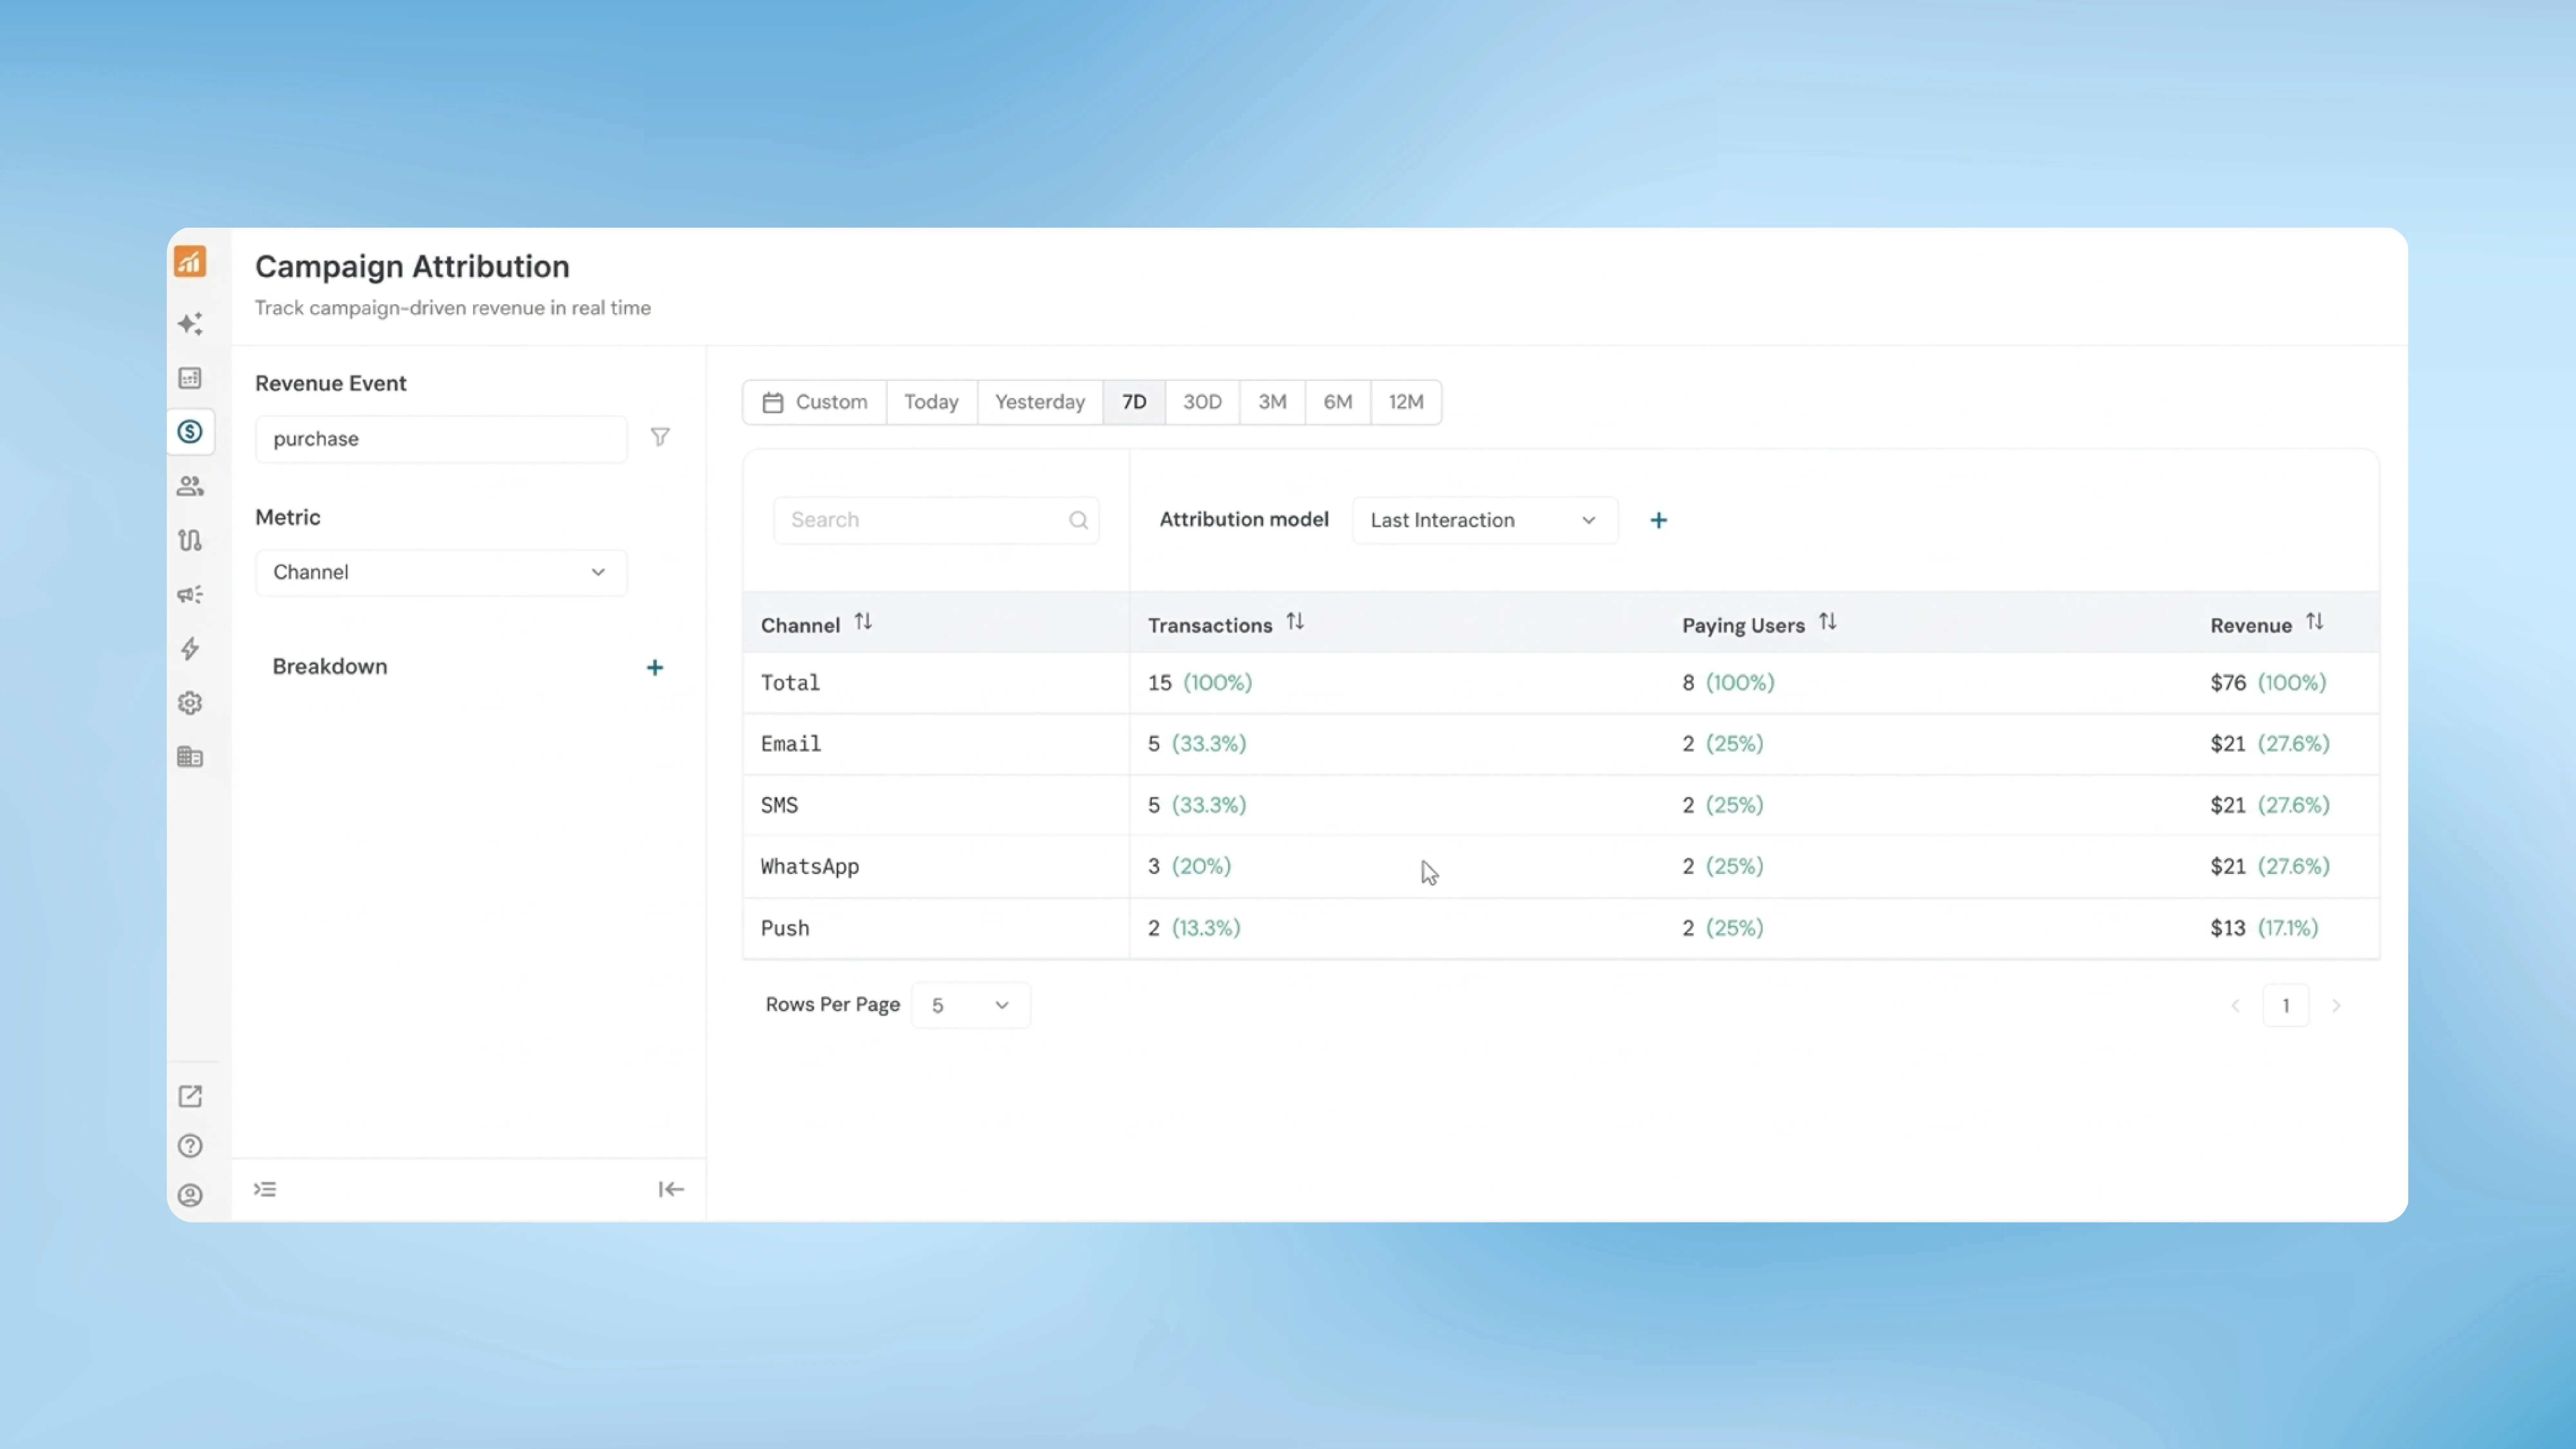
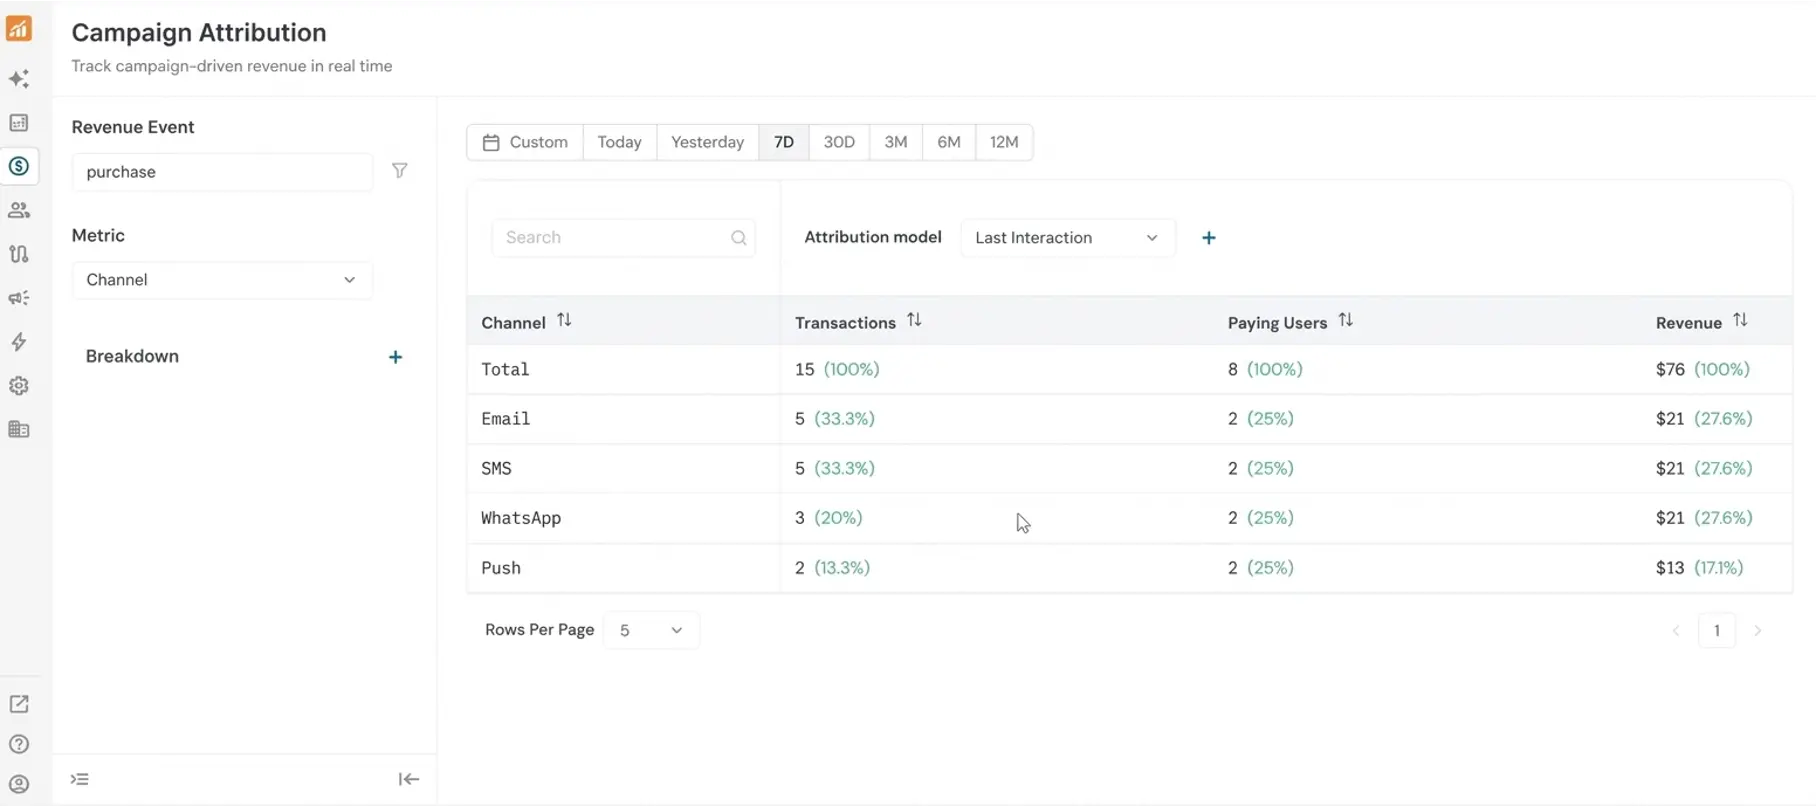
While Market Attribution tracks revenue from external marketing sources, Campaign Attribution focuses specifically on revenue generated through campaigns sent via NVECTA across email, SMS, WhatsApp, Push, and other channels. This new dashboard helps teams evaluate which campaign channels are most effective at driving conversions and revenue.
How to use it
Navigate to Revenue → Campaign Attribution.
Select a Revenue Event and choose an attribution Metric (options include Channel, Delivery Type, Label, or Campaign). Add a Breakdown parameter if you need further segmentation. The report displays Transactions, Paying Users, and Revenue for each attribution metric with percentage distributions.
The same date filter and attribution model controls available in Market Attribution apply here as well. You can switch between Last Interaction, First Interaction, Simple Interaction, and Linear Interaction models, and compare two models side by side using the + button.
Problem it solves
Teams running campaigns across multiple channels often struggle to see a consolidated view of which channel is actually converting. This dashboard ties campaign touchpoints, giving teams the data they need to optimise channel mix and campaign strategy.
Together, Market Attribution and Campaign Attribution provide a complete picture of revenue sources, from external traffic all the way through NVECTA-driven engagement.