
Every funnel has drop-offs, users who start the journey but don't complete it. The difference between good and great conversion rates lies in how you identify, re-engage, and optimise for these lost opportunities.
Once you've set up your activation funnel post onboarding, this should be your next move. Building a systematic workflow to recover lost users and prevent future drop-offs.
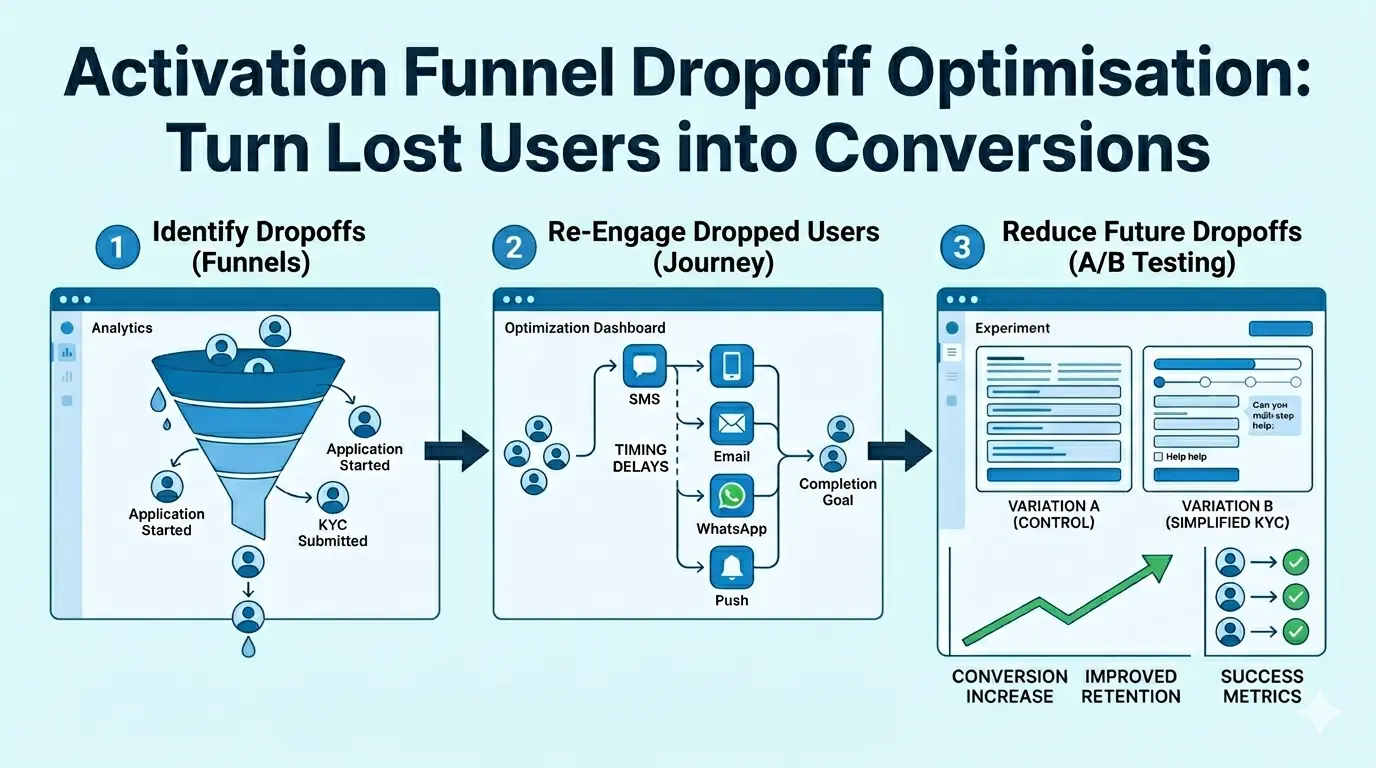
In this recipe, we'll guide you through a complete drop-off optimisation workflow using three powerful tools working together:
- Funnels — Identify where users drop off
- Journey — Automatically re-engage dropped users
- A/B Testing — Optimise the experience to reduce future drop-offs
Part 1: Identify Drop-offs with Funnels
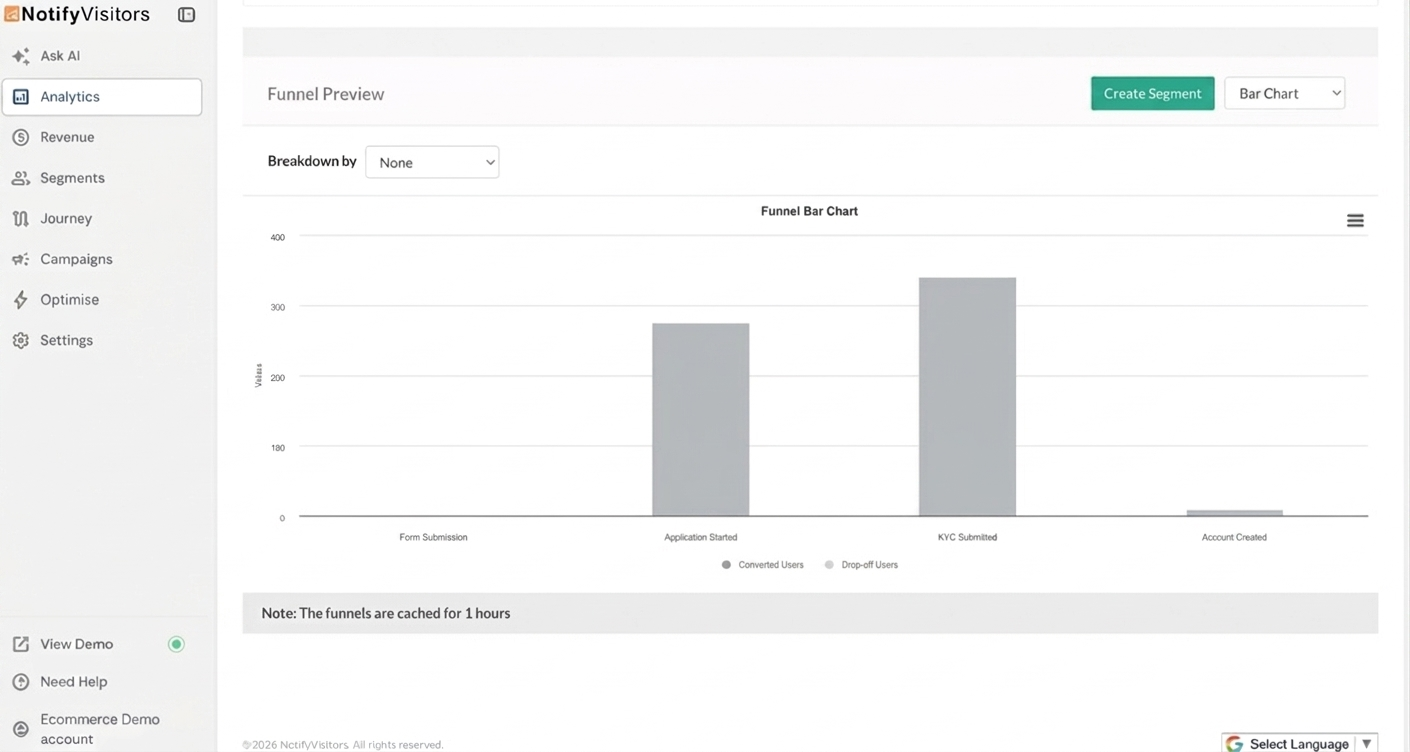
How to Access
Hover over to Analytics and select the Funnels option**.** You can either select an existing funnel from your saved list or create a new one.
Example: Banking Activation Funnel
Here's a typical 4-stage funnel for a banking or insurance business:
| Step | Event | What It Represents |
|---|---|---|
| 1 | Form Submission | User submits a lead or inquiry form (e.g., for a credit card or insurance plan) |
| 2 | Application Started | User begins the full application form |
| 3 | KYC Submitted | User completes identity verification and document upload |
| 4 | Account Created | User completes application and becomes an active customer. |
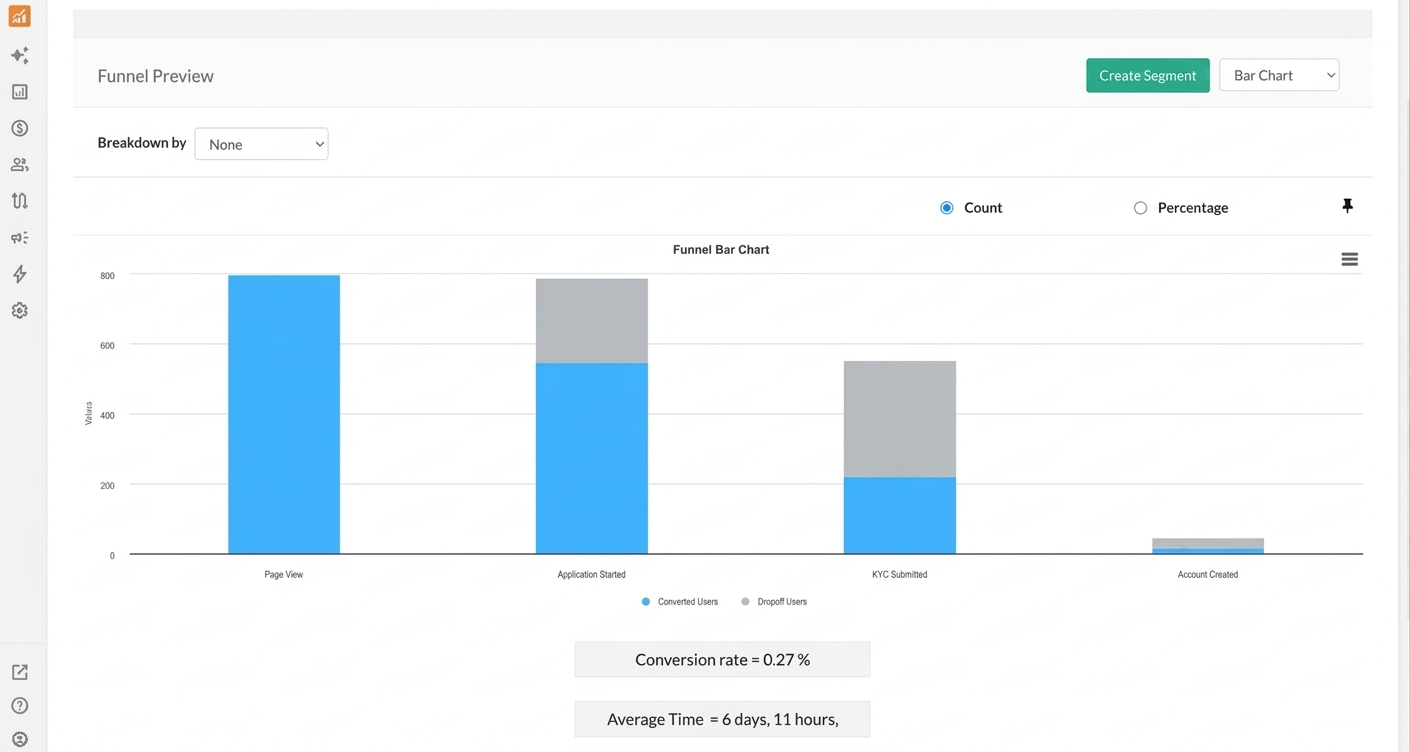
Reading the Drop-off Data
Once your funnel is generated, you'll see a bar chart with two visual layers for each step.
Since we're focused on identifying where users are dropping off, toggle off the Converted (blue) bar so only the drop-off data is visible. This gives you a cleaner view of exactly where your funnel is leaking.
You can also toggle between Count and Percentage to switch between absolute numbers and drop-off rates.
Identifying Your Biggest Leak
With only the drop-off bars visible, look for the step with the tallest gray bar, that's your primary optimisation opportunity. Hover over the bar chart to see the number/percentage of users dropping off.
Part 2: Re-engage Dropped Users with Journey
Once you've identified where users drop off, create automated re-engagement workflows to bring them back. In our BFSI example, the biggest leak was between Application Started and KYC Submitted, so we'll build a journey to nudge those users to complete their verification.
Setting Up a KYC Drop-off Re-engagement Journey
Navigate to Journey in the left sidebar and click Create Journey. Select Create form scratch and then workflow journey option.
Step 1: Set Your Trigger
Under TRIGGERS, select Event and choose your drop-off event (Application Started in our case). This ensures the journey is triggered for every user who begins an application and if they don't complete KYC within the defined window, the re-engagement flow kicks in.
Step 2: Build Your Re-engagement Flow
Drag and drop channels from the ACTIONS panel to create your outreach. You can use a single channel or combine multiple for a multi-touch approach:
- Email: Best for detailed guidance, document checklist, and step-by-step instructions.
- SMS: Best for short reminders with direct links back to the KYC form.
- WhatsApp: Best for conversational nudges and quick support replies.
- Web Push: Best for reminding users while they are browsing your website.
- App Push: Best for bringing mobile app users back to complete verification.
Step 3: Set Timing Delays
Add wait times between messages to create a natural re-engagement cadence without overwhelming users:
| Delay | Message | Purpose |
|---|---|---|
| After 24 hours | First reminder (Email + SMS) | Gentle nudge — "Your application is almost complete, just one step left" |
| After 2 days | Second reminder (WhatsApp) | Offer help — "Need assistance with document upload? We're here to help" |
| After 5 days | Final attempt (Email + Push) | Create urgency — "Your application will expire soon. Complete KYC now" |
Example: KYC Completion Journey
Here's a multi-channel re-engagement flow for users who started an application but haven't submitted KYC:
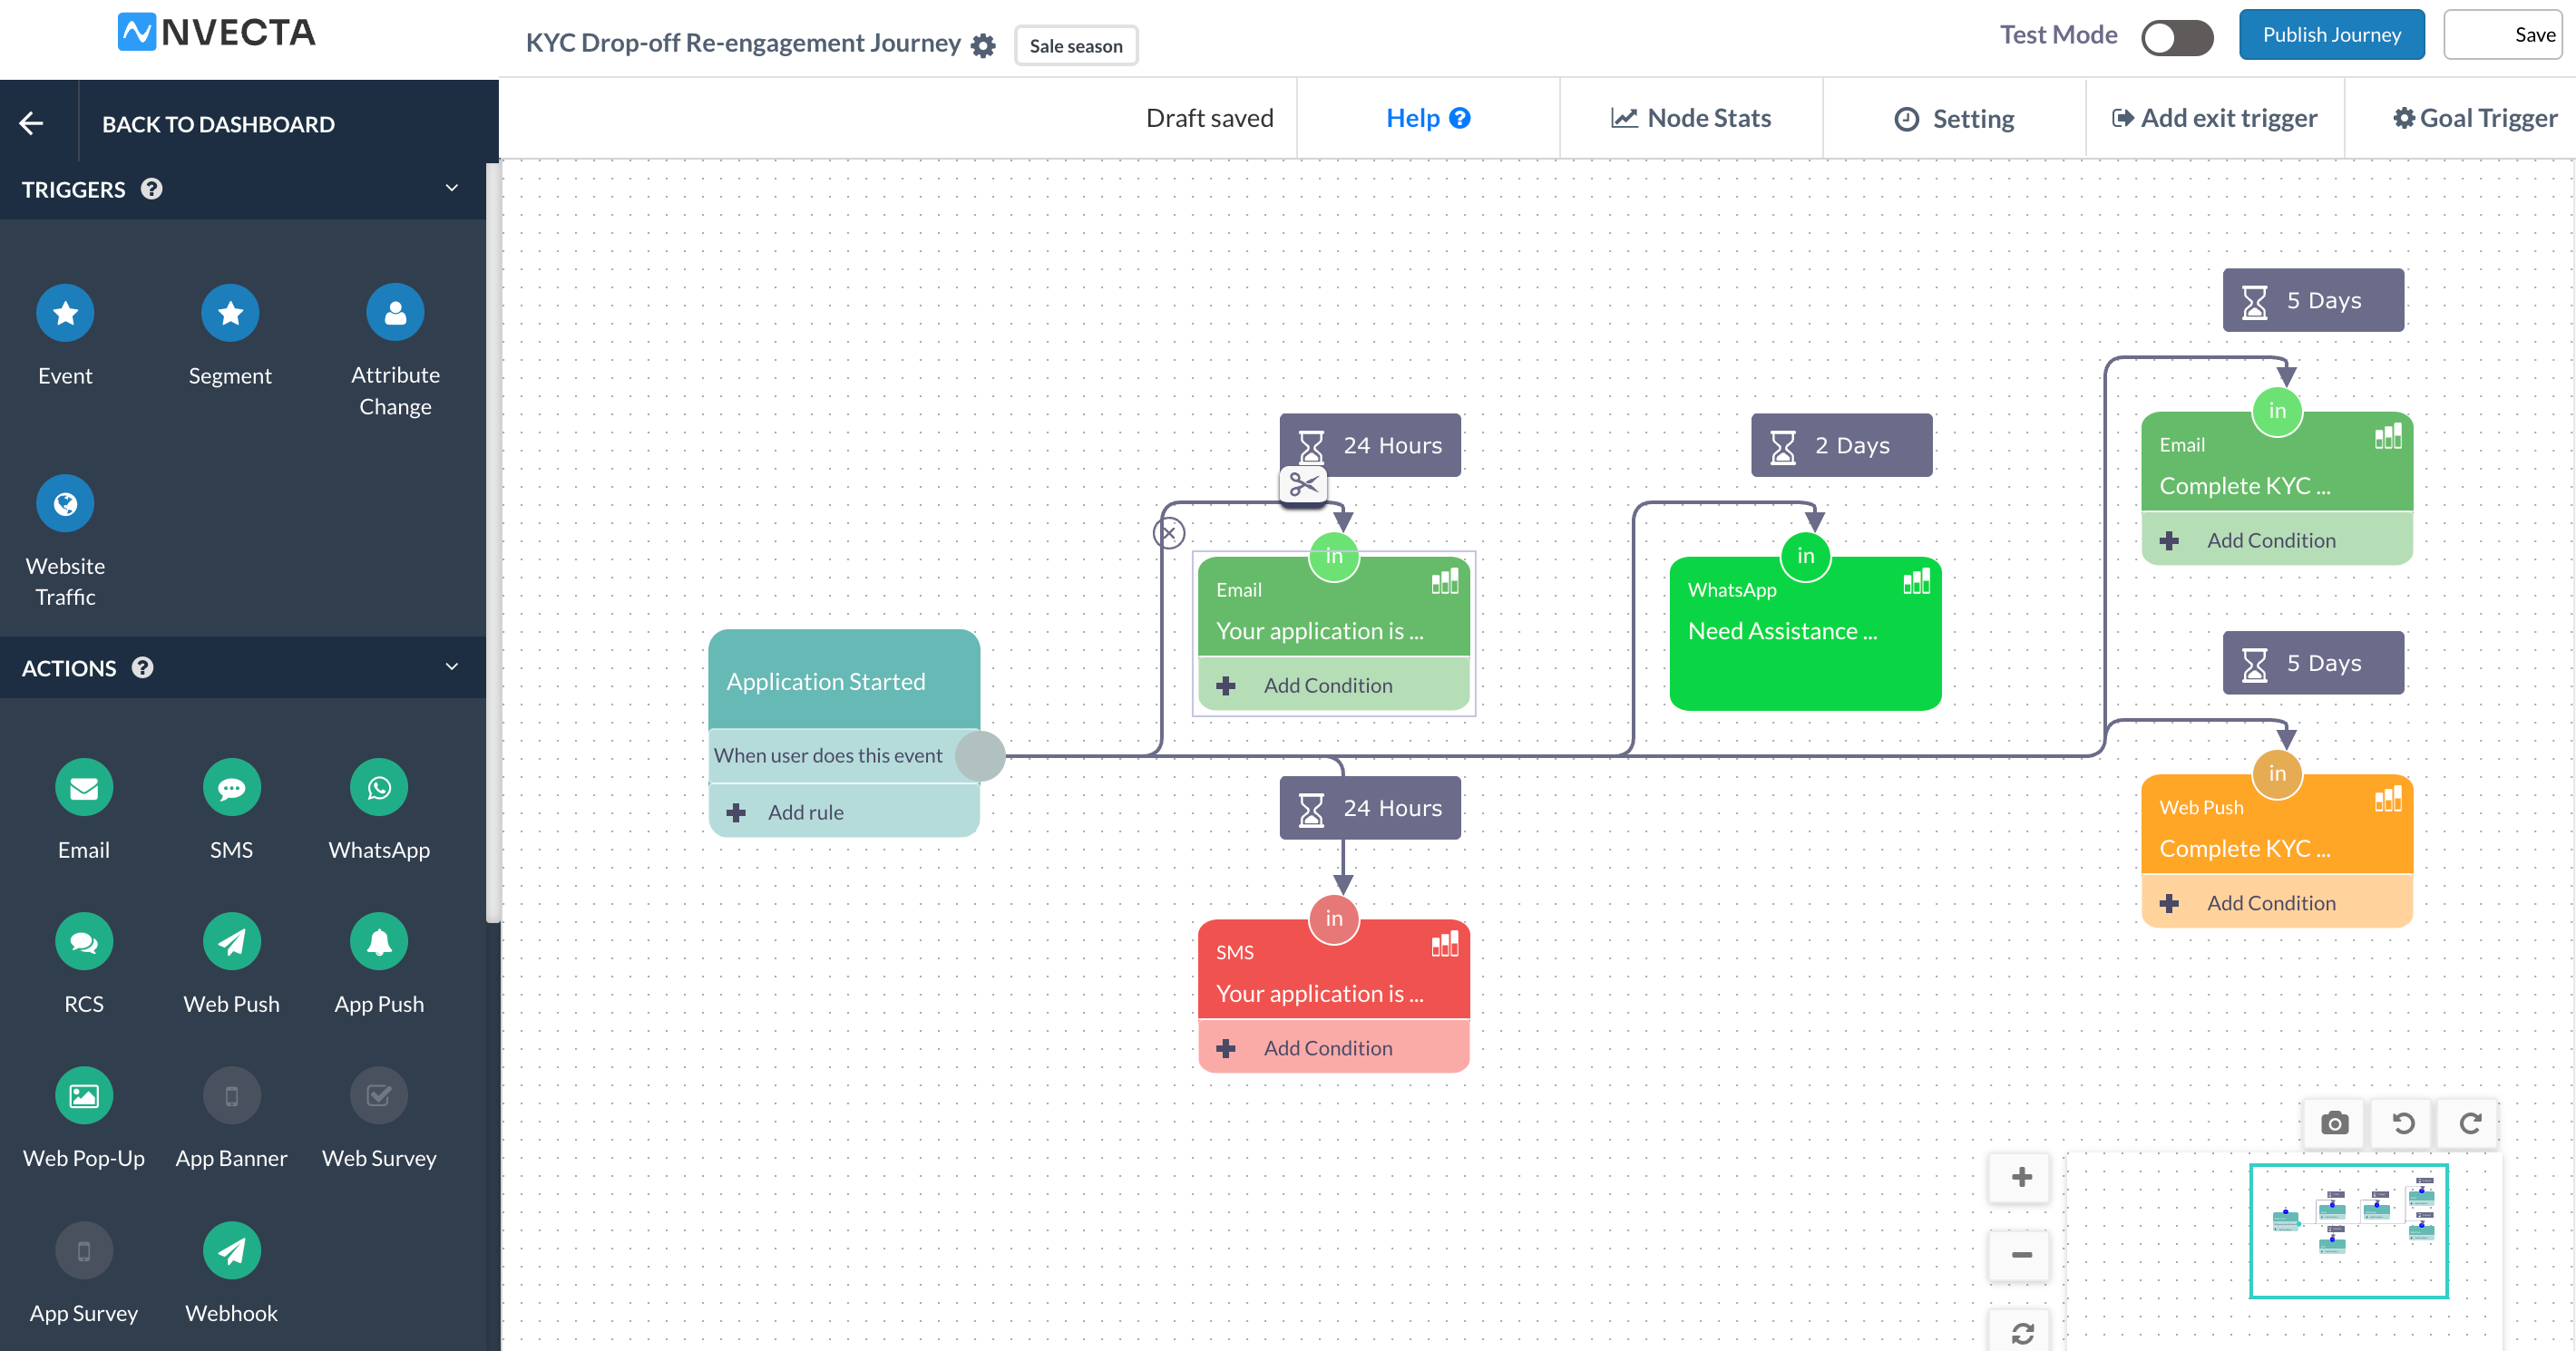
Step 4: Set the Journey Goal
Click Goal Trigger and select your goal event (KYC Submitted in our case). Users who complete their verification at any point during the journey will automatically exit the flow, so they won't receive further reminders after converting.
Step 5: Test and Publish
- Click Save to save your draft
- Enable Test Mode to validate your journey with a test user
- Click Publish Journey when you're ready to go live
Monitoring Journey Performance
To view analytics for your journey, navigate to the Journey section in your NVECTA console. You'll see a list of all your created journeys. Click the three-dotted button under the Actions column and select Analytics for the journey you want to review.
The analytics section opens with an overview of your journey's key performance indicators: Total entries, Total exits, Total in journey, Total goal, and Total expire.
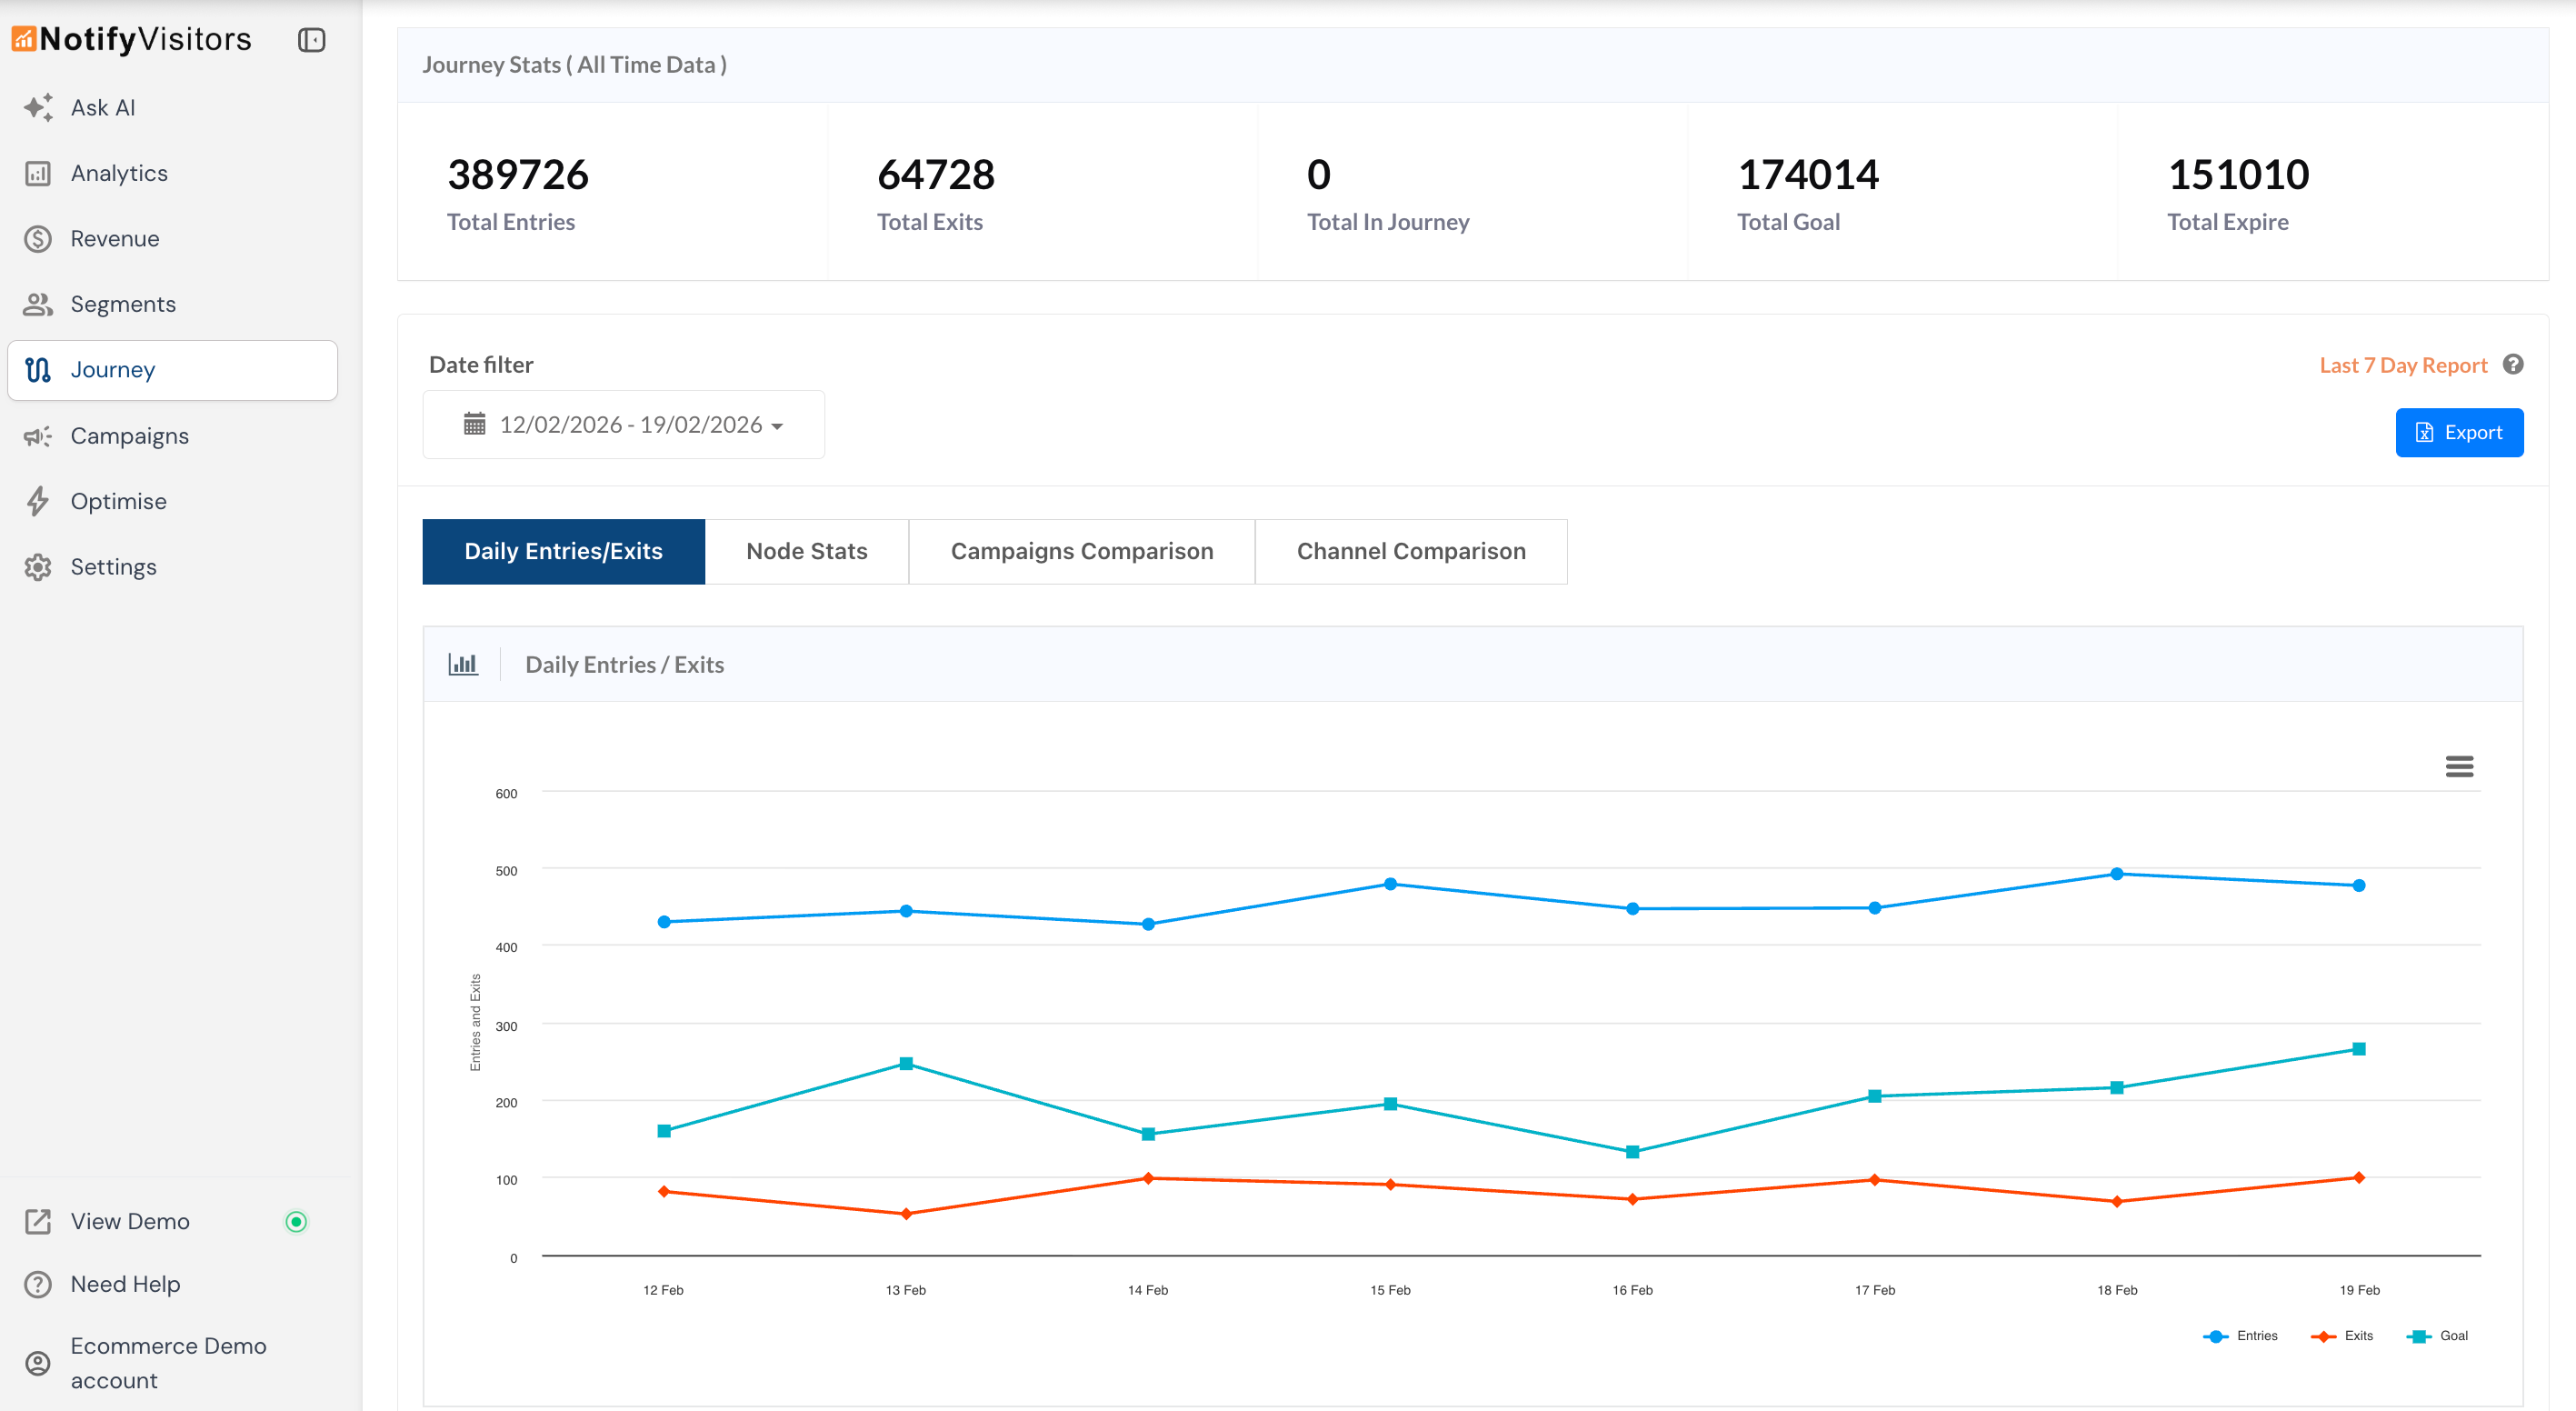
Below this, you'll find a Daily Entries/Exits graph showing entries, exits, and goal completions over time, giving you a quick visual of how effectively your journey is turning users into completed conversions day by day.
For deeper analysis, explore the Node Stats, Campaign Comparison, and Channel Comparison tabs to understand which messages and channels are driving the most conversions.
Part 3: Reduce Future Drop-offs with A/B Testing
Re-engagement recovers some lost users, but the real win is preventing drop-offs in the first place. Use website A/B Testing to optimise the pages and elements where users abandon.
What to A/B Test Based on Drop-off Points
- Form Submission → Application Started: Form design, CTA button text/color, field count, trust badges, pre-fill options
- Application Started → KYC Submitted: Form length, field labels, document upload UX, progress indicators, help prompts
- KYC Submitted → Account Created: Confirmation flow, next-step clarity, activation nudges, welcome experience
Creating an A/B Test
Navigate to Optimise in the left sidebar, then under Experiments header select A/B Testing. Click Create new A/B Test to get started.
The campaign creation process has five stages:
- Settings — Enter your campaign name, page URL, single/multi page condition, and run time.
- Variation — Click Create New Variation and create multiple variations as you like. Use the drag-and-drop web editor to modify page elements without any code. Set the traffic split at the bottom. By default, traffic is divided equally across all variations.
You can create multiple variations to test different hypotheses. For example:
| Variation | What You're Testing |
|---|---|
| Control (Original) | Current KYC page with all fields visible upfront |
| Variation B | Simplified KYC — break the form into smaller steps with a progress bar |
| Variation C (optional) | Add a help chat widget and document upload guide alongside the form |
- Targeting Rules — Define who should see the test, filter by device type, traffic source, location, and more.
- Goals — Set the success criteria that determine which variation wins. Goals can track clicks on specific elements (e.g., the "Submit KYC" button) or page visits (e.g., the KYC confirmation page).
- Review and Launch — Verify your settings, click Finish, and toggle the status switch to activate.
Comparing Variations and Picking the Winner
Once your test has run long enough, you can identify the winning variation directly from the campaign list. The winner is highlighted right here without needing to open anything.
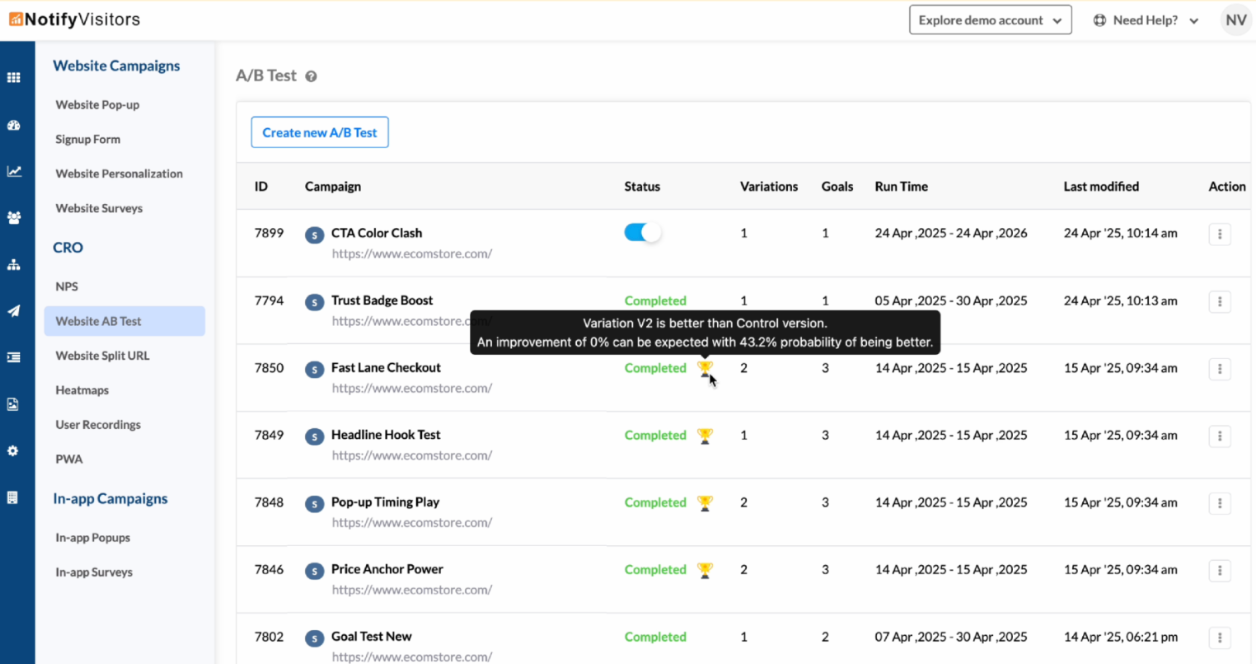
For a more detailed comparison, click the three-dot action button next to your campaign and select Analytics. Here you can compare conversion rates, goal completions, and engagement across all variations side by side. This helps understand not just which variation won, but why it won. Implement the winning variation as your default page and move on to optimising the next drop-off point in your funnel.
A/B Testing Best Practices
- Test one element at a time — Isolates what caused the change
- Run tests for adequate time — Ensures statistical significance
- Define success metrics upfront — Prevents bias in interpretation
- Document learnings — Build institutional knowledge
Example A/B Tests for Common Drop-offs
Form Submission Drop-off (Form Submission → Application Started):
- Test A: Lengthy lead form with 8+ fields
- Test B: Simplified 4-field form (collect more info later)
- Metric: Application start rate
Application Drop-off (Application Started → KYC Submitted):
- Test A: Single long-form KYC page
- Test B: Multi-step KYC with progress bar
- Metric: KYC completion rate
KYC to Account Drop-off (KYC Submitted → Account Created):
- Test A: Current post-KYC confirmation page
- Test B: Confirmation page with clear next steps and activation CTA
- Metric: Account creation rate
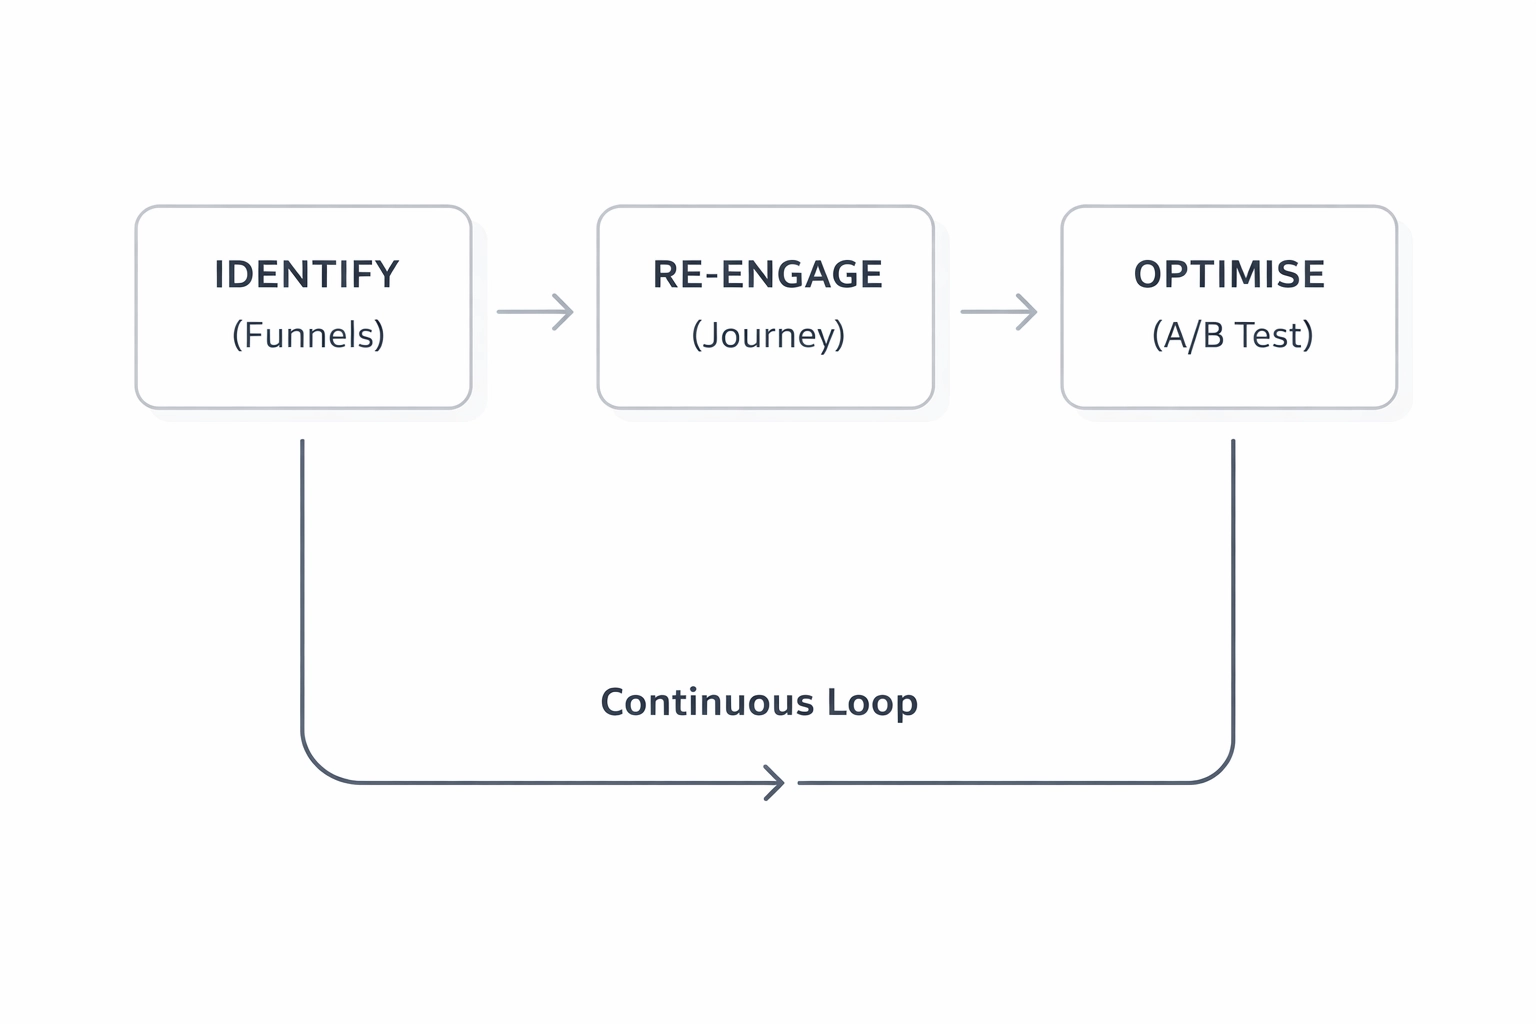
Putting It All Together: The Complete Workflow
Here's how to use all three tools in a continuous optimisation cycle:
Week 1-2: Identify
- Build your activation funnel in Funnels
- Identify the step with the highest drop-off rate
Week 2-4: Re-engage
- Create a Journey targeting dropped users
- Set up multi-channel touchpoints (Email → Push → SMS → WhatsApp)
- Monitor recovery rates (goal completion)
Week 2-6: Optimise
- Create an A/B Test for the high-drop-off page
- Test your improvement hypothesis
- Implement winning variation
Ongoing: Measure & Iterate
- Re-check funnel to measure improvement
- Move to the next biggest drop-off point
- Repeat the cycle
Success Metrics to Track
| Metric | Where to Find It | Target |
|---|---|---|
| Drop-off Rate | Funnel Analysis | Decrease by 10-20% per quarter |
| Journey Recovery Rate | Journey Goal Stats | Convert 5-15% of dropped users |
| Website Recovery Rate | A/B test analytics | Achieve 5-15% lift in conversion rate |
| Overall Funnel Conversion | Funnel Analysis | Improve by 15-30% over the quarter |
Conclusion
Drop-offs are inevitable, but lost users don't have to stay lost. With this three-part workflow, you now have a repeatable system to identify where users abandon your funnel, re-engage them through automated multi-channel journeys, and optimise the experience so fewer users drop off in the first place.
The key is to treat this as a continuous cycle, not a one-time fix. Each round of analysis, re-engagement, and testing compounds into measurable improvements in your conversion rates and revenue over time.
Start with your biggest leak, fix it, and move to the next one.
Got questions? Ask our AI Copilot for instant answers or reach out to our support team at support@nvecta.com. We're here to help.