

Understanding where your traffic comes from, how users engage with your pages, and which landing pages drive the most acquisitions is the foundation of any data-driven growth strategy.
These are the very first reports you should start using post onboarding. Three pre-built, ready-to-use reports that give you a complete picture of your traffic performance without any setup. In this recipe, we'll walk you through each report, what every metric means, and how to turn the data into actionable insights.
How to Access These Reports
All three reports are already created and pinned for quick access:
- Hover over Analytics in the left sidebar
- Scroll down to the Pinned Reports section
- You'll find:
Report 1: Traffic Acquisition
Purpose: Understand which channels are driving traffic to your website and their quality.
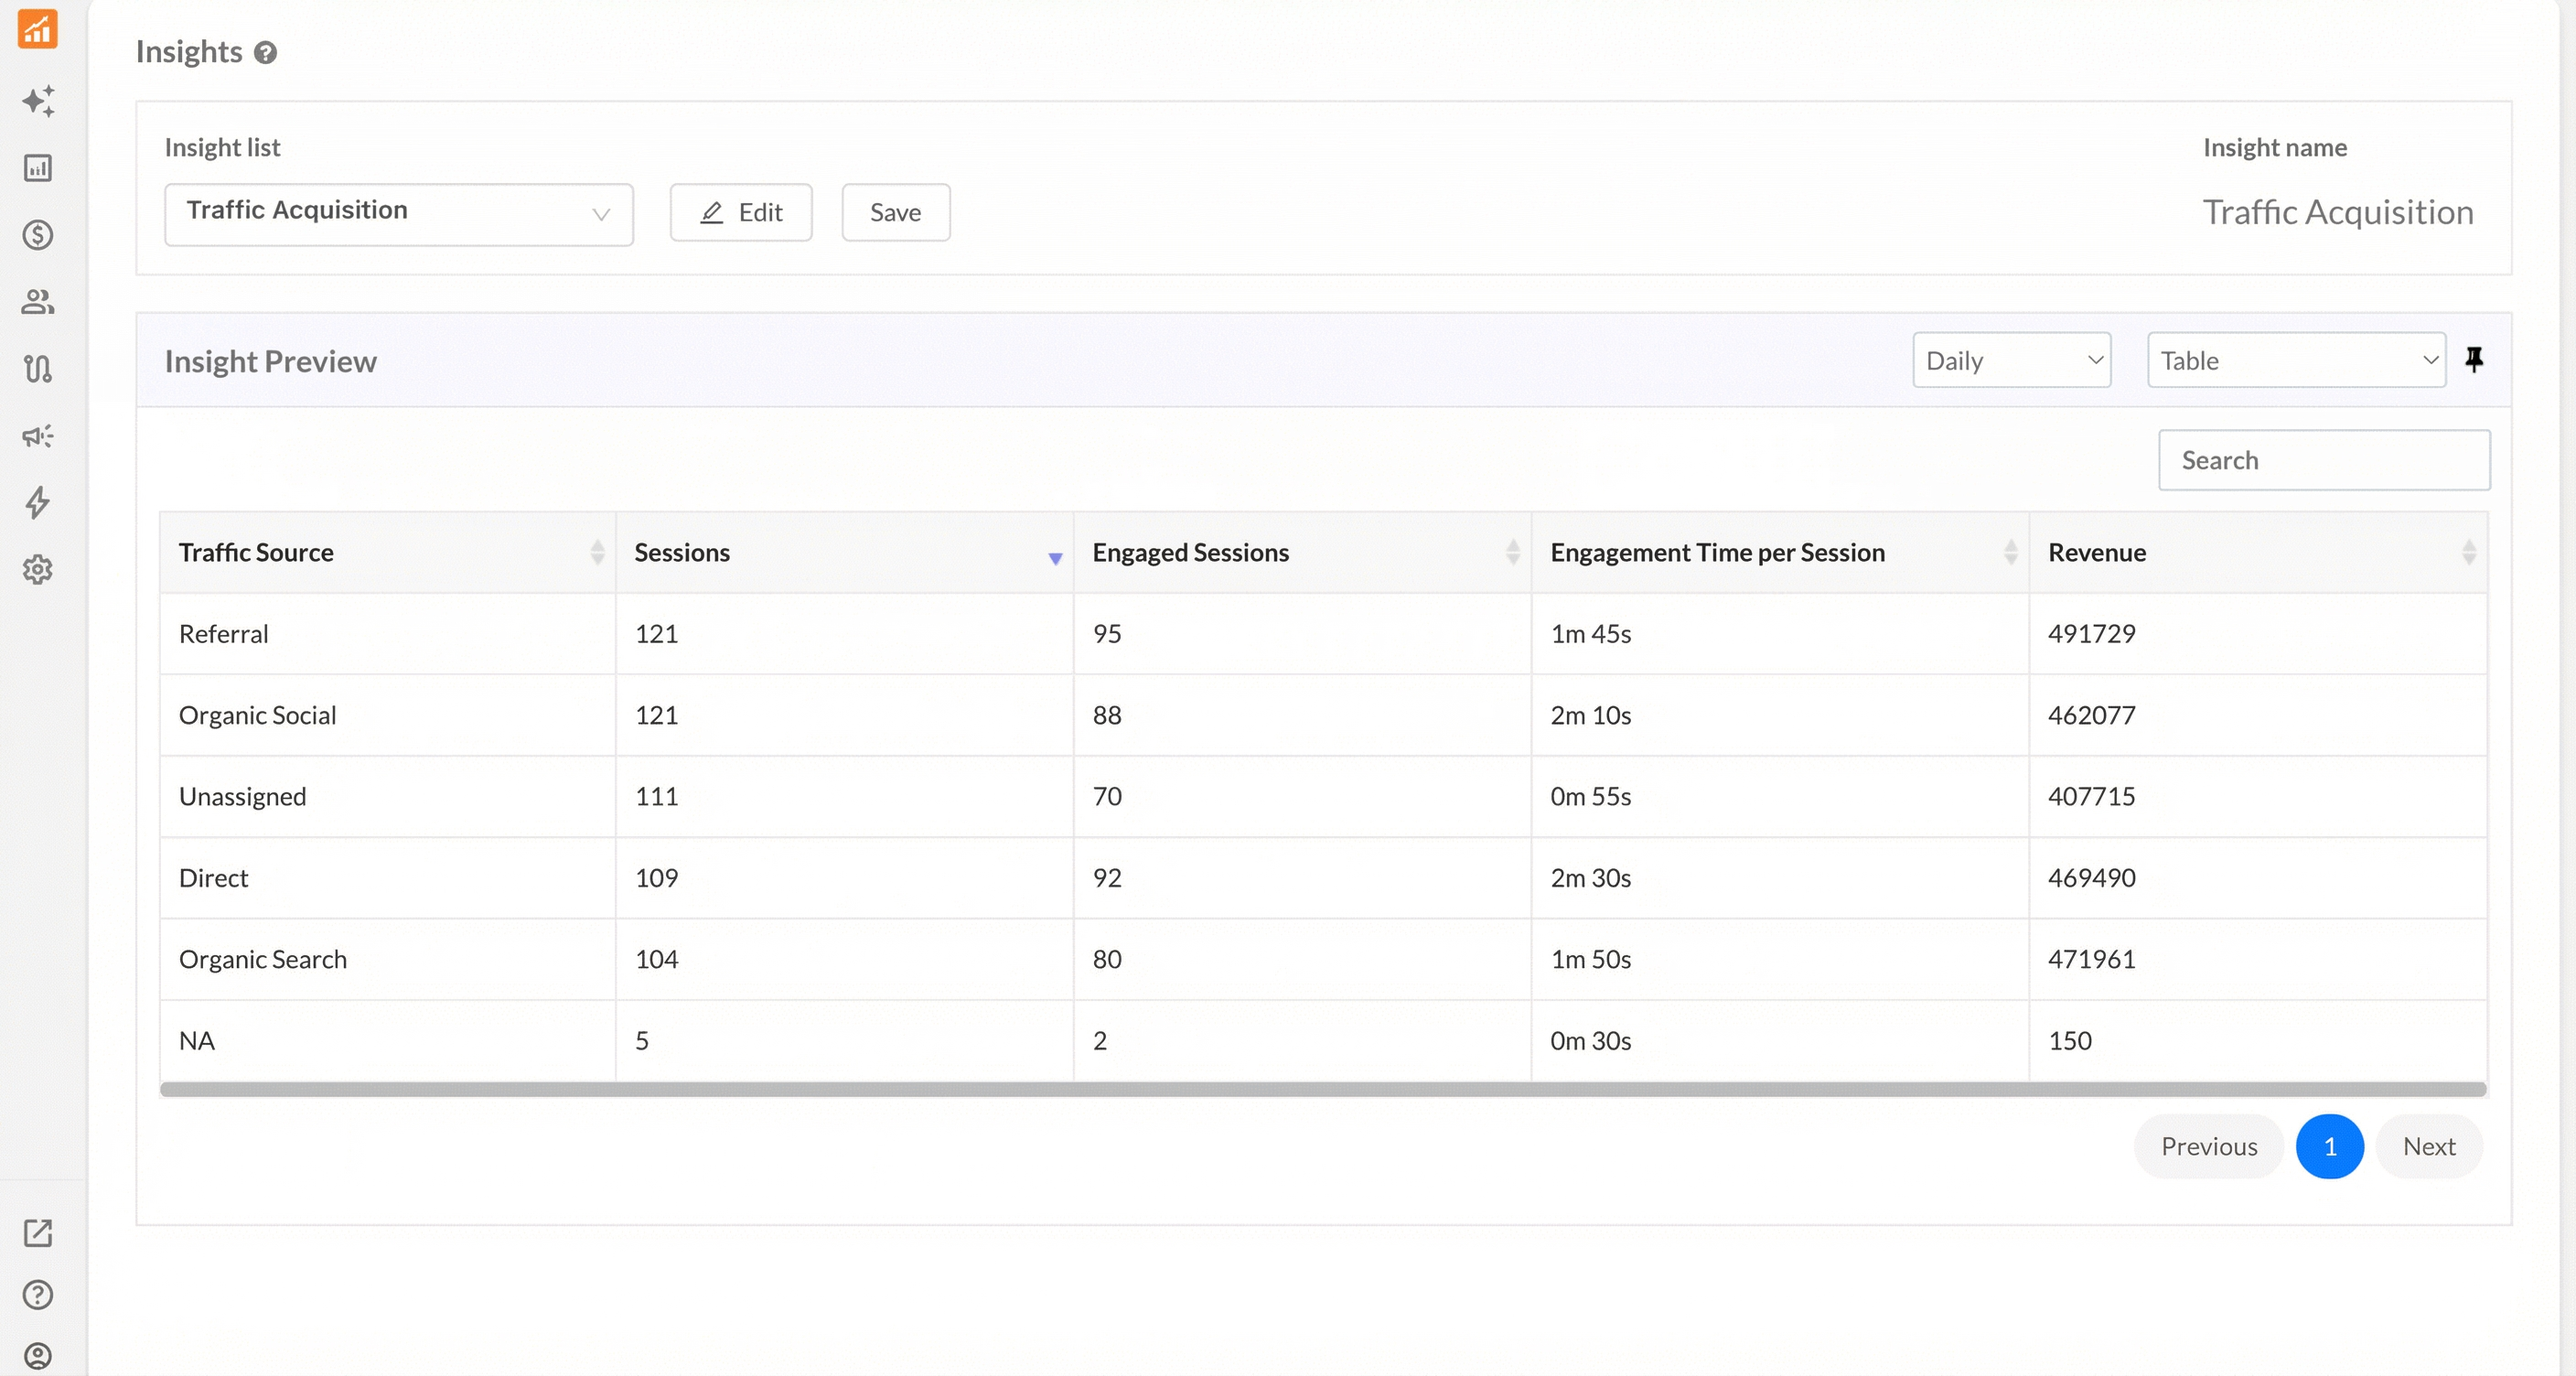
What This Report Shows
| Column | What It Tells You |
|---|---|
| Traffic Source | The channel that brought users to your site (Direct, Organic Social, Organic Search, Referral, etc.) |
| Sessions | Total number of visits from each source |
| Engaged Sessions | Sessions where users actively interacted with your site |
| Engagement Time per Session | Average time users from each source spent engaging |
| Revenue | Revenue attributed to each traffic source |
How to Analyse
1. Identify Your Top Traffic Sources: Look at the Sessions column to see which channels drive the most visitors.
2. Evaluate Traffic Quality: High sessions don't always mean high-quality traffic. Compare:
- Engaged Sessions vs Total Sessions — A low ratio indicates visitors are bouncing quickly
- Engagement Time — Longer times suggest more interested visitors
3. Measure Revenue Impact: The Revenue column shows which sources convert best. A source with fewer sessions but higher revenue is more valuable than one with high traffic but low conversions.
Key Questions This Report Answers
- Where is my traffic coming from?
- Which traffic sources bring the most engaged visitors/sessions?
- Which traffic sources generate the most revenue?
- Which traffic source should I invest more in, such as paid vs organic sources?
Report 2: Page Engagement
Purpose: Measure how users interact with your website pages and content.
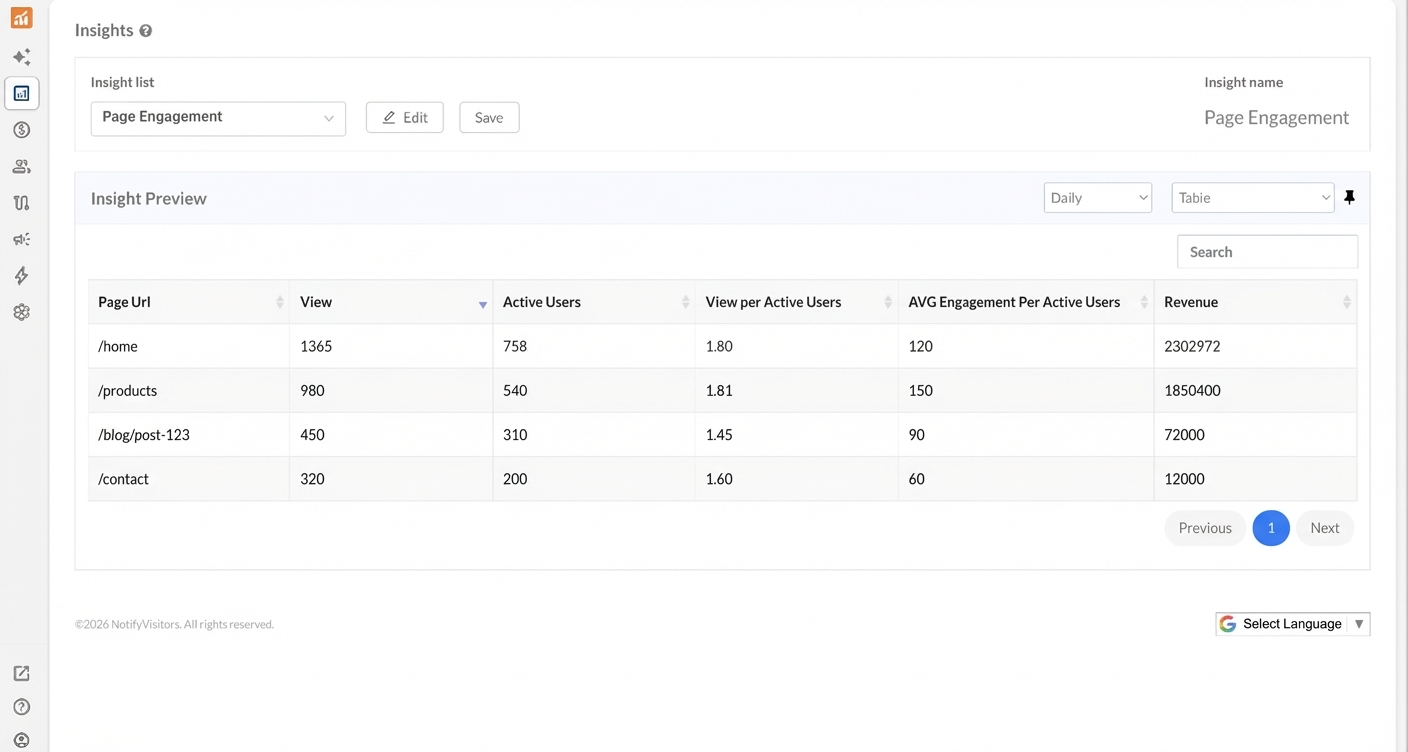
What This Report Shows
| Column | What It Tells You |
|---|---|
| Page URL | The specific pages being analyzed |
| View | Total page views |
| Active Users | Unique users who viewed the page |
| View per Active Users | Average number of times each user viewed the page |
| Average Engagement Per Active Users | Average engagement duration per user |
| Revenue | Revenue attributed to this page |
How to Analyse
1. Understand Page Popularity
- Views show total impressions
- Active Users shows unique visitors
- The difference tells you about repeat visits
2. Calculate Engagement Depth
- View per Active Users means average each user viewed this page
- Higher values indicate sticky, valuable content that users return to
3. Assess Engagement Quality
- Average Engagement Per Active Users measures interaction depth
- A lower value suggests users view but don't interact (consider adding CTAs, forms, or interactive elements)
Key Questions This Report Answers
- Which pages get the most traffic?
- Are users returning to specific pages multiple times?
- Which pages drive the most engagement and revenue?
- Where should I focus content optimisation efforts?
Report 3: Landing Page Acquisition
Purpose: Analyse which entry points bring in new users and how effectively they convert.
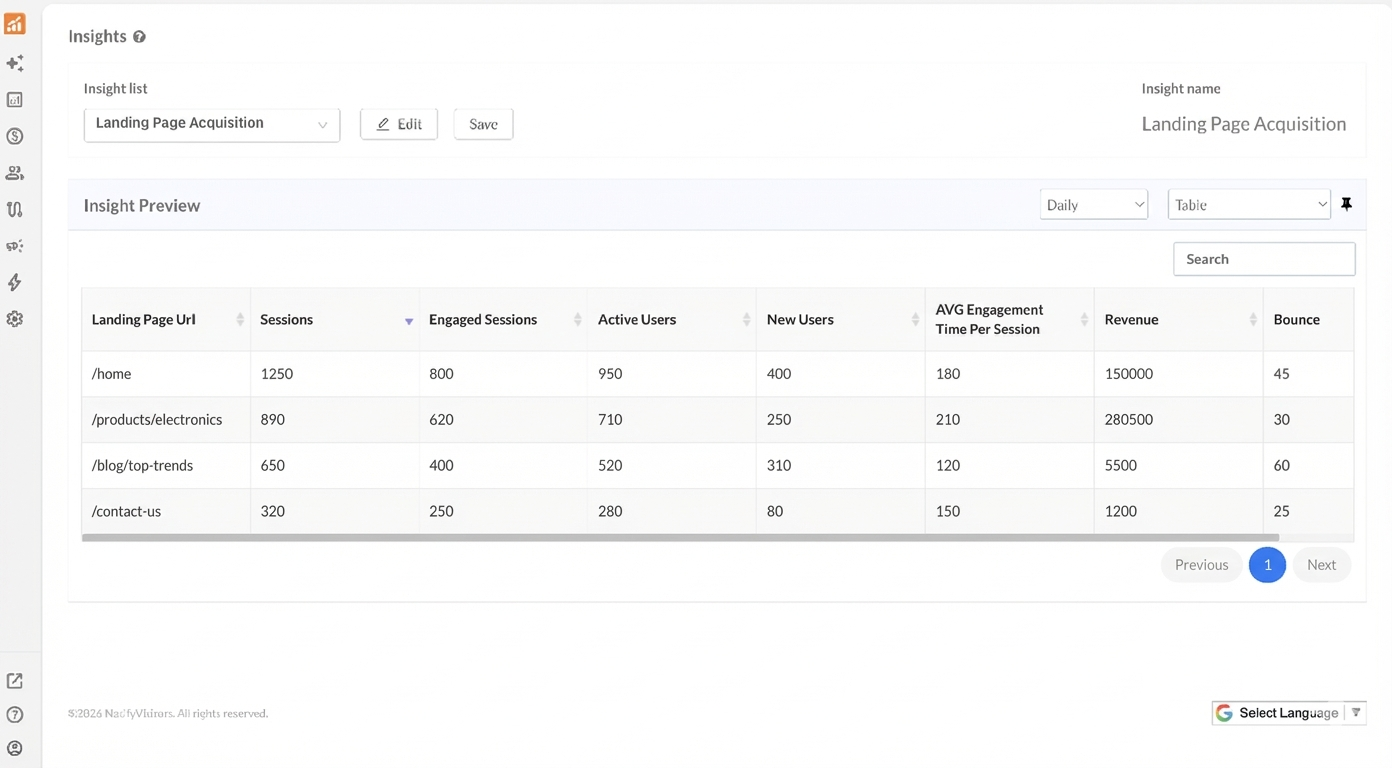
What This Report Shows
| Column | What It Tells You |
|---|---|
| Landing Page URL | The first page users see when entering your site |
| Sessions | Total sessions that started on this page |
| Engaged Sessions | Sessions with meaningful interaction |
| Active Users | Unique users who landed on this page |
| New Users | First-time visitors who entered through this page |
| Average Engagement Time Per Session | Time spent by users who landed here |
| Revenue | Revenue from sessions starting on this page |
| Bounce | The number of sessions where users left without any meaningful interaction |
How to Analyse
1. Measure Acquisition Effectiveness
- Compare Sessions vs New Users to determine what percentage of your landing page visitors are first-time users
- High new user percentage = good acquisition page
- Low new user percentage = page attracts returning visitors
2. Evaluate First Impression Quality
- Engaged Sessions shows how many visitors found value immediately
- Average Engagement Time indicates if your landing page hooks visitors
- Bounce reveals how many visitors left without interacting. A high bounce count relative to sessions means the landing page isn't resonating (consider improving content, page load speed, or the clarity of your value proposition)
- Compare bounce across pages to spot weak entry points. For example, a blog page with 650 sessions and 60 bounces may need a stronger hook, while a contact page with low bounce suggests visitors arrive with clear intent
3. Identify Revenue-Driving Entry Points
- Compare Revenue across landing pages to find your money pages
- Optimise high-traffic, low-revenue pages to improve conversions
- Pages with high bounce and low revenue are prime candidates for A/B testing and optimisation
Key Questions This Report Answers
- Which pages are best at acquiring new users?
- Do my landing pages create strong first impressions?
- Which entry points lead to the highest revenue?
- Where should I direct my paid traffic campaigns?
- Which landing pages have the highest bounce and need optimization?
Putting It All Together: A Complete Traffic Analysis
Use all three reports together for comprehensive insights:
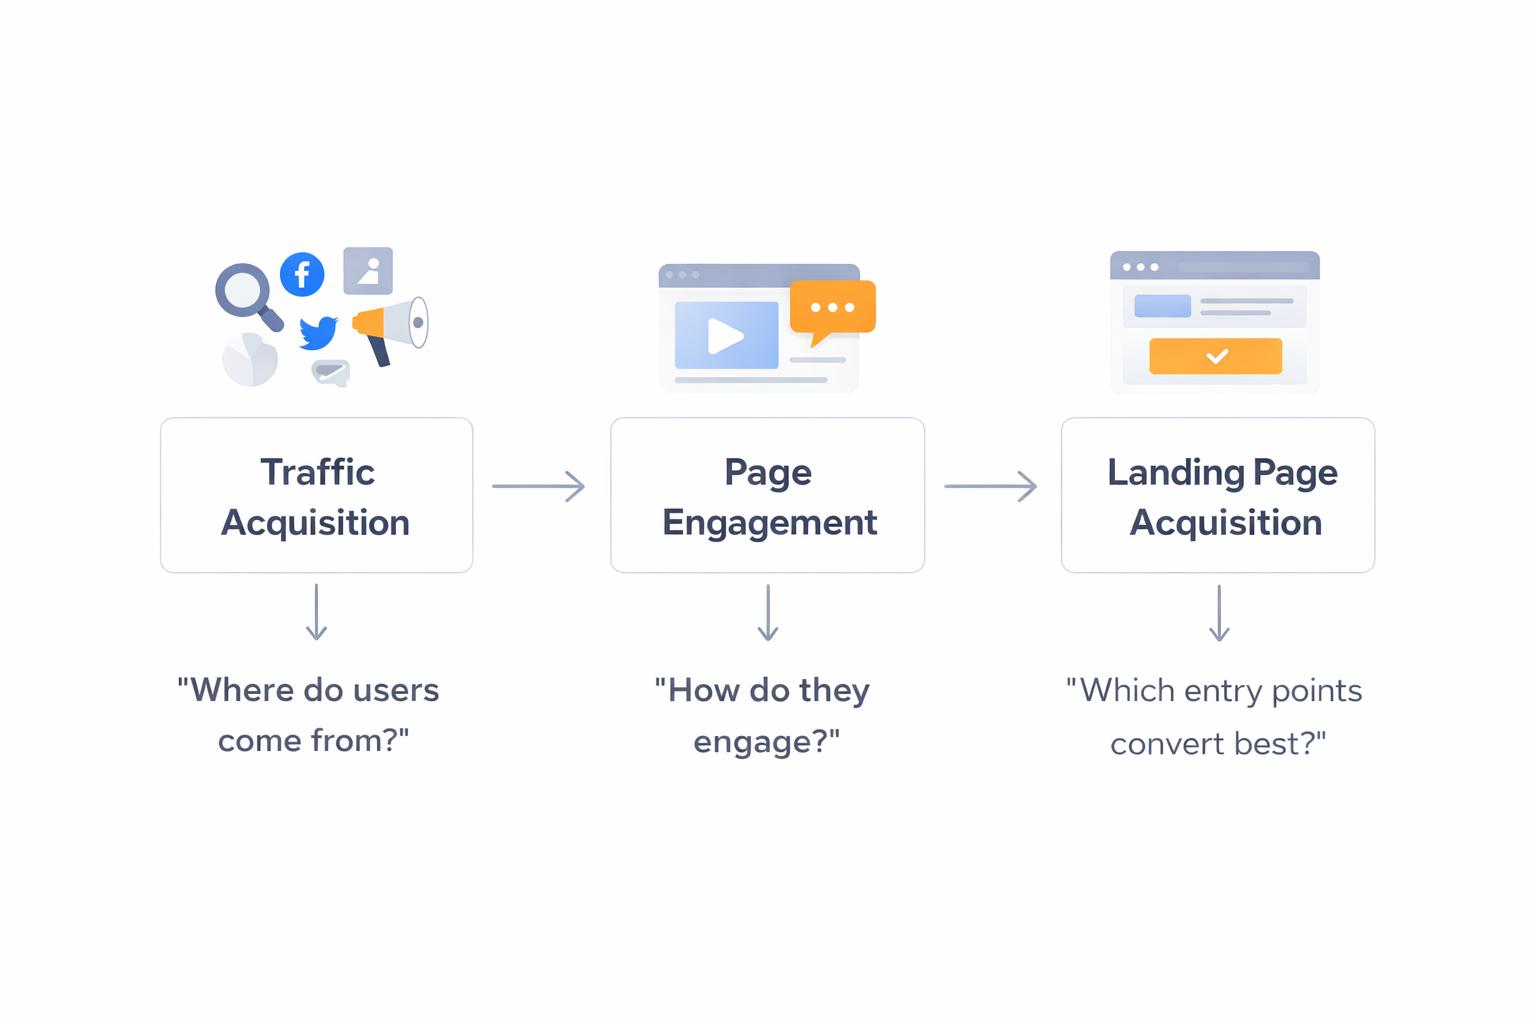
Example Analysis Workflow
- Start with Traffic Acquisition — Identify your top-performing channels
- Check Page Engagement — See if traffic from those channels actually engages
- Review Landing Page Acquisition — Determine if your landing pages effectively capture and convert that traffic
Actionable Insights
| If You See... | Consider... |
|---|---|
| High traffic, low engagement | Improving page content or targeting |
| High engagement, low revenue | Adding clearer CTAs or conversion paths |
| Low new users on landing pages | Running acquisition campaigns |
| One source outperforming others | Doubling down on that channel |
Tips for Regular Monitoring
- Daily: Quick check on traffic sources for anomalies
- Weekly: Review all three reports to spot trends
- Monthly: Deep analysis to inform strategy changes
Use the Daily/Weekly toggle and Table/Chart views to customize your analysis.