
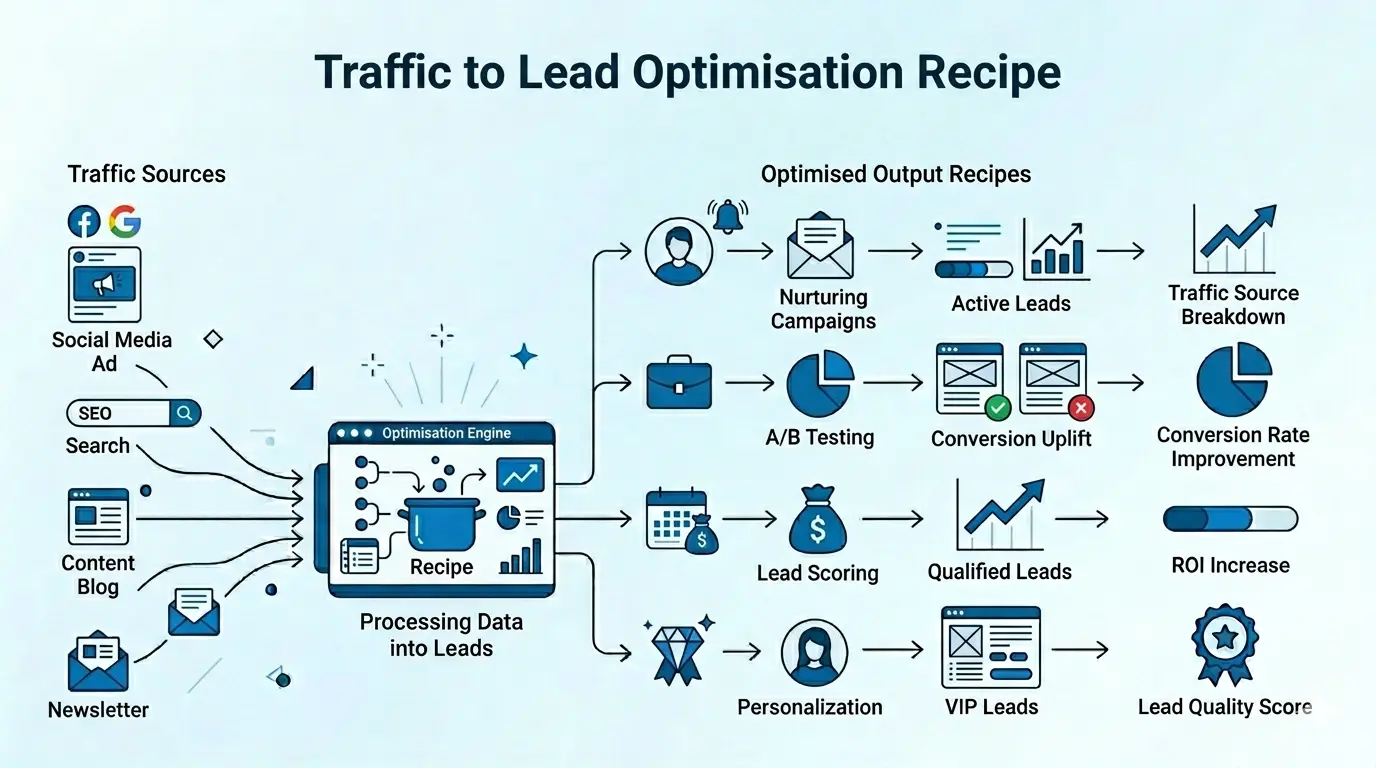
Objective: Track and improve your traffic-to-lead conversion rate by analysing page visitors vs form submissions, broken down by traffic source, and implementing smart signup form triggers to maximise conversions.
Not every visitor who lands on your site converts into a lead, but among those who don't, there are two distinct types. Engaged visitors who spend time on your page and have a meaningful session, and bouncers who leave almost immediately. This recipe helps you target both using smart signup form triggers. For example, engaged visitors can be shown a signup form after a certain scroll percentage, while bouncers can be targeted with a form triggered on exit intent.
Looking to reduce bounce rates instead? If your goal is to make landing pages more engaging before optimising for leads, explore Web Page Personalisation and Website A/B Testing offered by NVECTA.
In this recipe, we'll cover:
- Part 1: Building a conversion rate report with traffic source breakdown
- Part 2: Reading the report to identify high-performing and underperforming sources
- Part 3: Setting up signup form triggers based on time delay, scroll percentage, exit intent, and traffic source
Part 1: Creating the Traffic-to-Lead Report
Navigate to Analytics → Insights from the left sidebar. Select the Insights list dropdown and click Create New Insights.
Configure Your Report
-
Set Date Range & Segment — Choose your analysis period and optionally filter by a specific user segment or leave as "All Users".
-
Set Up Event 1 — Page Views (Users Landed): Select Event Page View, Select Event Trend Unique Users. Optionally add a filter for specific landing pages if needed.
Why Unique Users? This ensures each visitor is counted only once, giving you accurate traffic numbers rather than inflated page view counts.
-
Add Event 2 — Form Submissions (Leads Generated): Click + Add More Event, Select Event Form Submission, Select Event Trend Unique Users. Optionally filter by specific form name/ID if you're tracking multiple forms.
-
Conversion Percentage —
-
Configure Breakdown — Set Breakdown By to Event Property and Select Attribute as Traffic Source.
-
Generate the Report — Click the View Insight Report button.
Derived Metrics
The report generates Page View and Form Submission counts with breakdown by traffic source along with:
- Conversion Rate — Form Submissions ÷ Page Views × 100
- % of Total Traffic — Page Views from that source ÷ Total Page Views across all sources × 100
- % of Total Leads — Form Submissions from that source ÷ Total Form Submissions across all sources × 100
Part 2: Understanding Your Report
| Traffic Source | Page Views | Form Submissions | Conversion Rate | % of Total Traffic | % of Total Leads |
|---|---|---|---|---|---|
| Organic Social | 88 | 12 | 13.6% | 20.5% | 17.9% |
| Referral | 83 | 15 | 18.1% | 19.3% | 22.4% |
| Direct | 77 | 8 | 10.4% | 17.9% | 11.9% |
| Organic Search | 69 | 18 | 26.1% | 16.1% | 26.9% |
| Unassigned | 67 | 5 | 7.5% | 15.6% | 7.5% |
| Paid Ads | 45 | 9 | 20.0% | 10.5% | 13.4% |
How to Read the Report
- Traffic Source — Where your visitors came from
- Page Views — Number of unique users who landed on your page
- Form Submissions — Number of unique users who submitted the form
- Conversion Rate — The percentage of visitors who converted. Lower conversion rates highlight your biggest re-engagement opportunities
- % of Total Traffic — Each source's share of overall traffic helps you understand channel dependency
- % of Total Leads — Each source's share of total leads generated. Compare this against % of Total Traffic to spot over-performers and under-performers. For example, Organic Search drives only 16.1% of traffic but contributes 26.9% of leads, it punches well above its weight
Key Insights to Extract
- Identify High-Performing Sources — Which traffic sources have the highest conversion rates? In the example above, Organic Search (26.1%) outperforms all other sources.
- Spot Optimisation Opportunities — Low conversion sources with high traffic are your biggest opportunity. Organic Social drives the most traffic (88 visitors) but converts only 12 (13.6%), that's 76 visitors dropping off with significant room to improve.
- Find Over-Performers and Under-Performers — Organic Search drives only 16.1% of traffic but contributes 26.9% of leads. Direct traffic does the opposite: 17.9% of traffic but only 11.9% of leads.
- Allocate Resources Wisely — Double down on high-converting sources and investigate why certain channels underperform.
Part 3: Increase Leads with Smart Signup Form Triggers
Now that you know which traffic sources need improvement, use targeting rules on your signup forms to capture more leads.
How to Access: Navigate to Optimise → Signup Form. Create a new signup form and go to the Targeting Rules tab, or edit an existing one by clicking the three-dot action button next to your form campaign and selecting Targeting Rules.
Strategy A: Time Delay Trigger
Best for: Giving visitors time to engage with content before showing the form.
- Under the Display Triggers tab, find "Show pop-up after time delay on page"
- Enter delay in seconds
| Page Type | Recommended Delay |
|---|---|
| Blog / articles | 10–15 seconds |
| Product pages | 5–8 seconds |
| Landing pages | 3–5 seconds |
Pro Tip: A/B test different delays to find your sweet spot.
Strategy B: Scroll Percentage Trigger
Best for: Capturing engaged visitors who are actively reading your content.
- Under the Display Triggers tab, find "Show notification on scroll percentage"
- Enter a value between 1 and 100
| Content Type | Recommended Scroll % |
|---|---|
| Long-form articles | 50–60% |
| Product pages | 30–40% |
| Landing pages | 25–35% |
Strategy C: Exit Intent Trigger
Best for: Last-chance capture of visitors about to leave.
- Under the Display Triggers tab, find "Leave Intent Targeting"
- Click "Yes" to enable
The exit intent form triggers when a user moves the cursor toward the browser's address bar or close button, or when tab-switching behaviour is detected.
Best practices for exit intent forms:
- Use compelling headlines: "Wait! Before you go..."
- Offer an incentive: discount, free resource, or exclusive content
- Keep the form simple: email-only or email + name
- Make the close button clearly visible, it builds trust
Strategy D: Traffic Source–Specific Forms
Create different forms with messaging tailored to how each visitor arrived:
| Traffic Source | Form Strategy |
|---|---|
| Organic Social | Offer a social-exclusive discount |
| Organic Search | Provide a downloadable guide related to their search intent |
| Referral | Welcome message mentioning the referrer |
| Direct | Loyalty or VIP signup messaging |
How to set up traffic-based targeting:
In Targeting Rules, go to the Traffic Source tab and select the relevant source:
- Search Engine — Shows the form to visitors arriving from any of 40+ major search engines. You can also specify search keywords to target visitors from specific search terms, or leave blank to include all search engine traffic.
- Social Media — Shows the form to visitors arriving from Facebook, Twitter, LinkedIn, or Google+.
- Direct Traffic — Shows the form to visitors who typed your site URL directly into the browser.
- Custom Referrers — Shows the form to visitors arriving from specific referring sites. You can add multiple URL rules to target multiple referrers.
The form will only display to visitors arriving from the selected traffic source.
Go through our Targeting Rules Guide for detailed targeting rule documentation.
Conclusion
Driving traffic is only half the battle; converting that traffic into leads is where the real value lies. With this recipe, you now have a complete workflow to measure your traffic-to-lead conversion by source, identify which channels are underperforming, and act on it using smart signup form triggers tailored to visitor behaviour and traffic source.
Review Cycle: Check your traffic-to-lead report weekly and adjust targeting rules based on performance data.
Got questions? Ask our AI Copilot for instant answers or reach out to our support team at support@nvecta.com — we're here to help.