Measuring advertising performance typically means switching between ad platforms and your analytics tool, manually exporting data, and stitching metrics together to understand what's working. With this update, NVECTA brings your synced ad data directly into the Reports section, allowing you to analyse key advertising metrics — impressions, clicks, spend, and conversions — alongside the rest of your behavioural analytics.
Where to find it
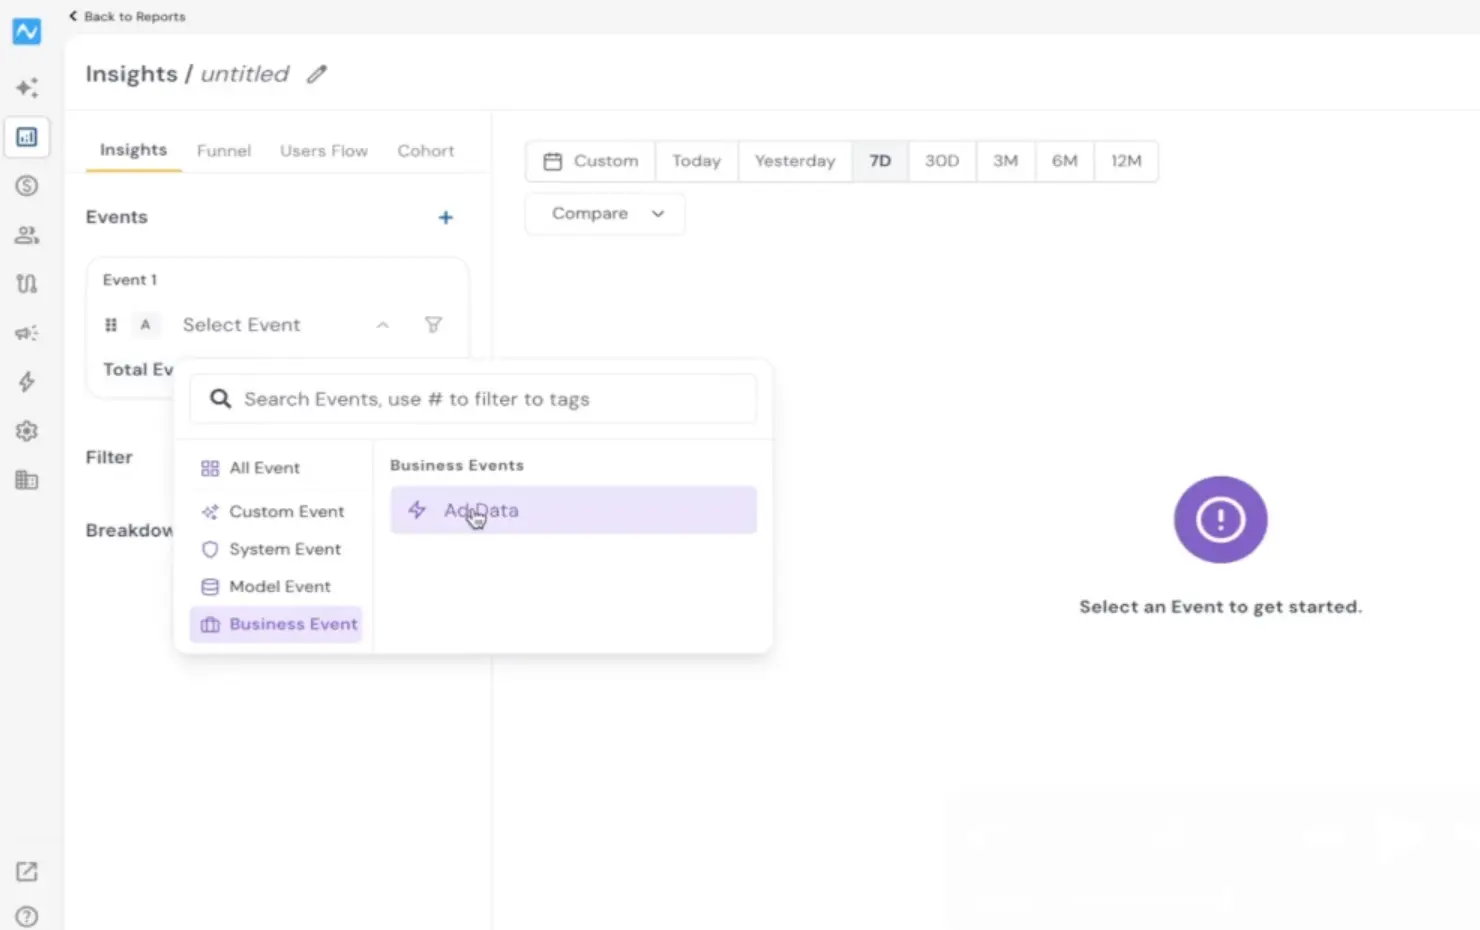
Go to Analytics → Reports. Click Select Event, then choose Business Event from the event category list on the left. Select Ad Data to load your synced advertising data.
If you're new to the Reports section, refer to the Introducing Reports changelog to understand the full capabilities of this unified analysis tool.
How to use it
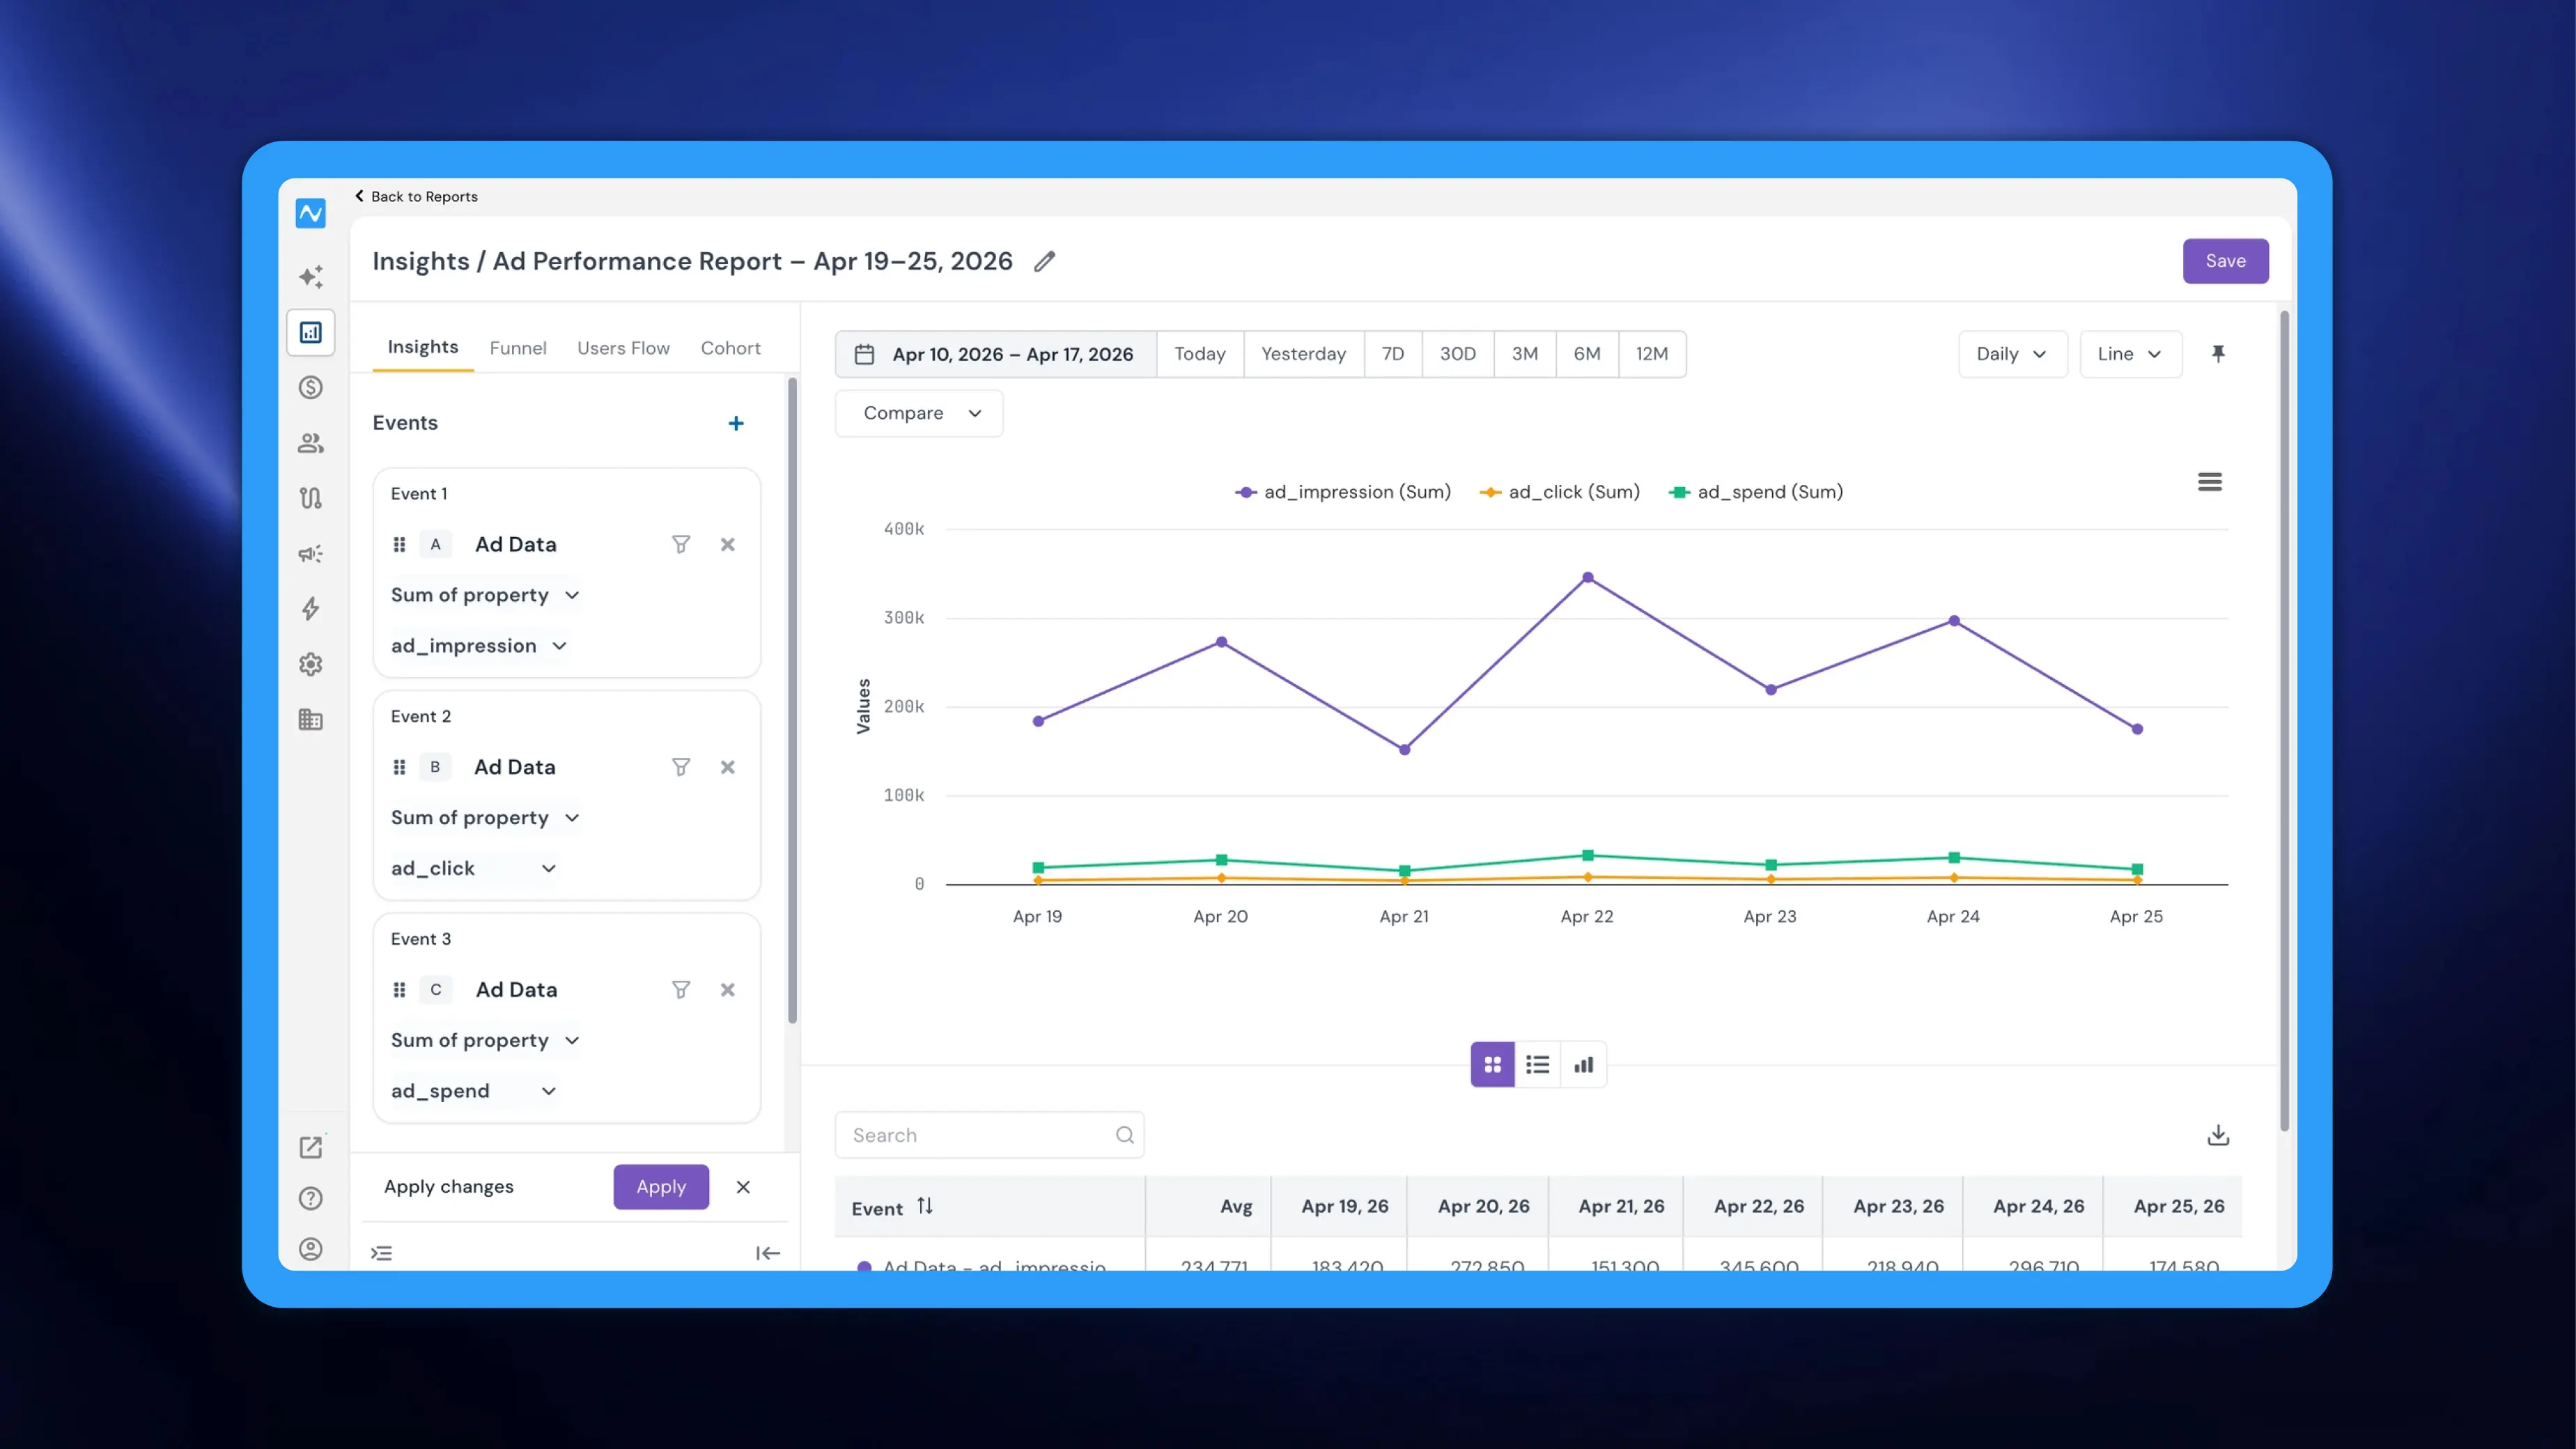
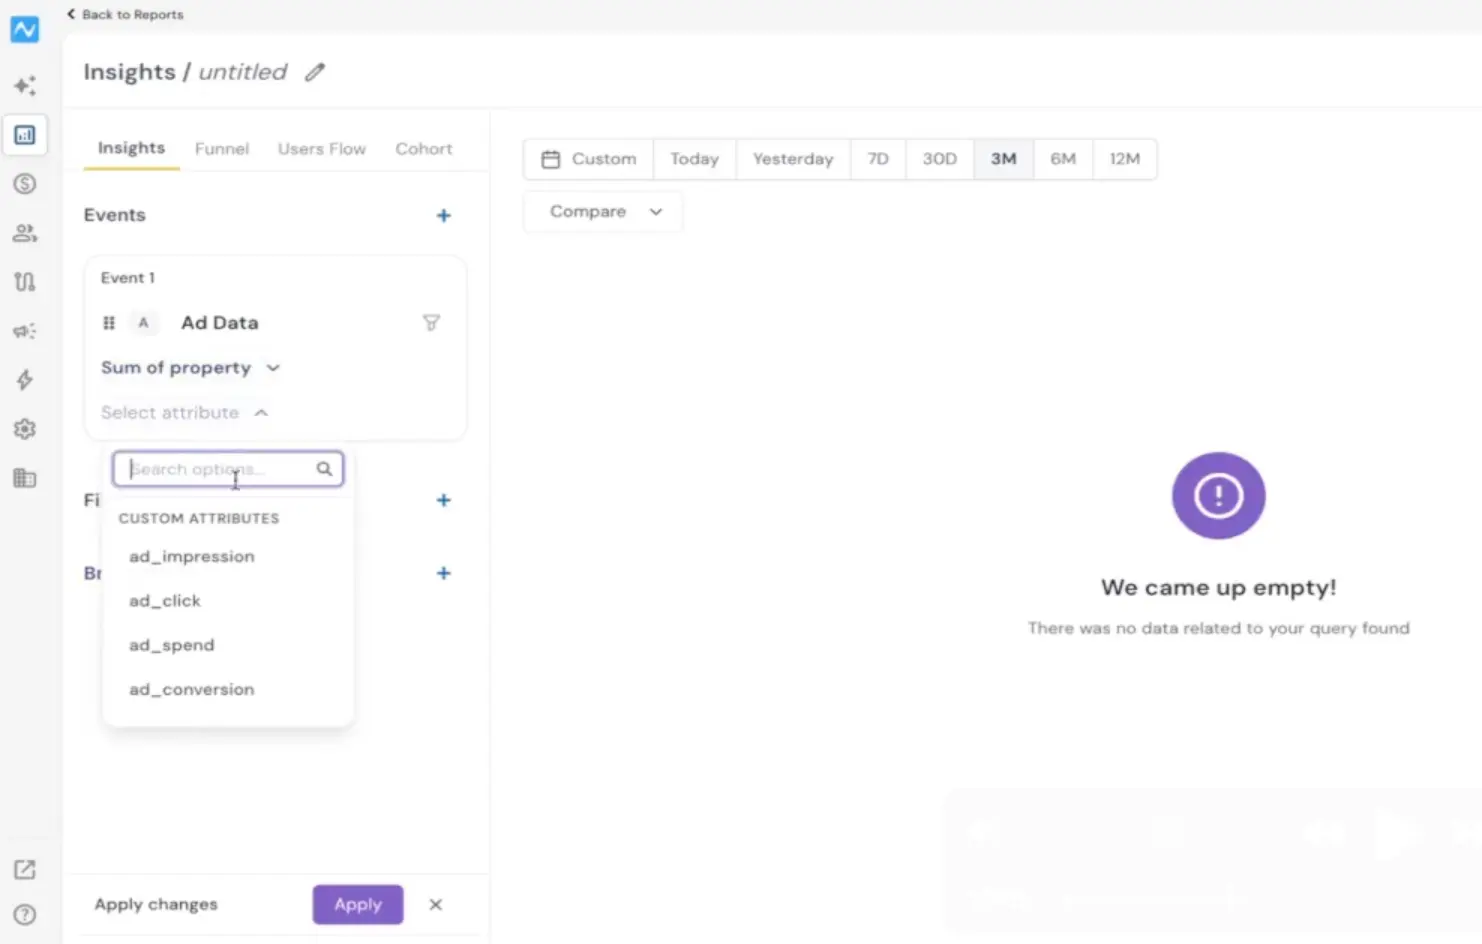
Once you select the Ad Data business event, choose Sum of property from the metric dropdown. The attribute dropdown then lets you pick the specific metric you want to analyse — ad_impression, ad_click, ad_spend, or ad_conversion.
To compare multiple ad metrics side by side, click the + icon next to Events to add additional event sections. For each new event, select Ad Data again, set the metric to Sum of property, and pick a different attribute. For example, you can configure three events to view impressions, clicks, and spend together on the same chart and table.
Click Apply to generate the report.
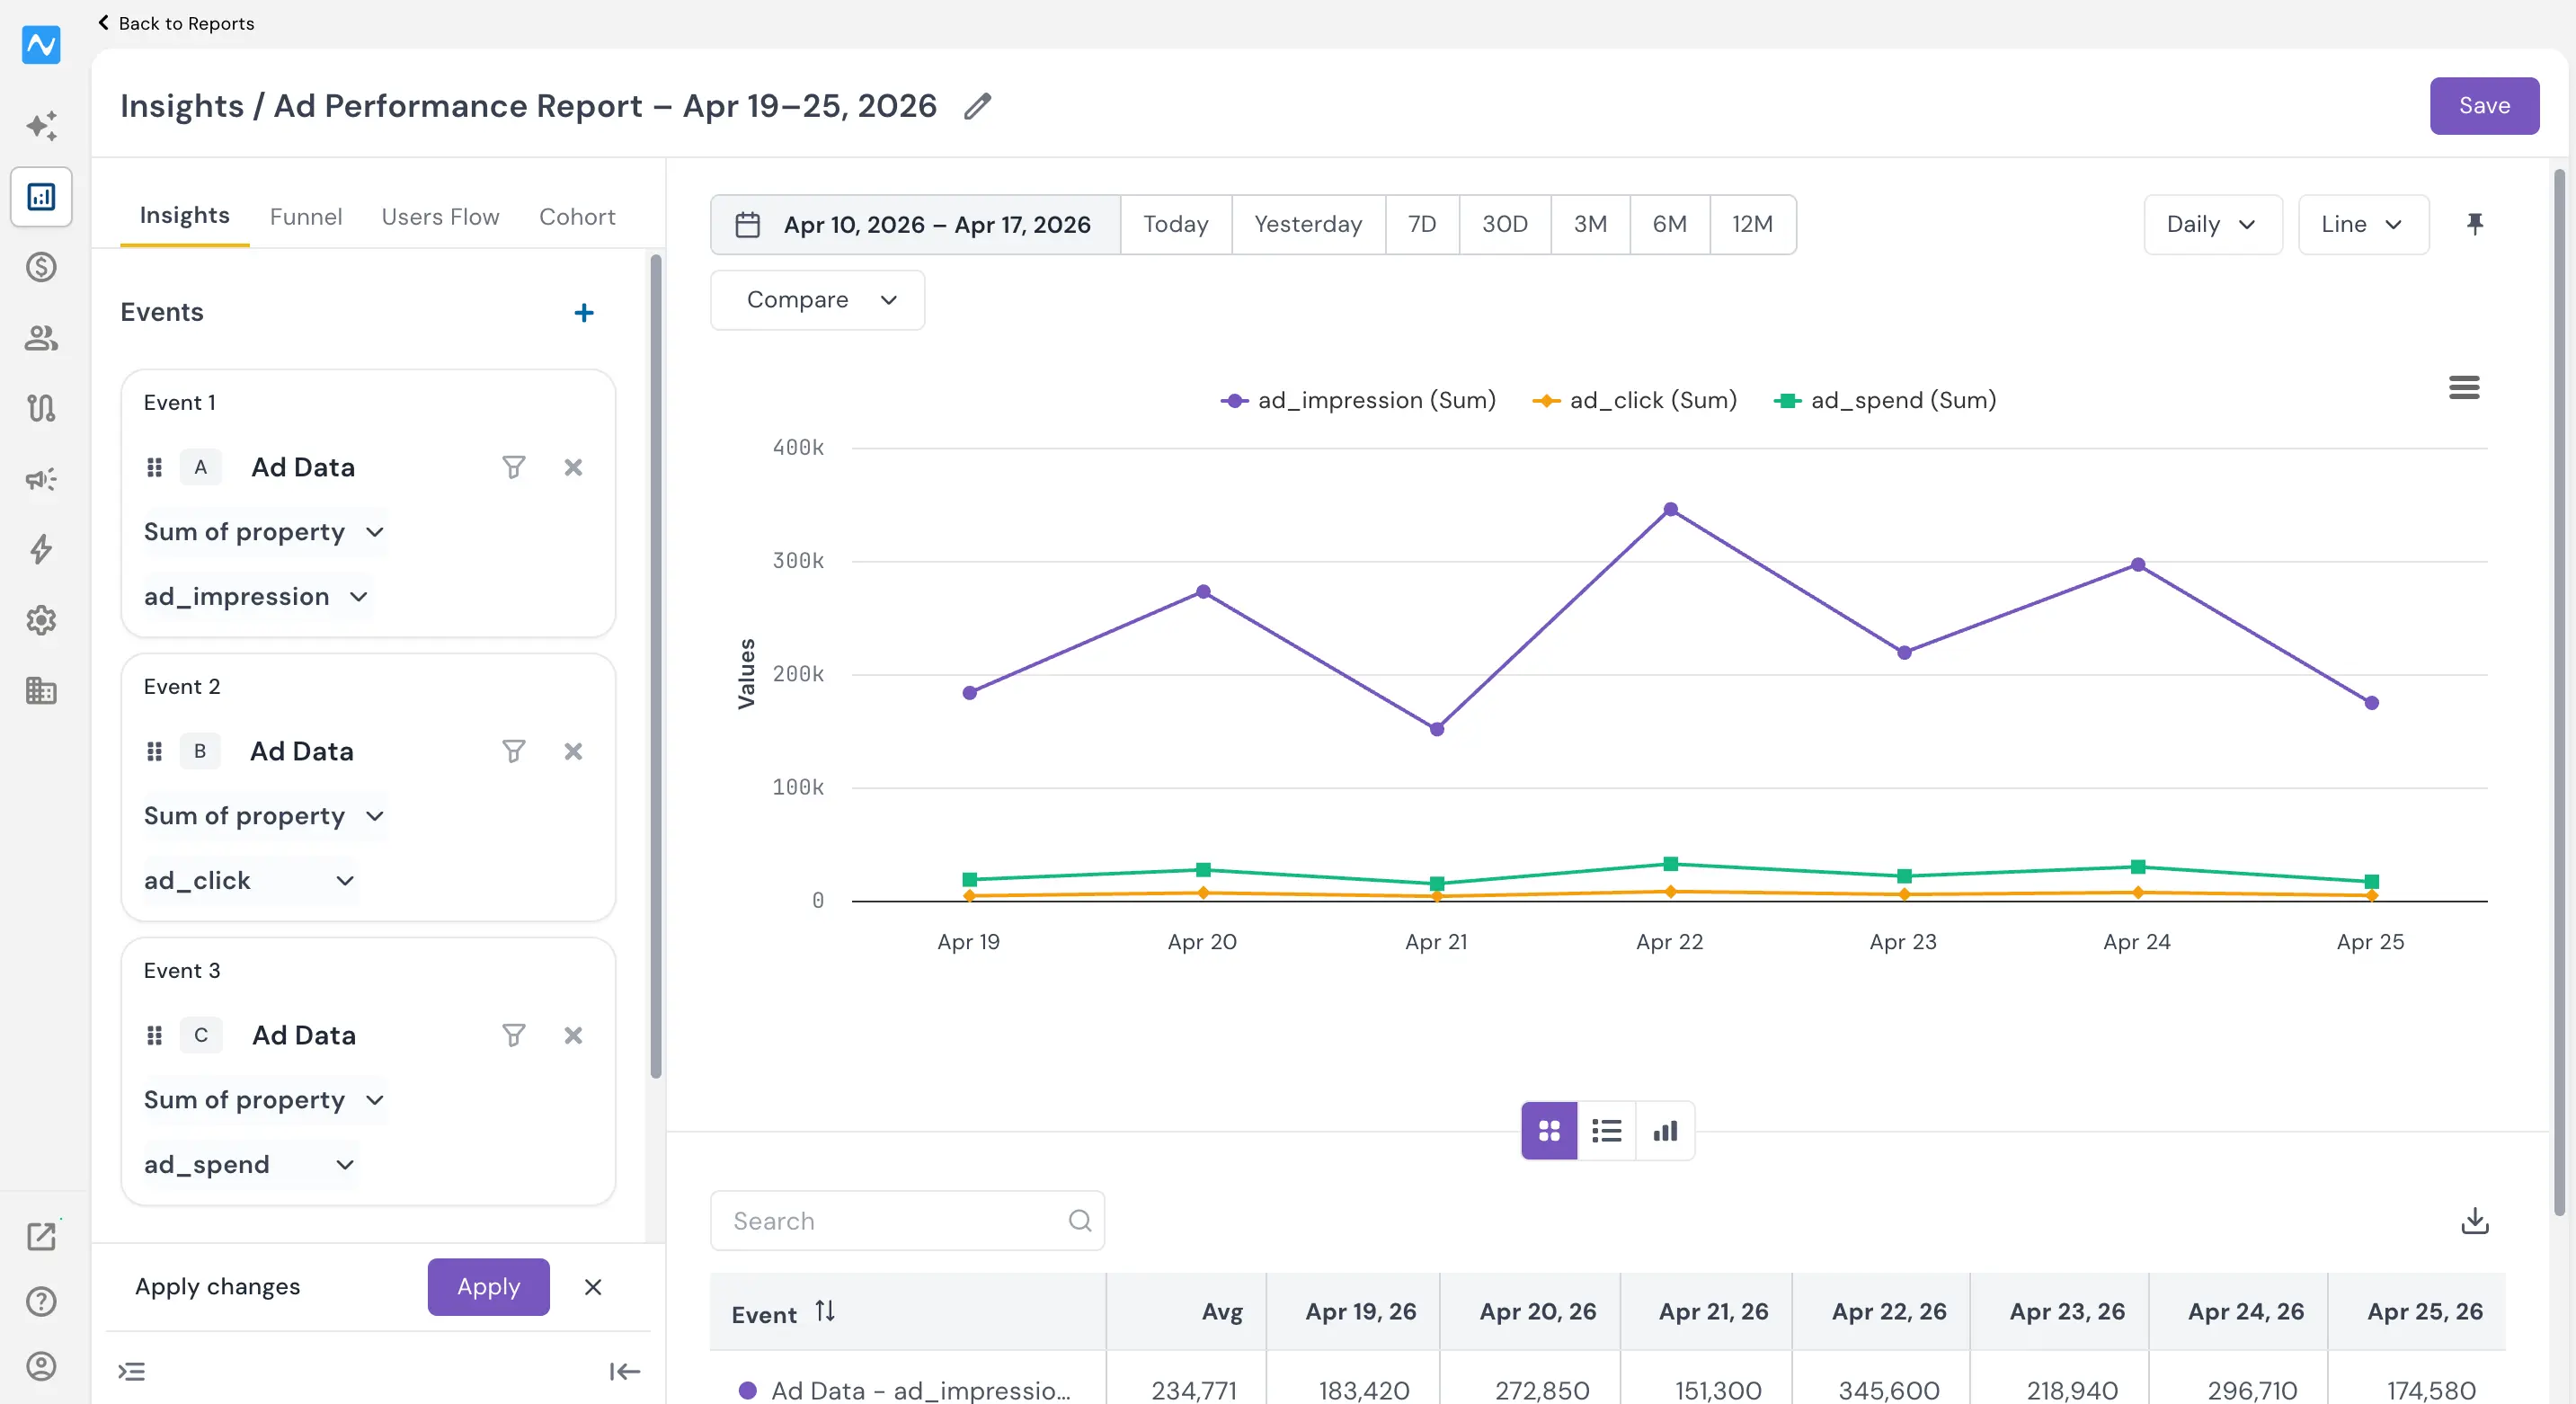
The report renders a trend line for each metric across your selected date range, with a summary table below showing averages and daily breakdowns. You can adjust the time range using the date filter presets (Today, 7D, 30D, 3M, 6M, 12M) and switch between chart types for the view that suits your analysis best. All standard Reports features — filters, breakdowns, granularity controls, and the ability to switch between Insights, Funnel, Users Flow, and Cohort tabs — work seamlessly with ad data events.
By surfacing ad impressions, clicks, spend, and conversions as a business event inside Reports, NVECTA eliminates the context-switching and gives teams a single place to correlate ad performance with on-site engagement and conversions.