The Insights report now supports attribution-based breakdown, allowing you to slice any event by traffic source, campaign, ad partner, or other touchpoint dimensions — and see exactly which channels are contributing to conversions, revenue, and other key outcomes. Combined with multiple breakdown attributes and a flexible lookback window, this update turns Insights from a trend-comparison tool into a true channel performance analyser.
Where to find it
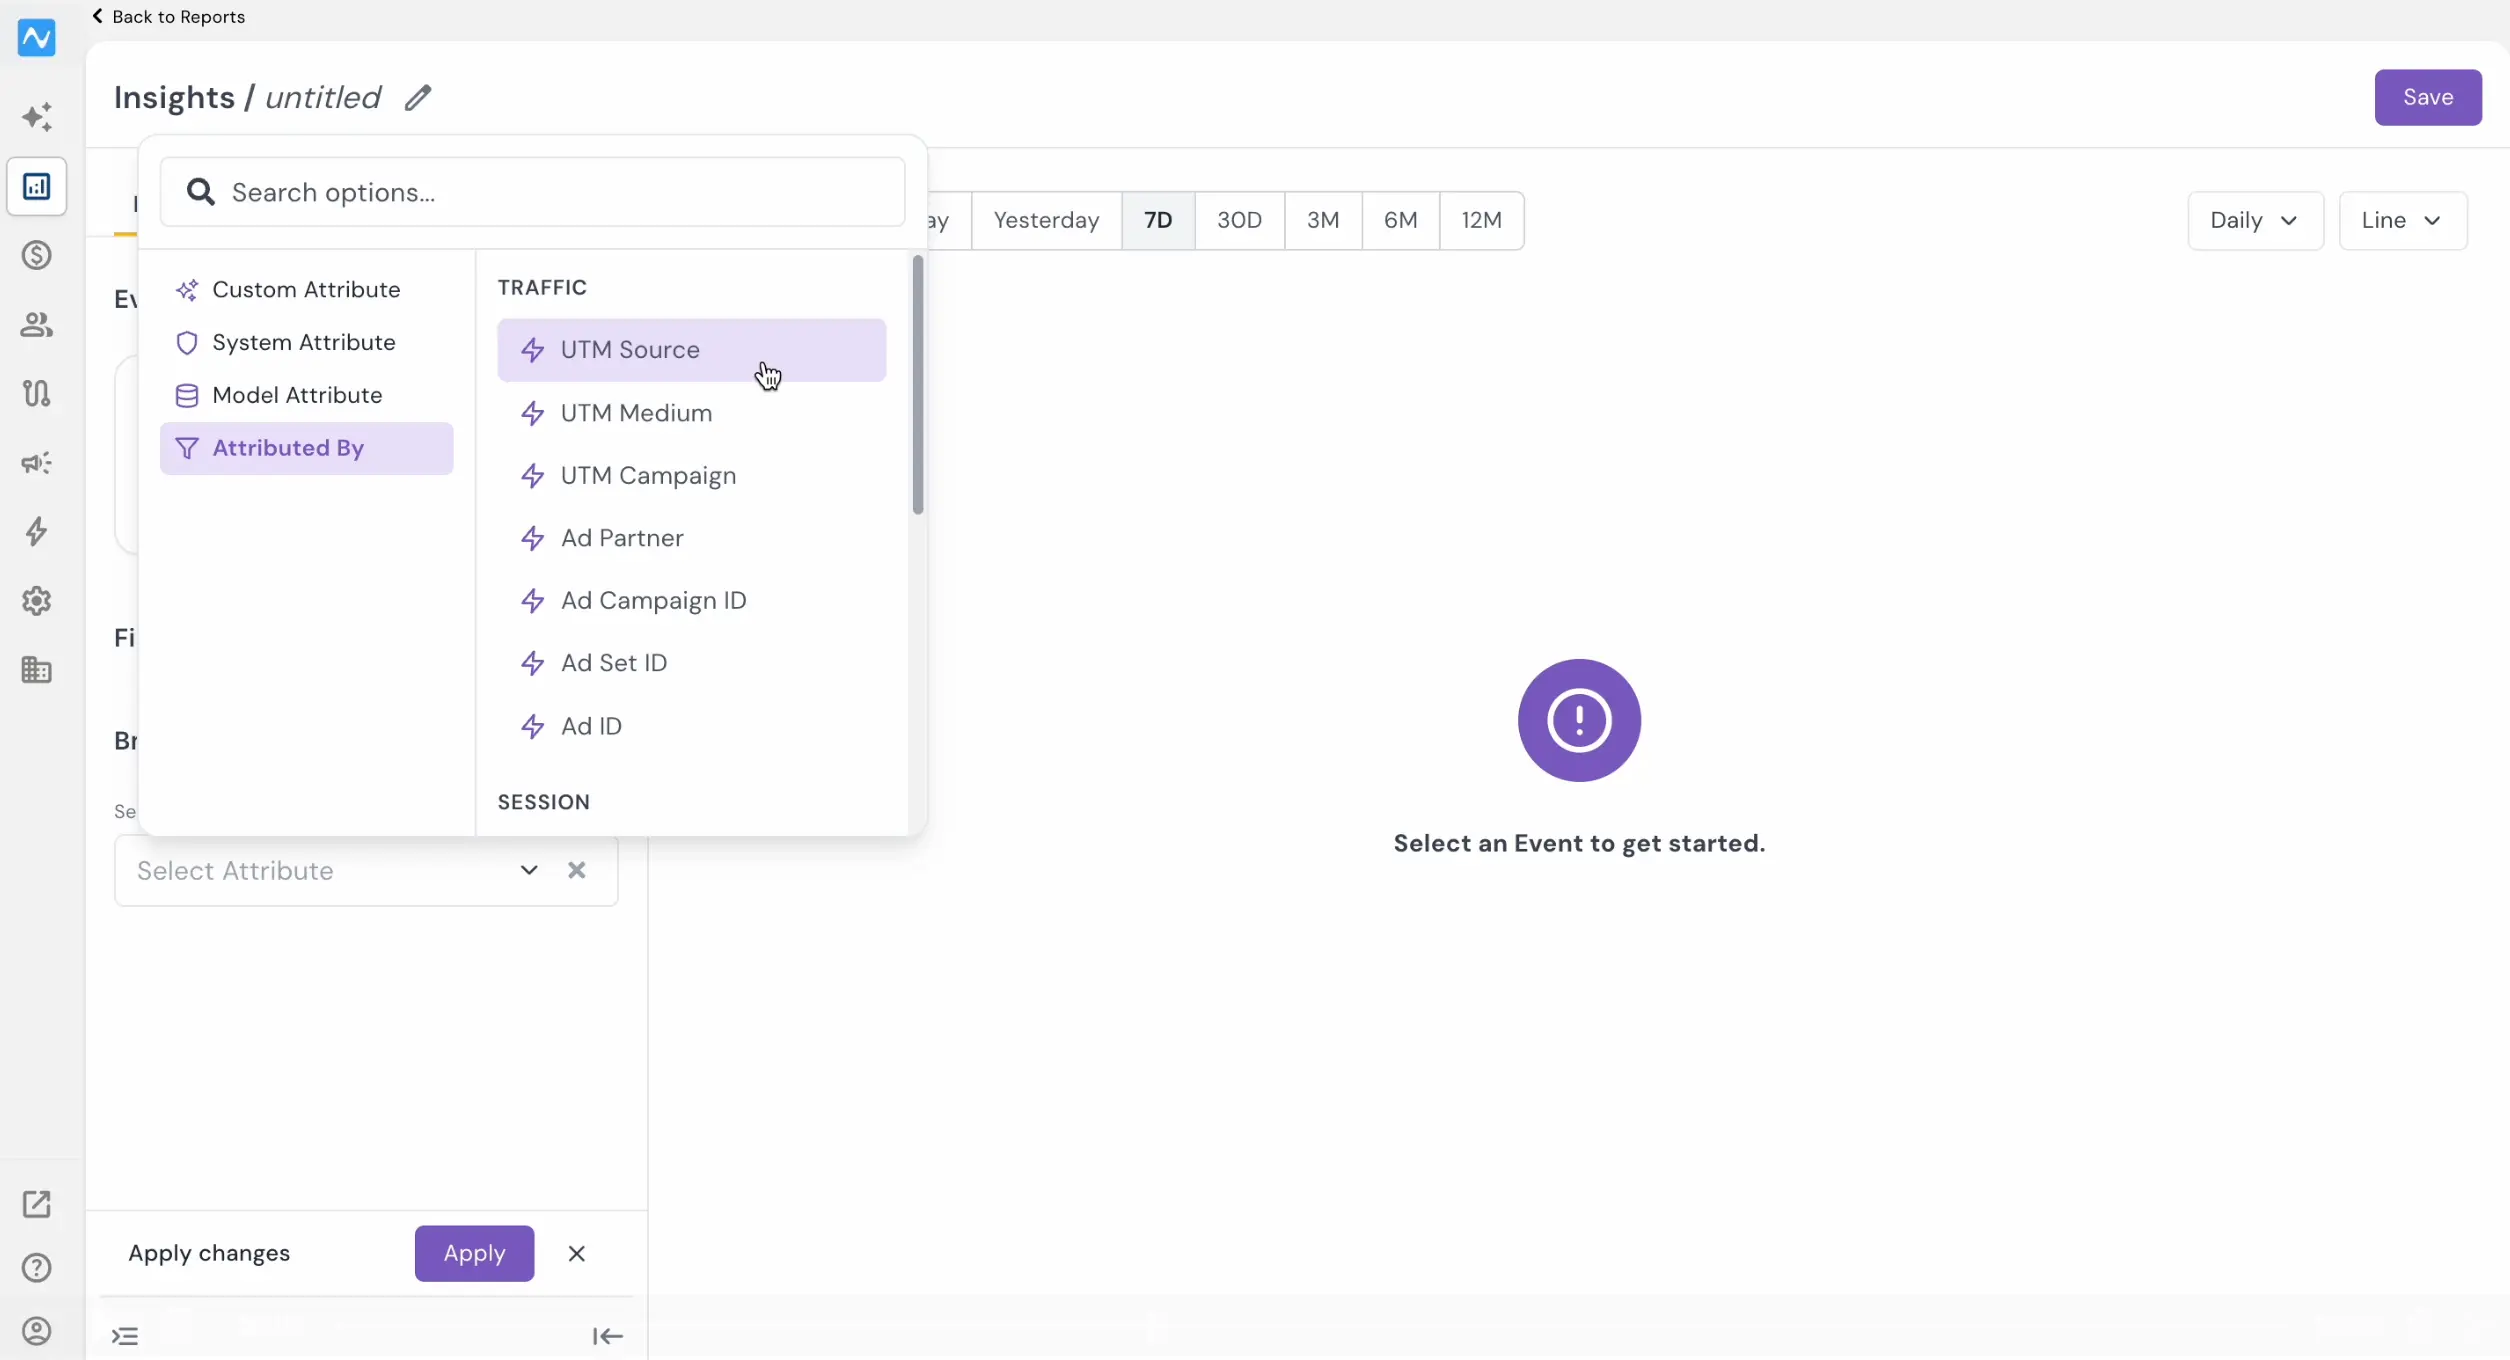
Go to Analytics → Reports. Open or create a new Insights report. In the Breakdown section (below the Events and Filter sections), click the + icon and open the Select Attribute dropdown. You'll see a new Attributed By category alongside Custom Attribute, System Attribute, and Model Attribute. The Attributed By category includes traffic, session, and campaign-level attributes.
For a detailed overview of the Reports section, refer to the Introducing Reports changelog.
How it works
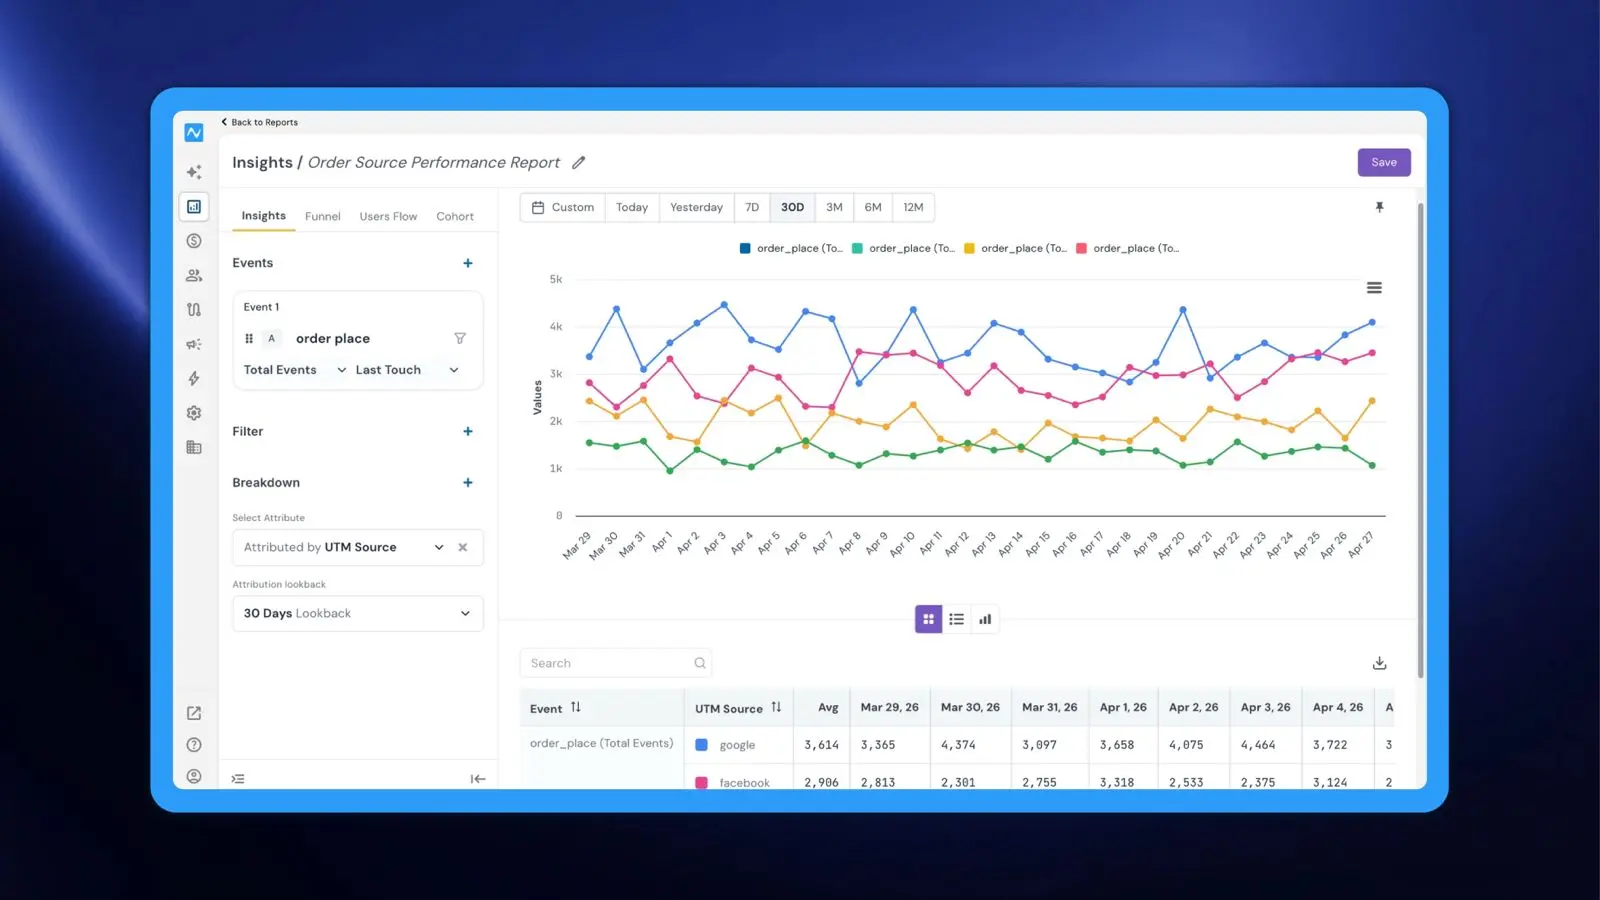
Suppose you want to understand which traffic sources are driving the most orders.
Start by selecting order place in the Events panel. Set the metric to Total Events — this ensures you're measuring how many orders each source is generating.
Next, scroll down to Breakdown, click +, and select Attributed by UTM Source from the dropdown. Once selected, two additional controls appear: an attribution model dropdown on the event card (choose from Last Touch, First Touch, Linear, or Participation) and an Attribution lookback window below the breakdown (e.g., 30 Days). The lookback window controls how far back NVECTA looks for a qualifying marketing touchpoint before each conversion.
Click Apply to generate the report.
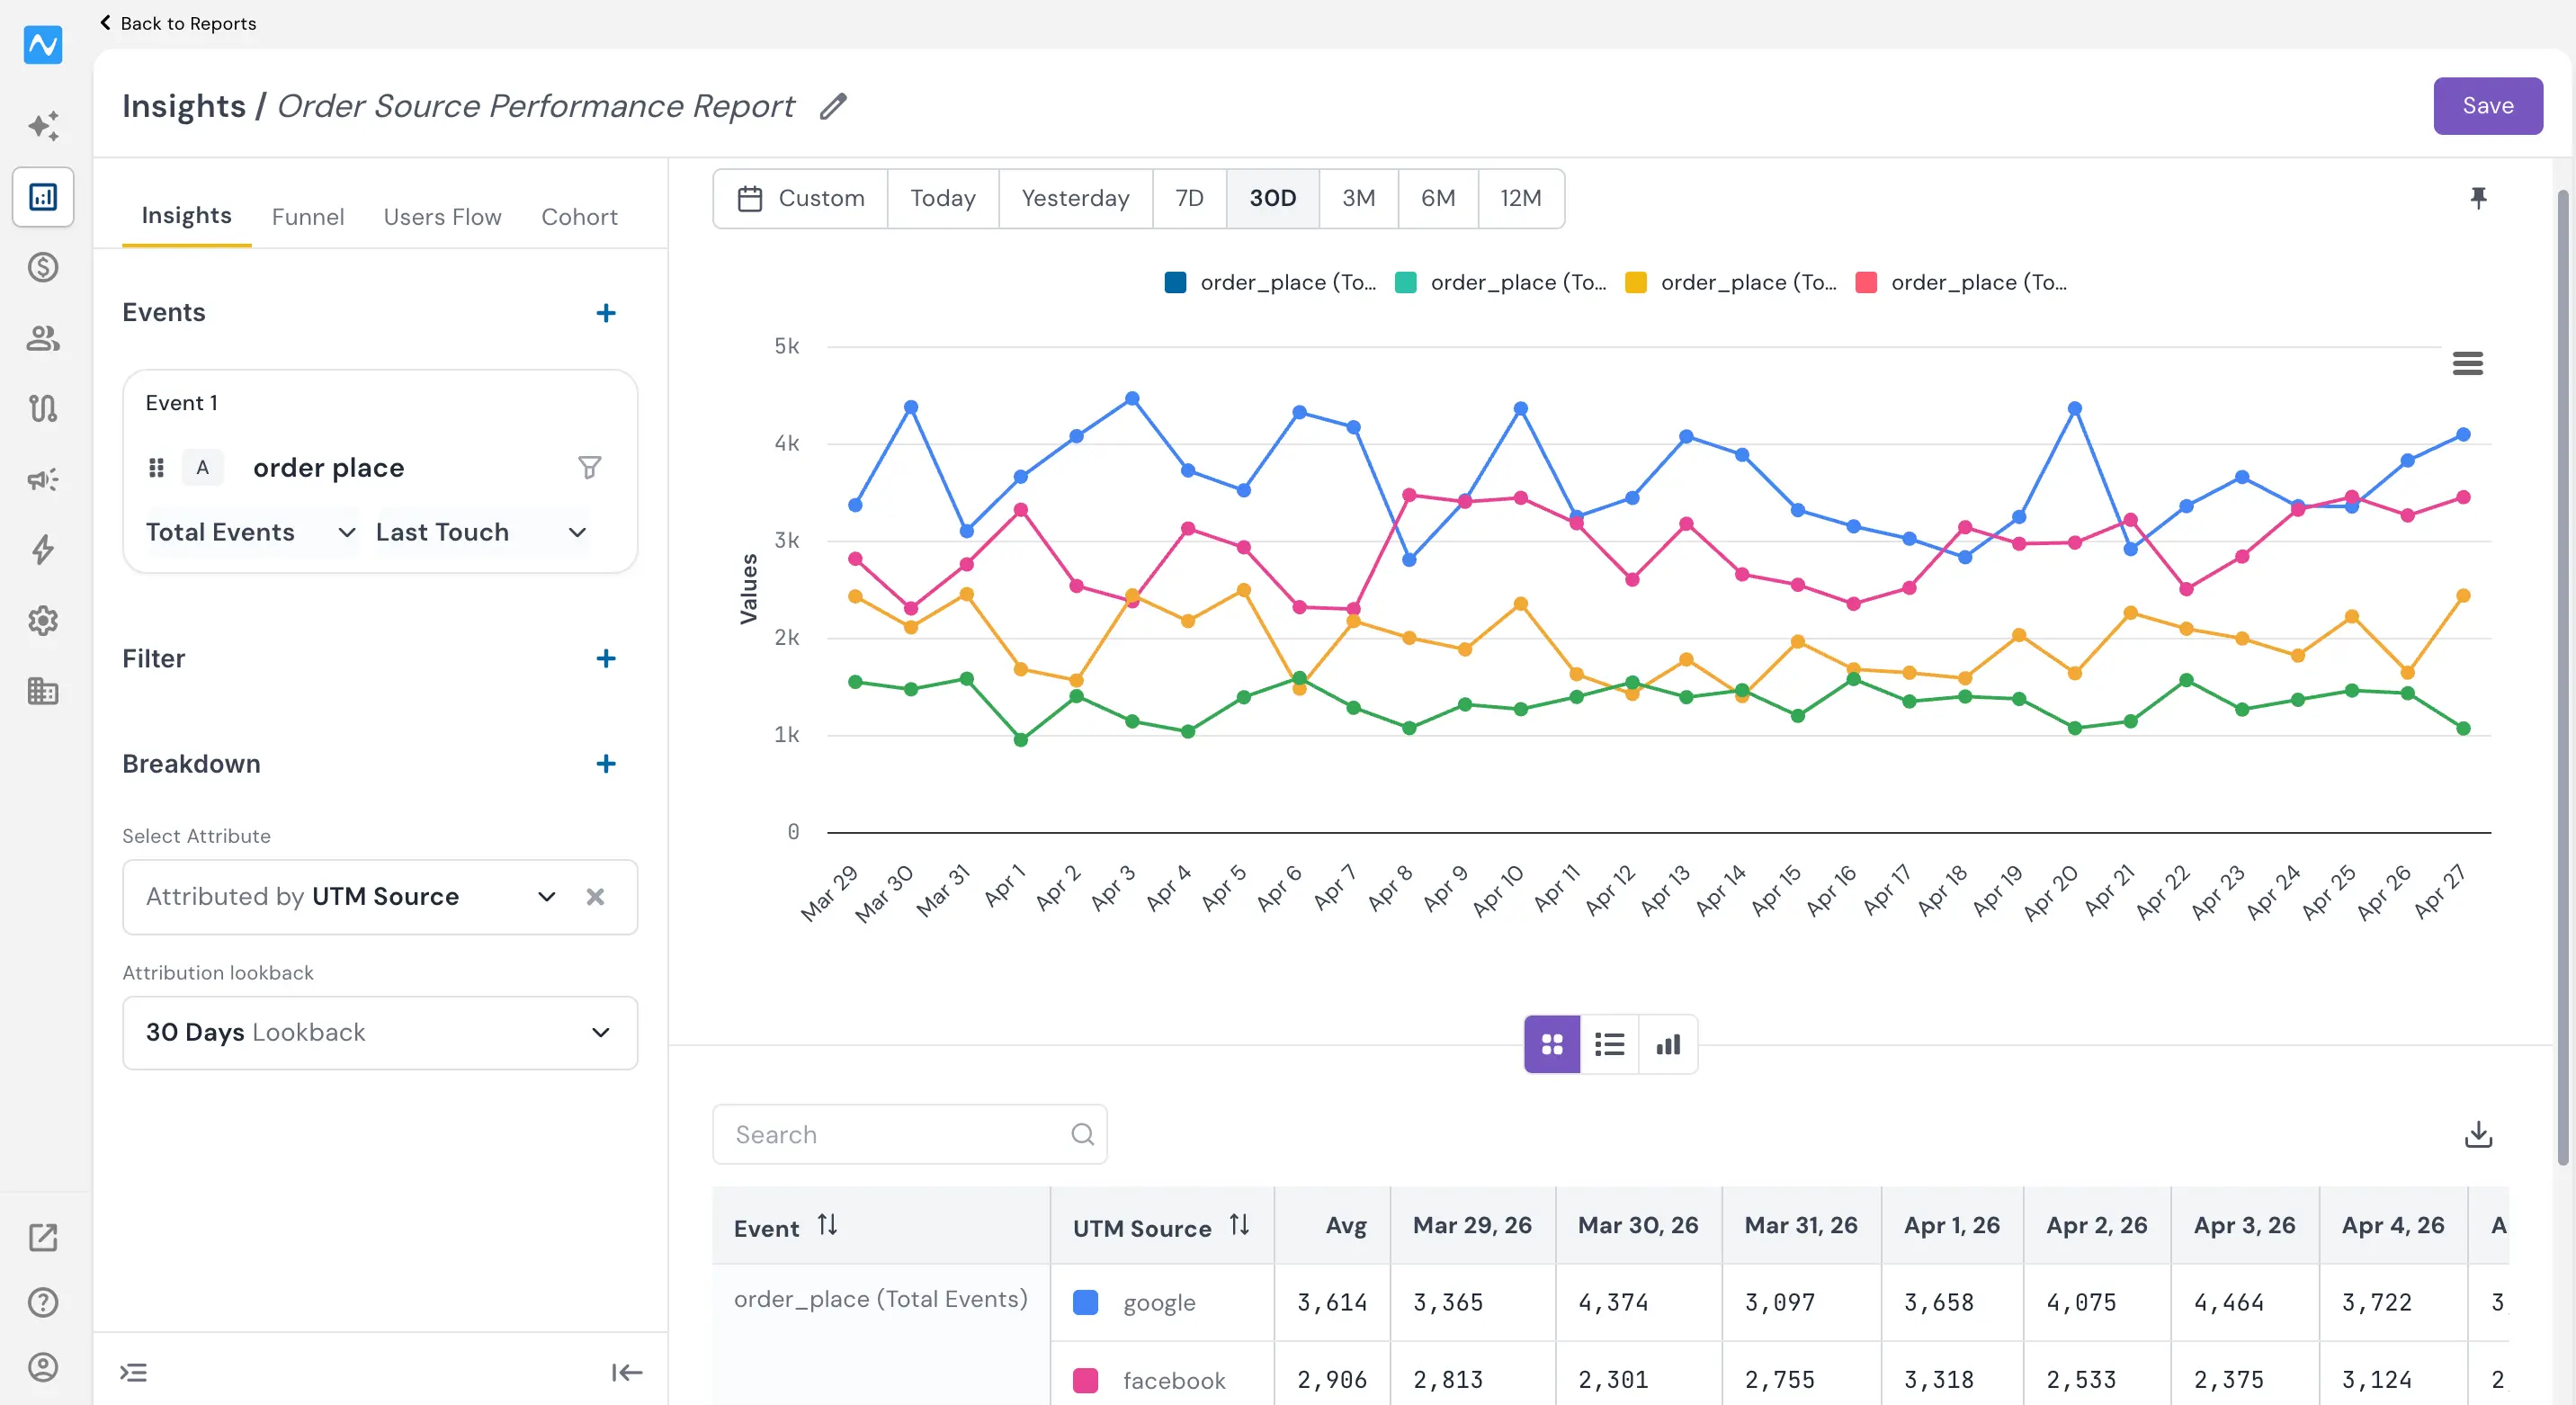
The chart immediately splits into separate colour-coded trend lines — one per UTM source — and the data table below shows total event counts broken out by UTM source and date. For example, over a 30-day window you might see that Google averages 3,614 order place events per day, peaking at 4,464 on Apr 3 and dipping to 3,097 on Mar 31, while facebook averages 2,906 events per day, ranging from 2,301 on Mar 30 to 3,318 on Apr 1. This makes it immediately clear which channels are performing and how their contribution trends over time.
The attribution model you select changes how credit is assigned: Last Touch credits the final touchpoint before conversion, First Touch credits the entry point that first brought the user in, Linear splits credit equally across all touchpoints, and Participation gives full credit to every channel in the path. You can switch between models to see how the picture changes — a channel that looks modest under Last Touch might turn out to be a strong top-of-funnel driver under First Touch.
All standard Insights capabilities — date filters, chart types, Compare, Formula, and common filters — continue to work alongside attribution breakdowns, letting you layer time comparisons or calculated metrics on top of your channel-level analysis.
Problem it solves
Knowing that your order placed event fired 430 times last month is useful — but it doesn't tell you whether that revenue came from Google Ads, an email campaign, or organic search.
Attribution breakdown solves this by linking each event occurrence back to the marketing touchpoint that preceded it and presenting the data per source in both the chart and comparison table — all within the same Insights view. This eliminates the need for separate channel reports and gives analysts, marketers, and growth teams a fast, complete picture for budget and strategy decisions.
Attribution breakdown in Insights closes the gap between "what happened" and "who drove it" — directly inside the tool where you already analyse your events.