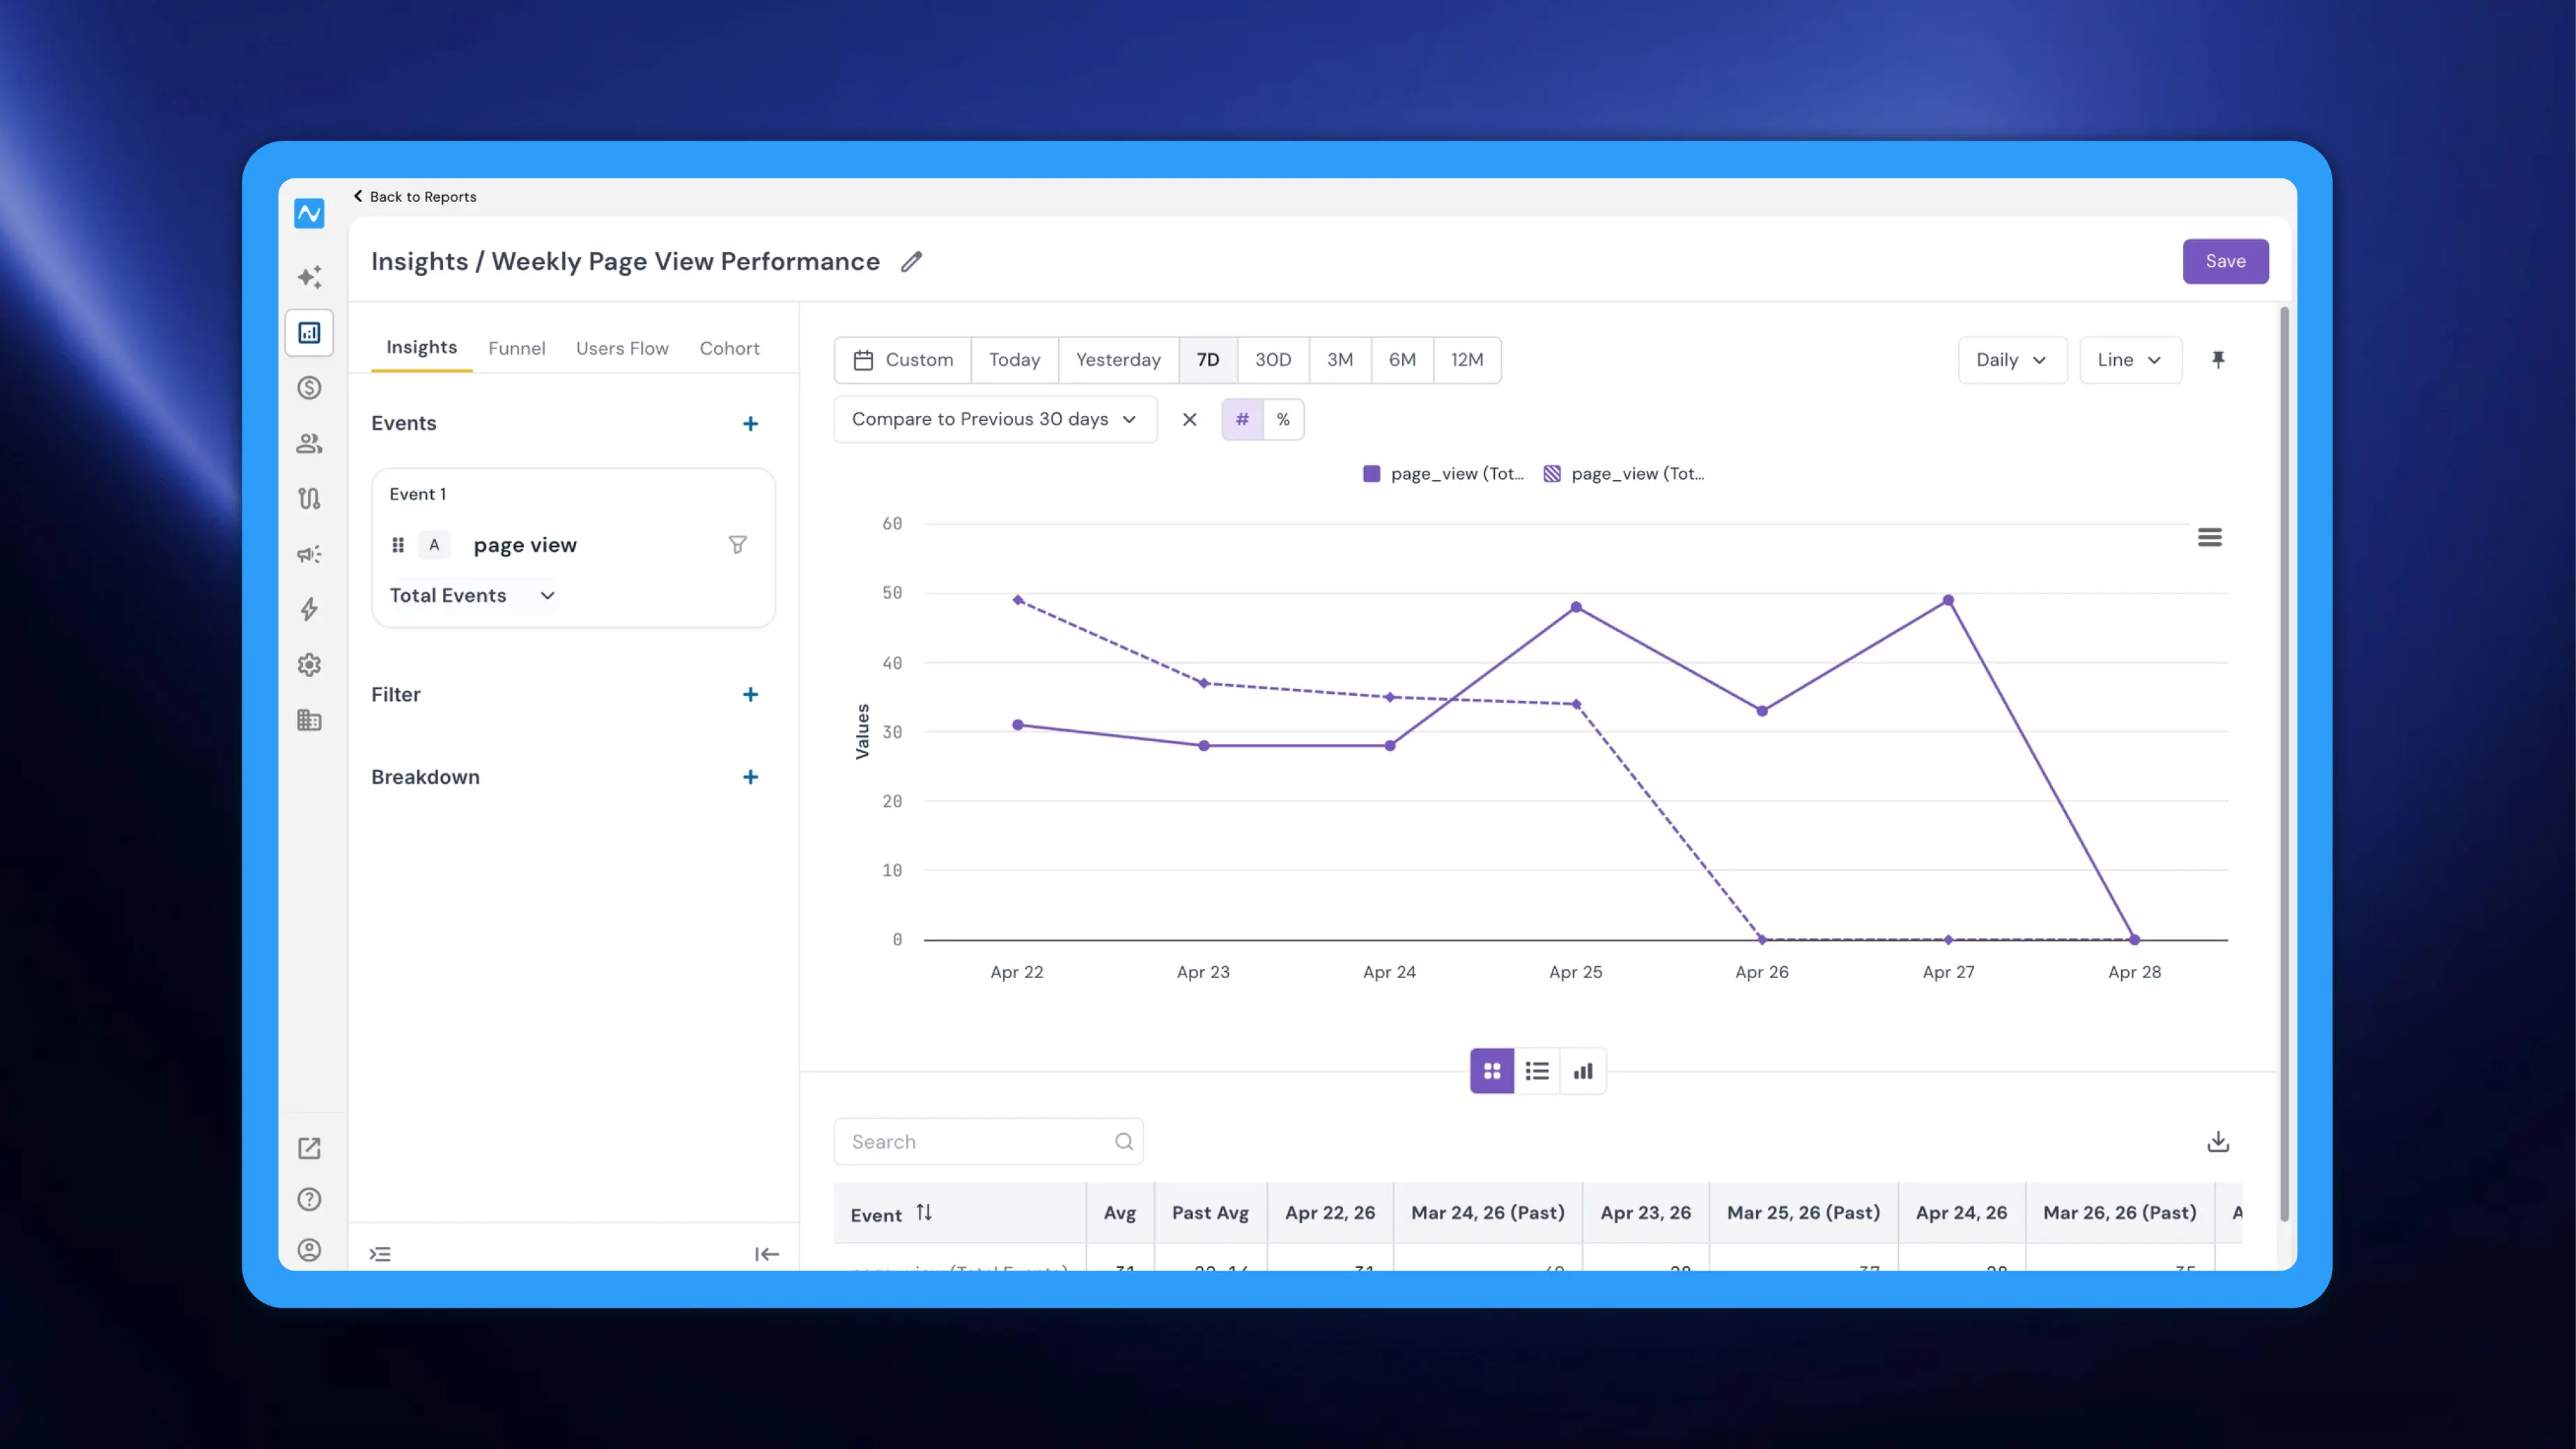
Understanding whether your metrics are improving or declining requires context, and that context usually means comparing against a previous time period. Until now, viewing current and historical data side by side in Reports required exporting data or switching between date ranges manually. NVECTA now introduces a Compare feature directly within the Insights and Funnel report types, allowing you to overlay current data with a past time period in a single view, complete with absolute and percentage change indicators.
Where to find it
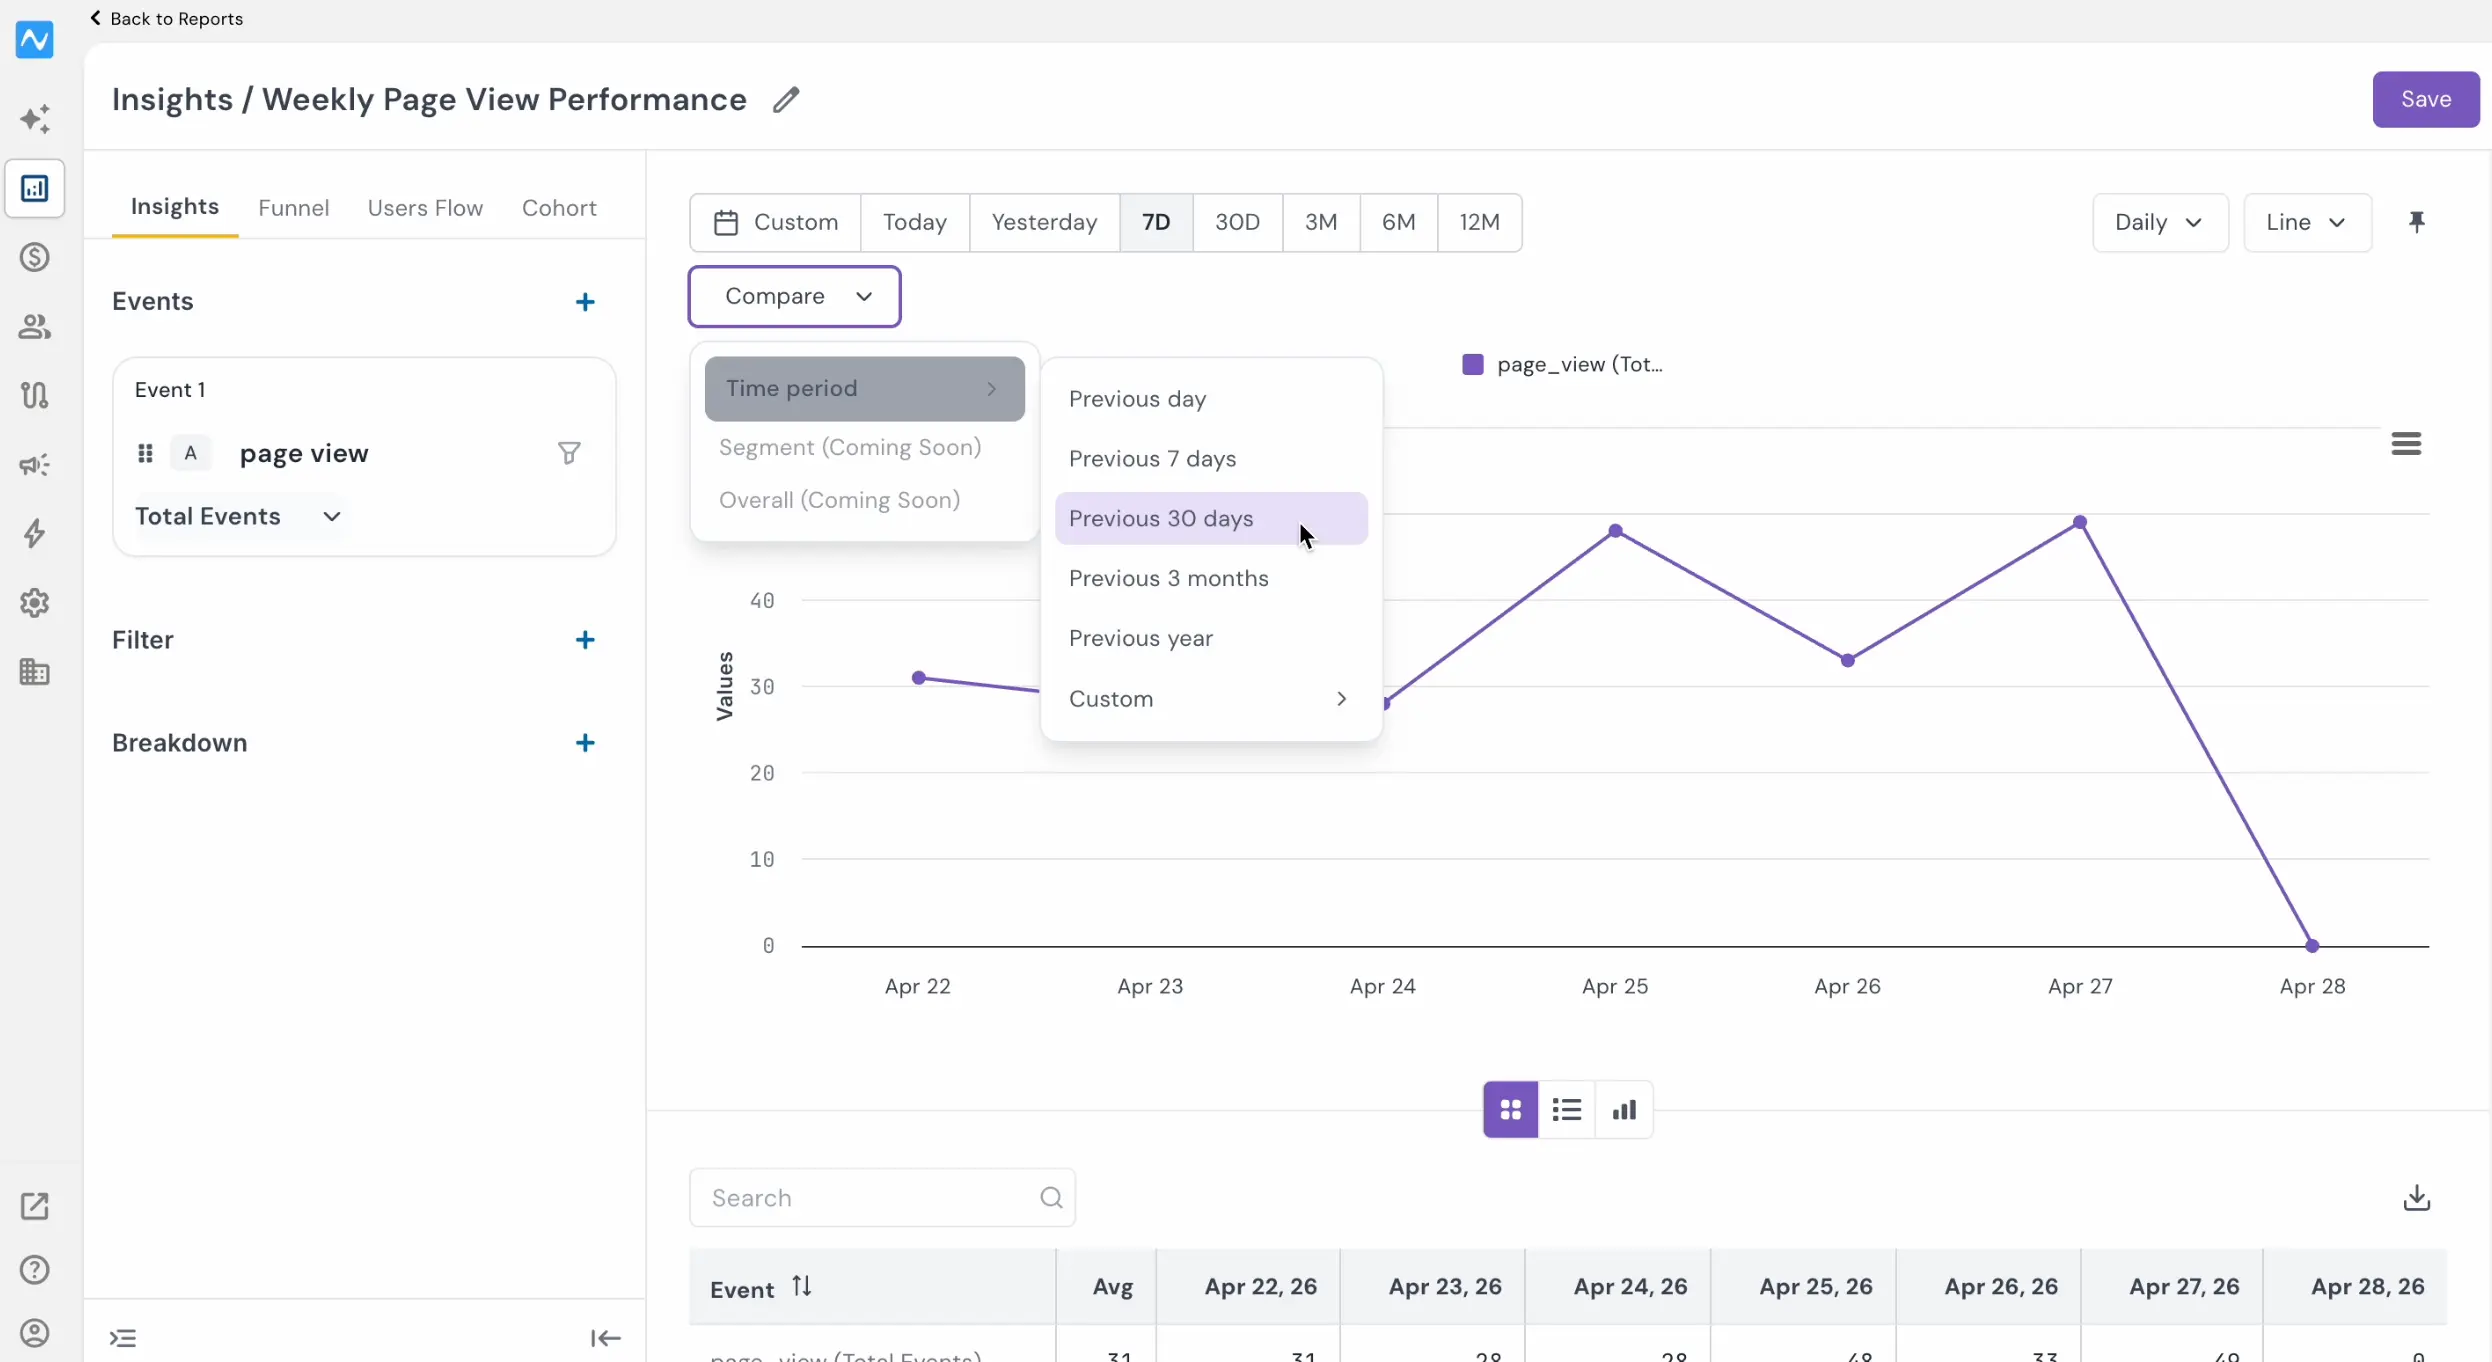
Go to Analytics → Reports and open or create an Insights or Funnel report. Click the Compare dropdown located below the date filter bar. Under Time period, select your comparison window: Previous day, Previous 7 days, Previous 30 days, Previous 3 months, Previous year, or a Custom range. Two additional comparison modes — Segment and Overall — are coming soon.
If you're new to the Reports section, refer to the Introducing Reports changelog for a complete overview of the unified analysis tool.
How it works
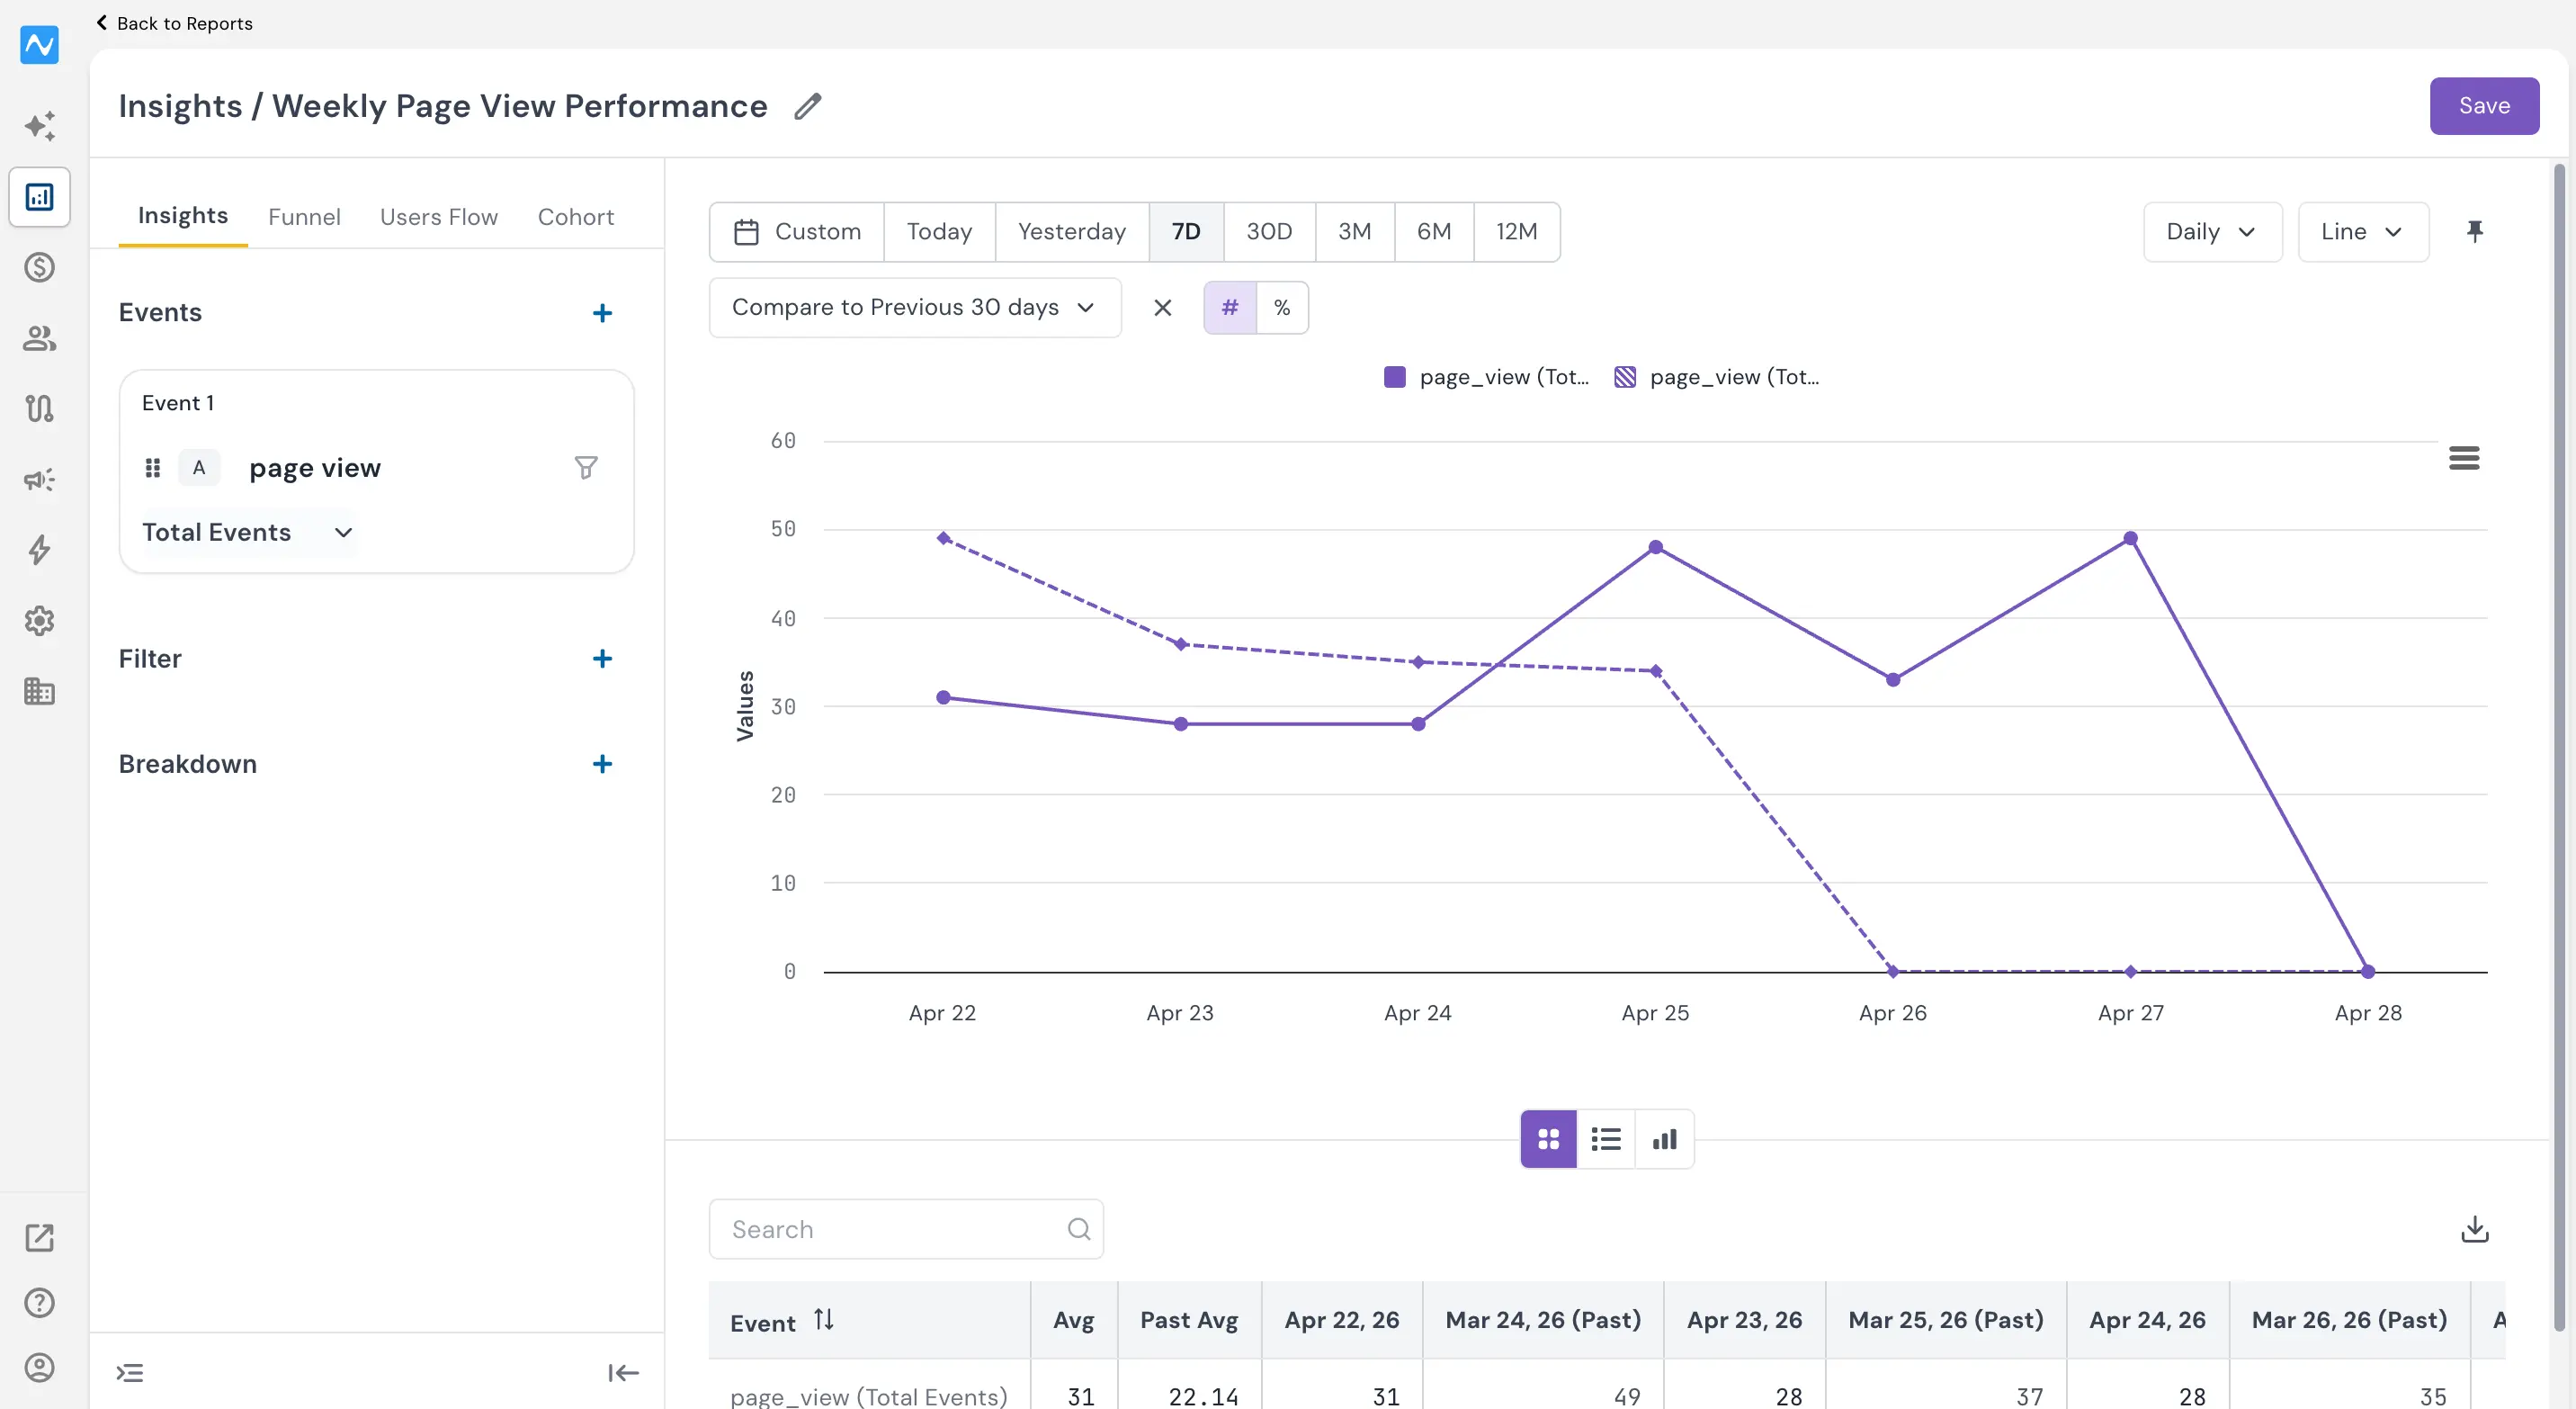
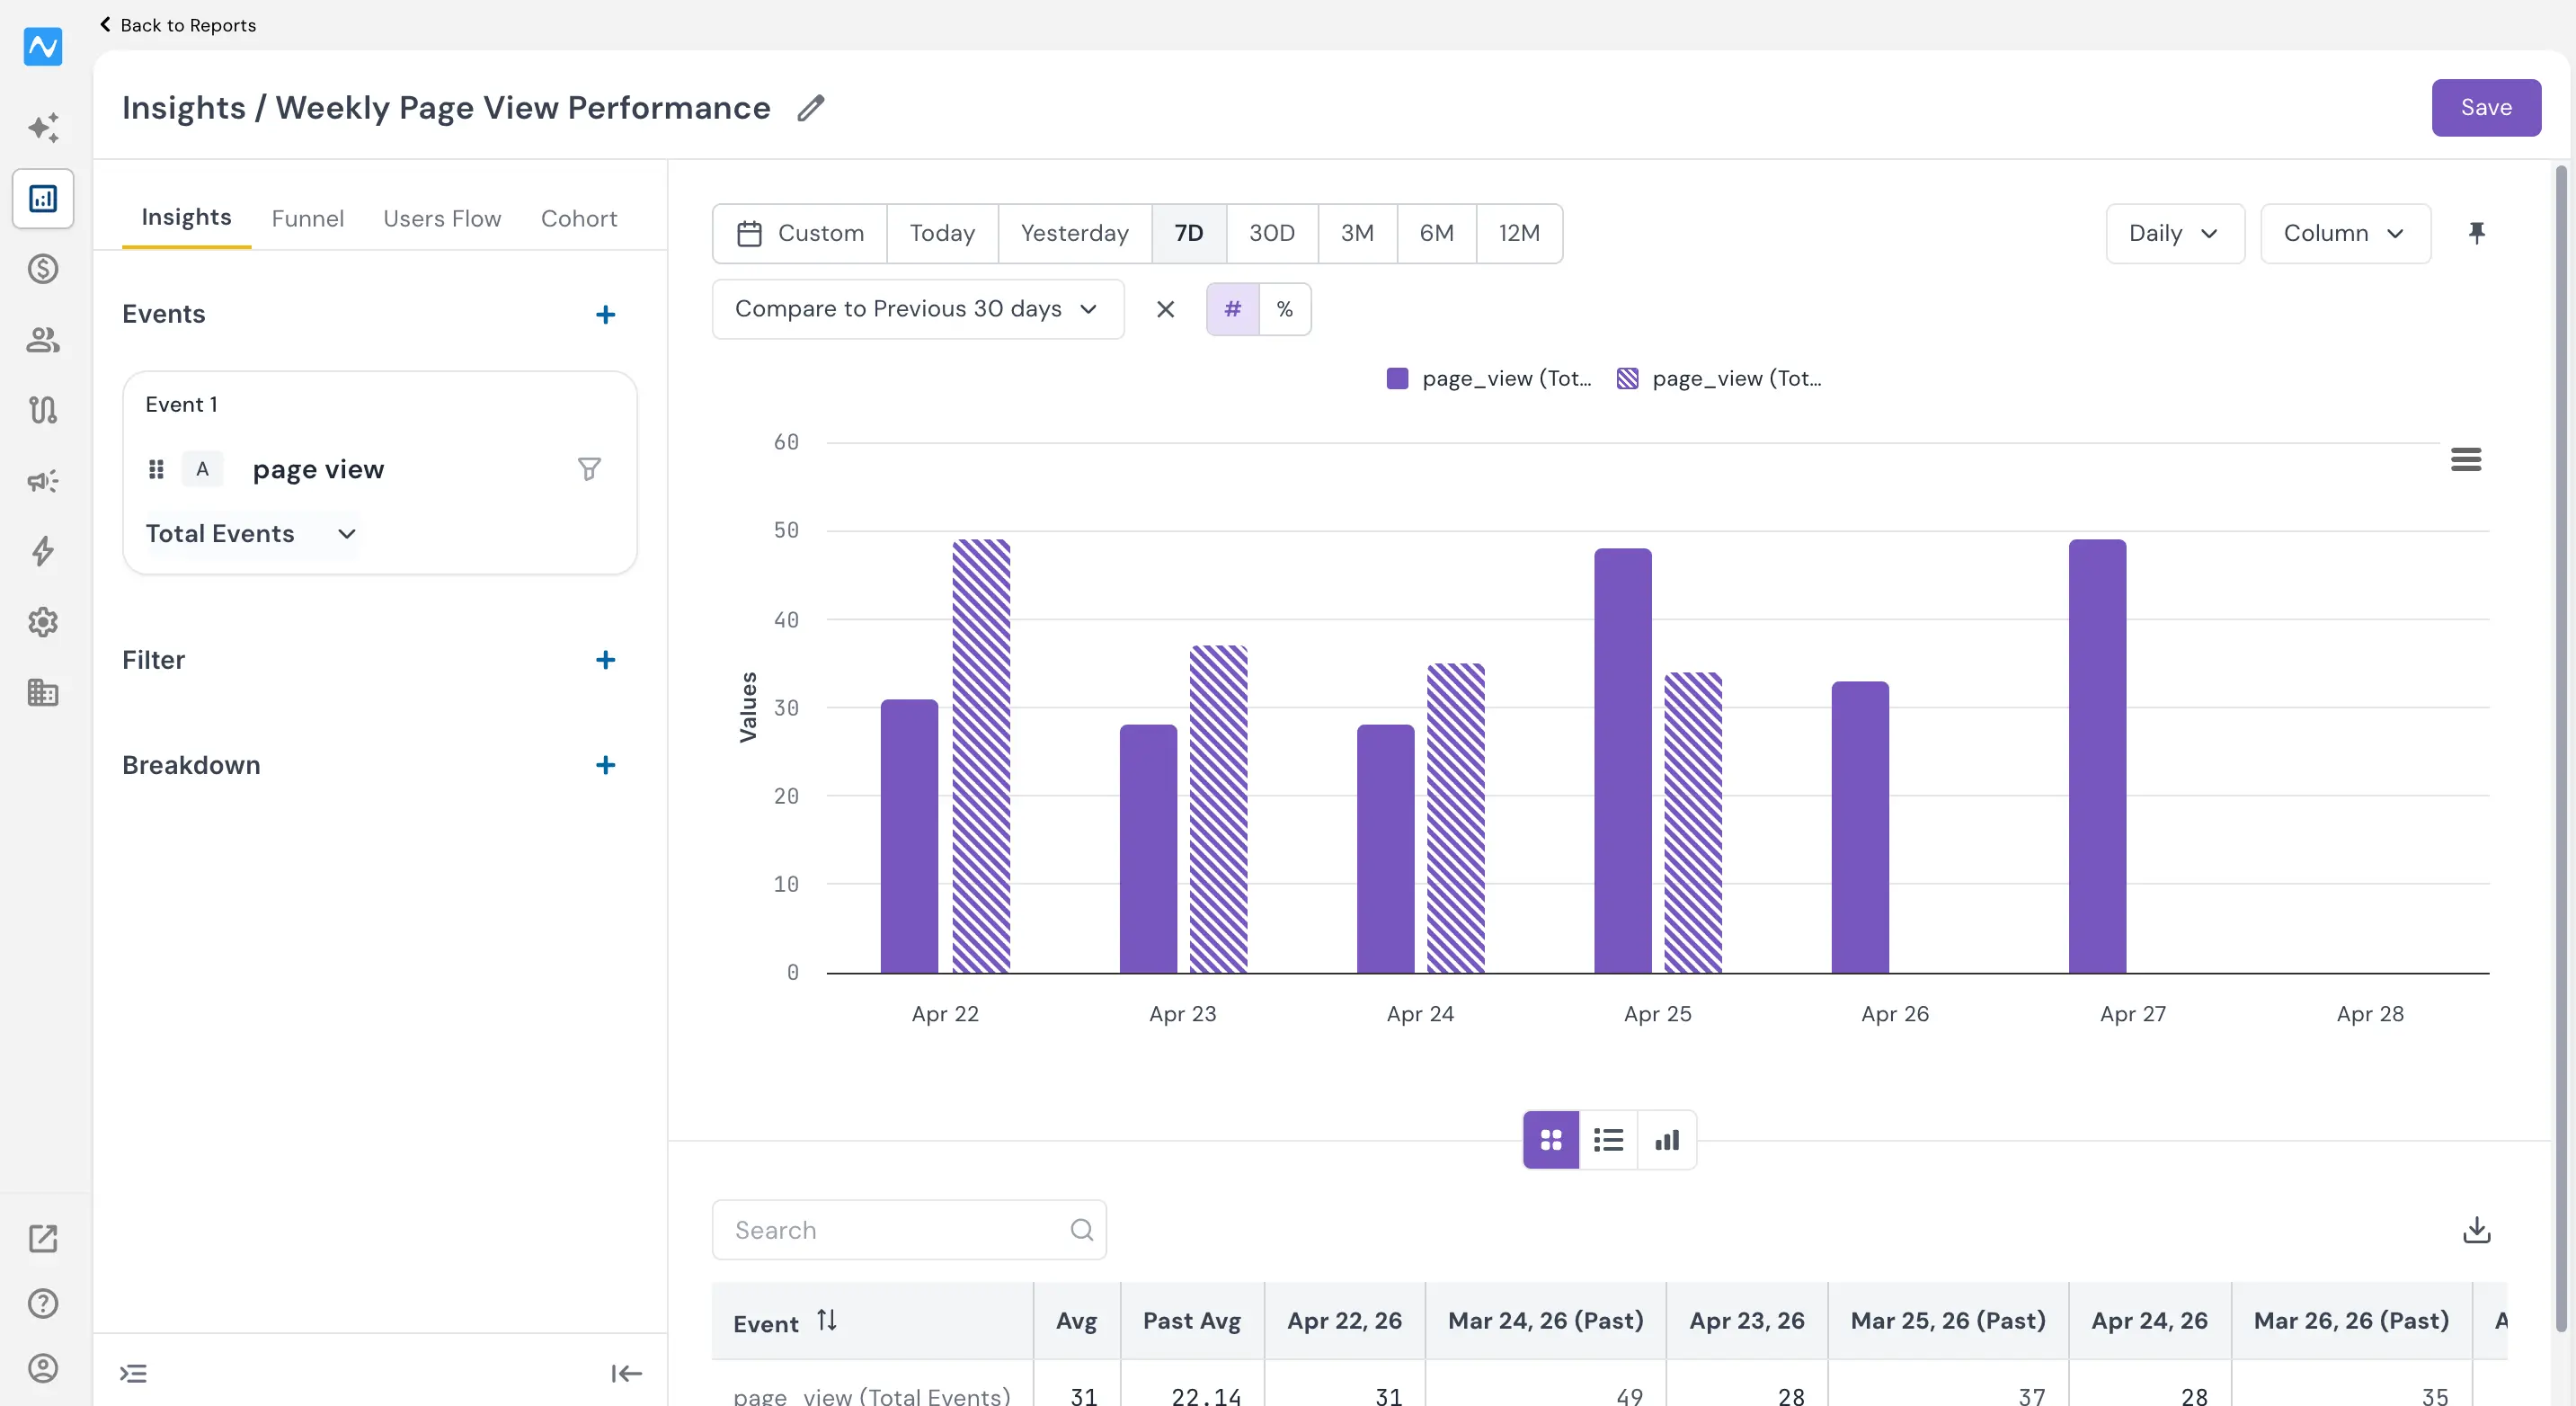
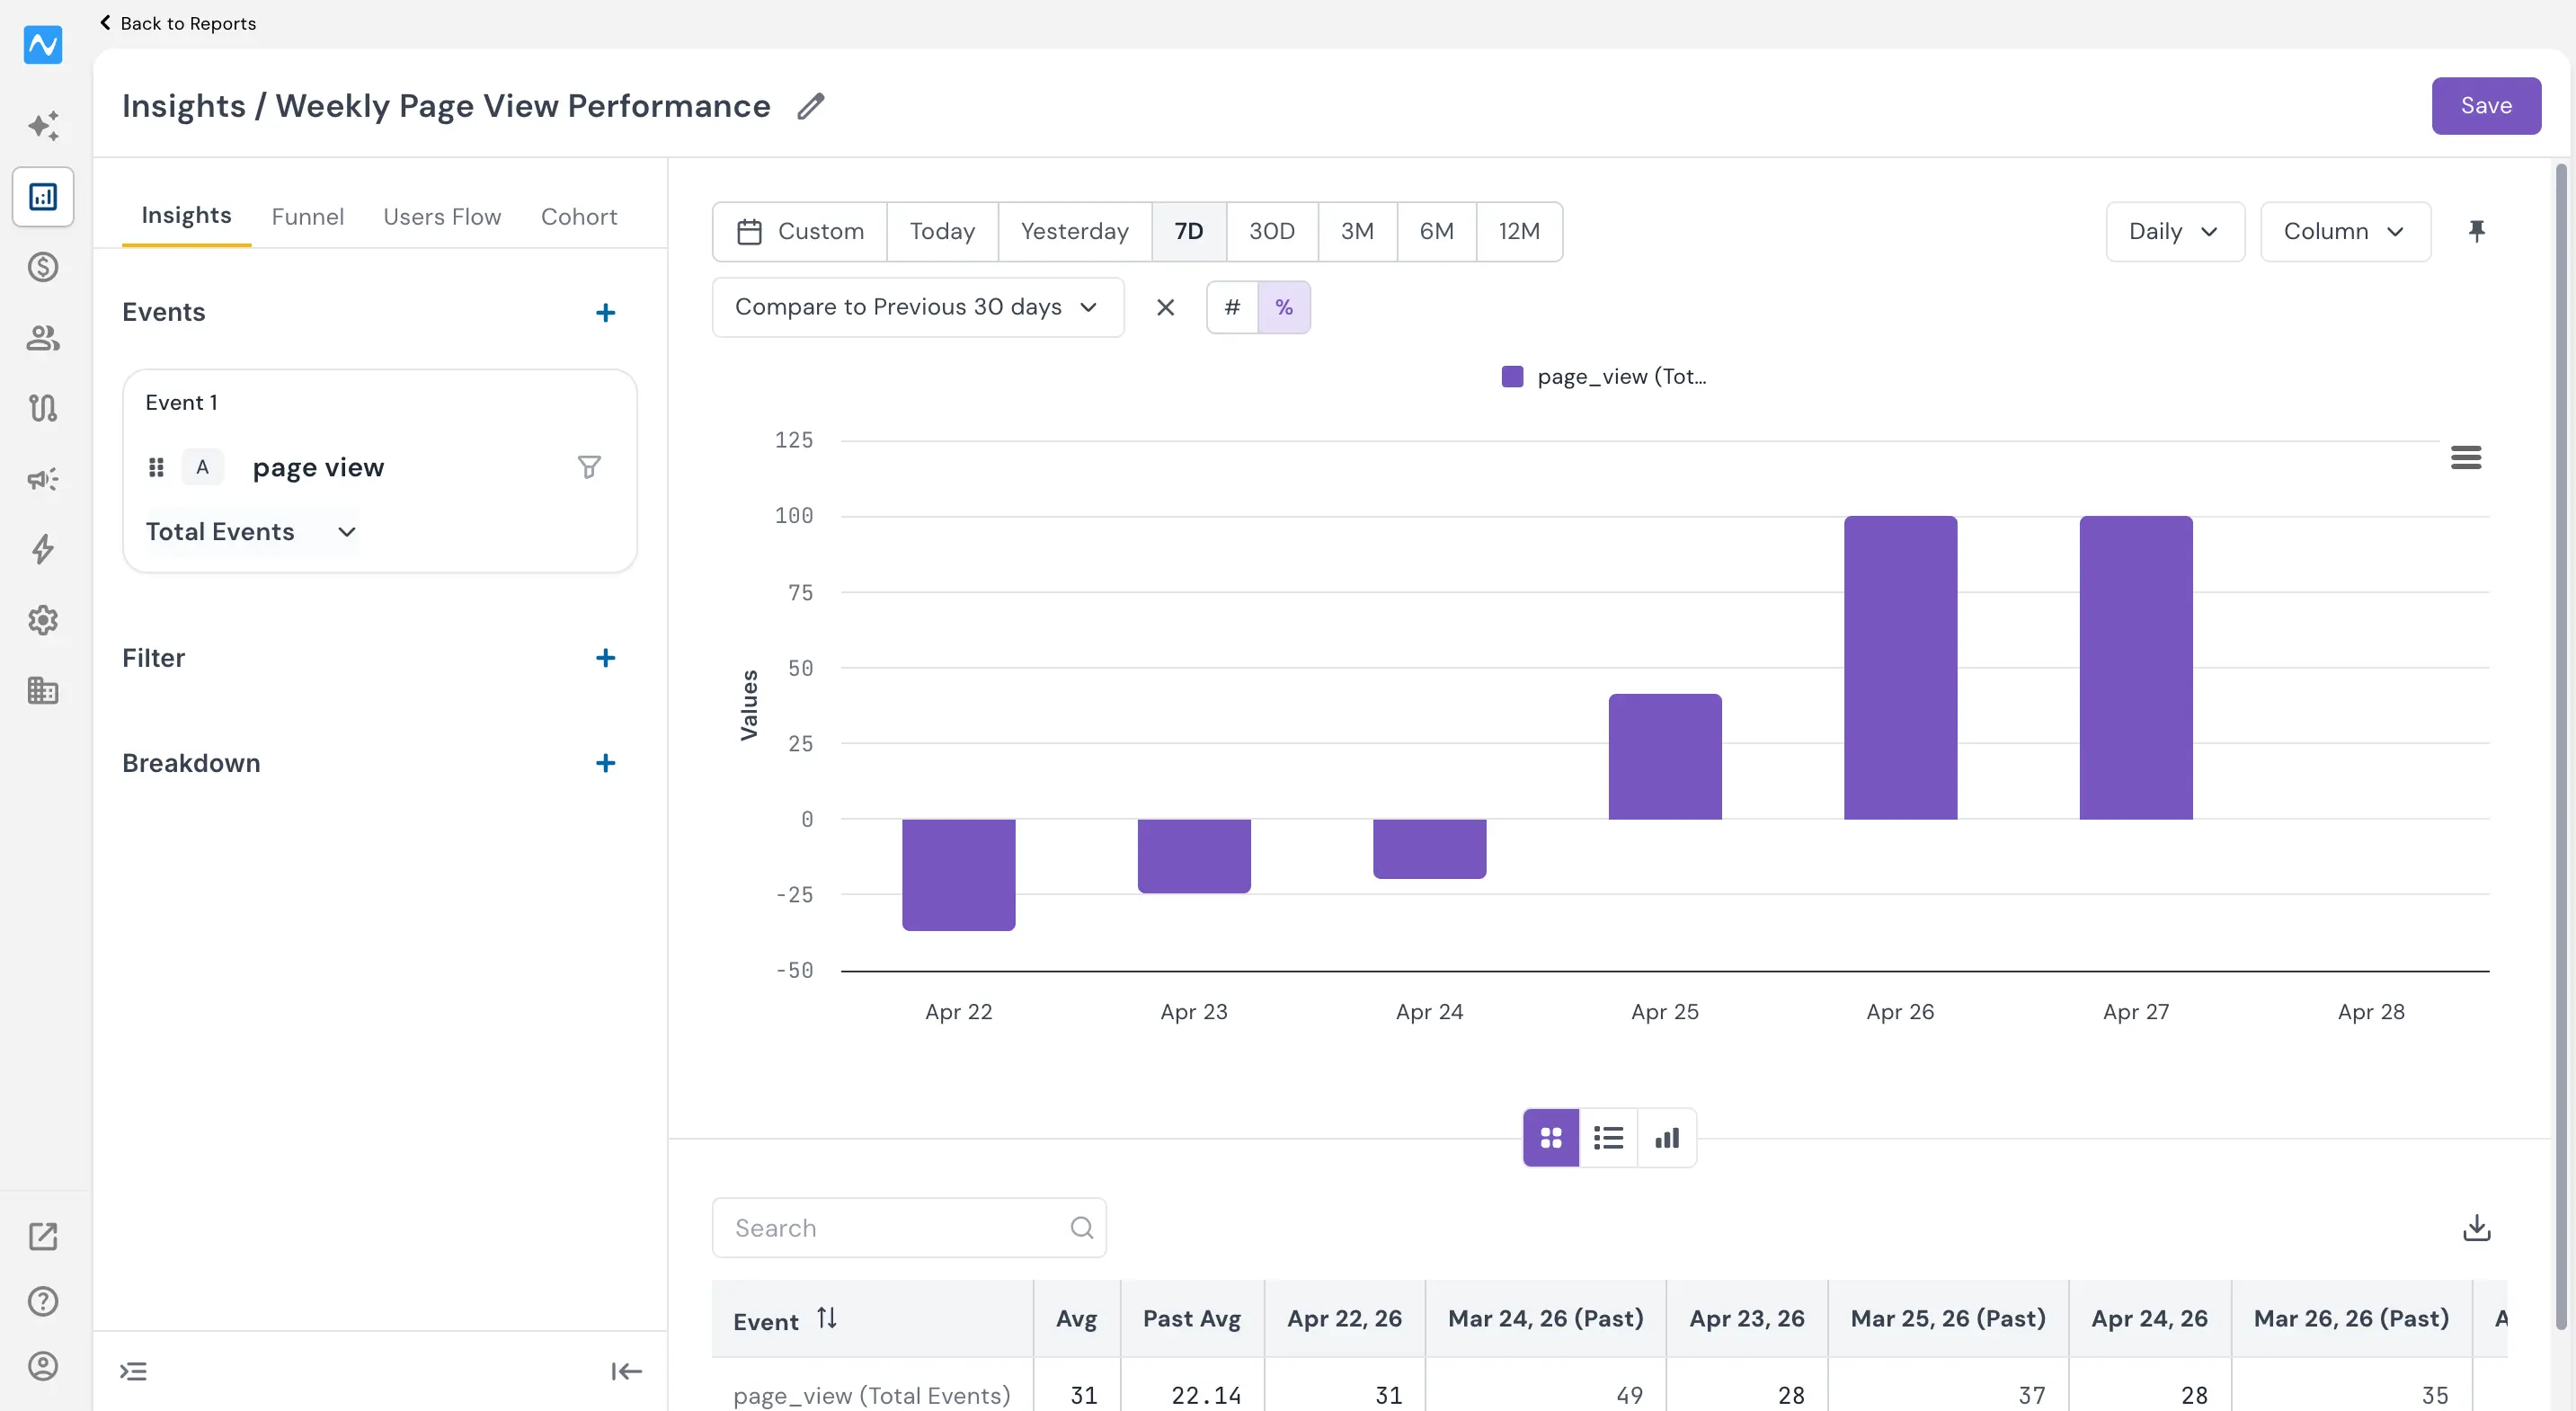
Once you select a comparison period, the report overlays both datasets on the same chart. The current period appears as a solid line (or solid bars), while the comparison period is rendered with a dashed line (or hatched bars), making it easy to distinguish between the two at a glance. The data table below the chart also expands to show values for both periods, with current and past dates interleaved for direct comparison.
It's important to note how the comparison offset works: the selected time period is skipped backward from your current date range. For example, if your current view shows the last 7 days and you select Previous 30 days, the comparison will skip 30 days back and then show the 7-day window before that point. This lets you compare against a period further in the past, not just the immediately preceding one.
You can switch between chart types — Line, Column, and others — and the comparison overlay adapts accordingly. In Column view, the current and past period bars are displayed side by side, making it especially useful for spotting volume differences day by day.
Hovering over any data point reveals a tooltip with the exact count or percentage change from the previous period.
Viewing change as numbers or percentages
Use the # and % toggle buttons next to the Compare dropdown to switch between absolute numbers and percentage change. In percentage mode, the chart shows how much each data point has moved relative to the comparison period — positive values point upward and negative values point downward, giving you an immediate visual signal of growth or decline.
For a quick summary, switch to the Metric chart type using the chart-type selector on the top right. This displays a single card per event showing the total count and the percentage change against the comparison period — ideal for quick executive-level check-ins.
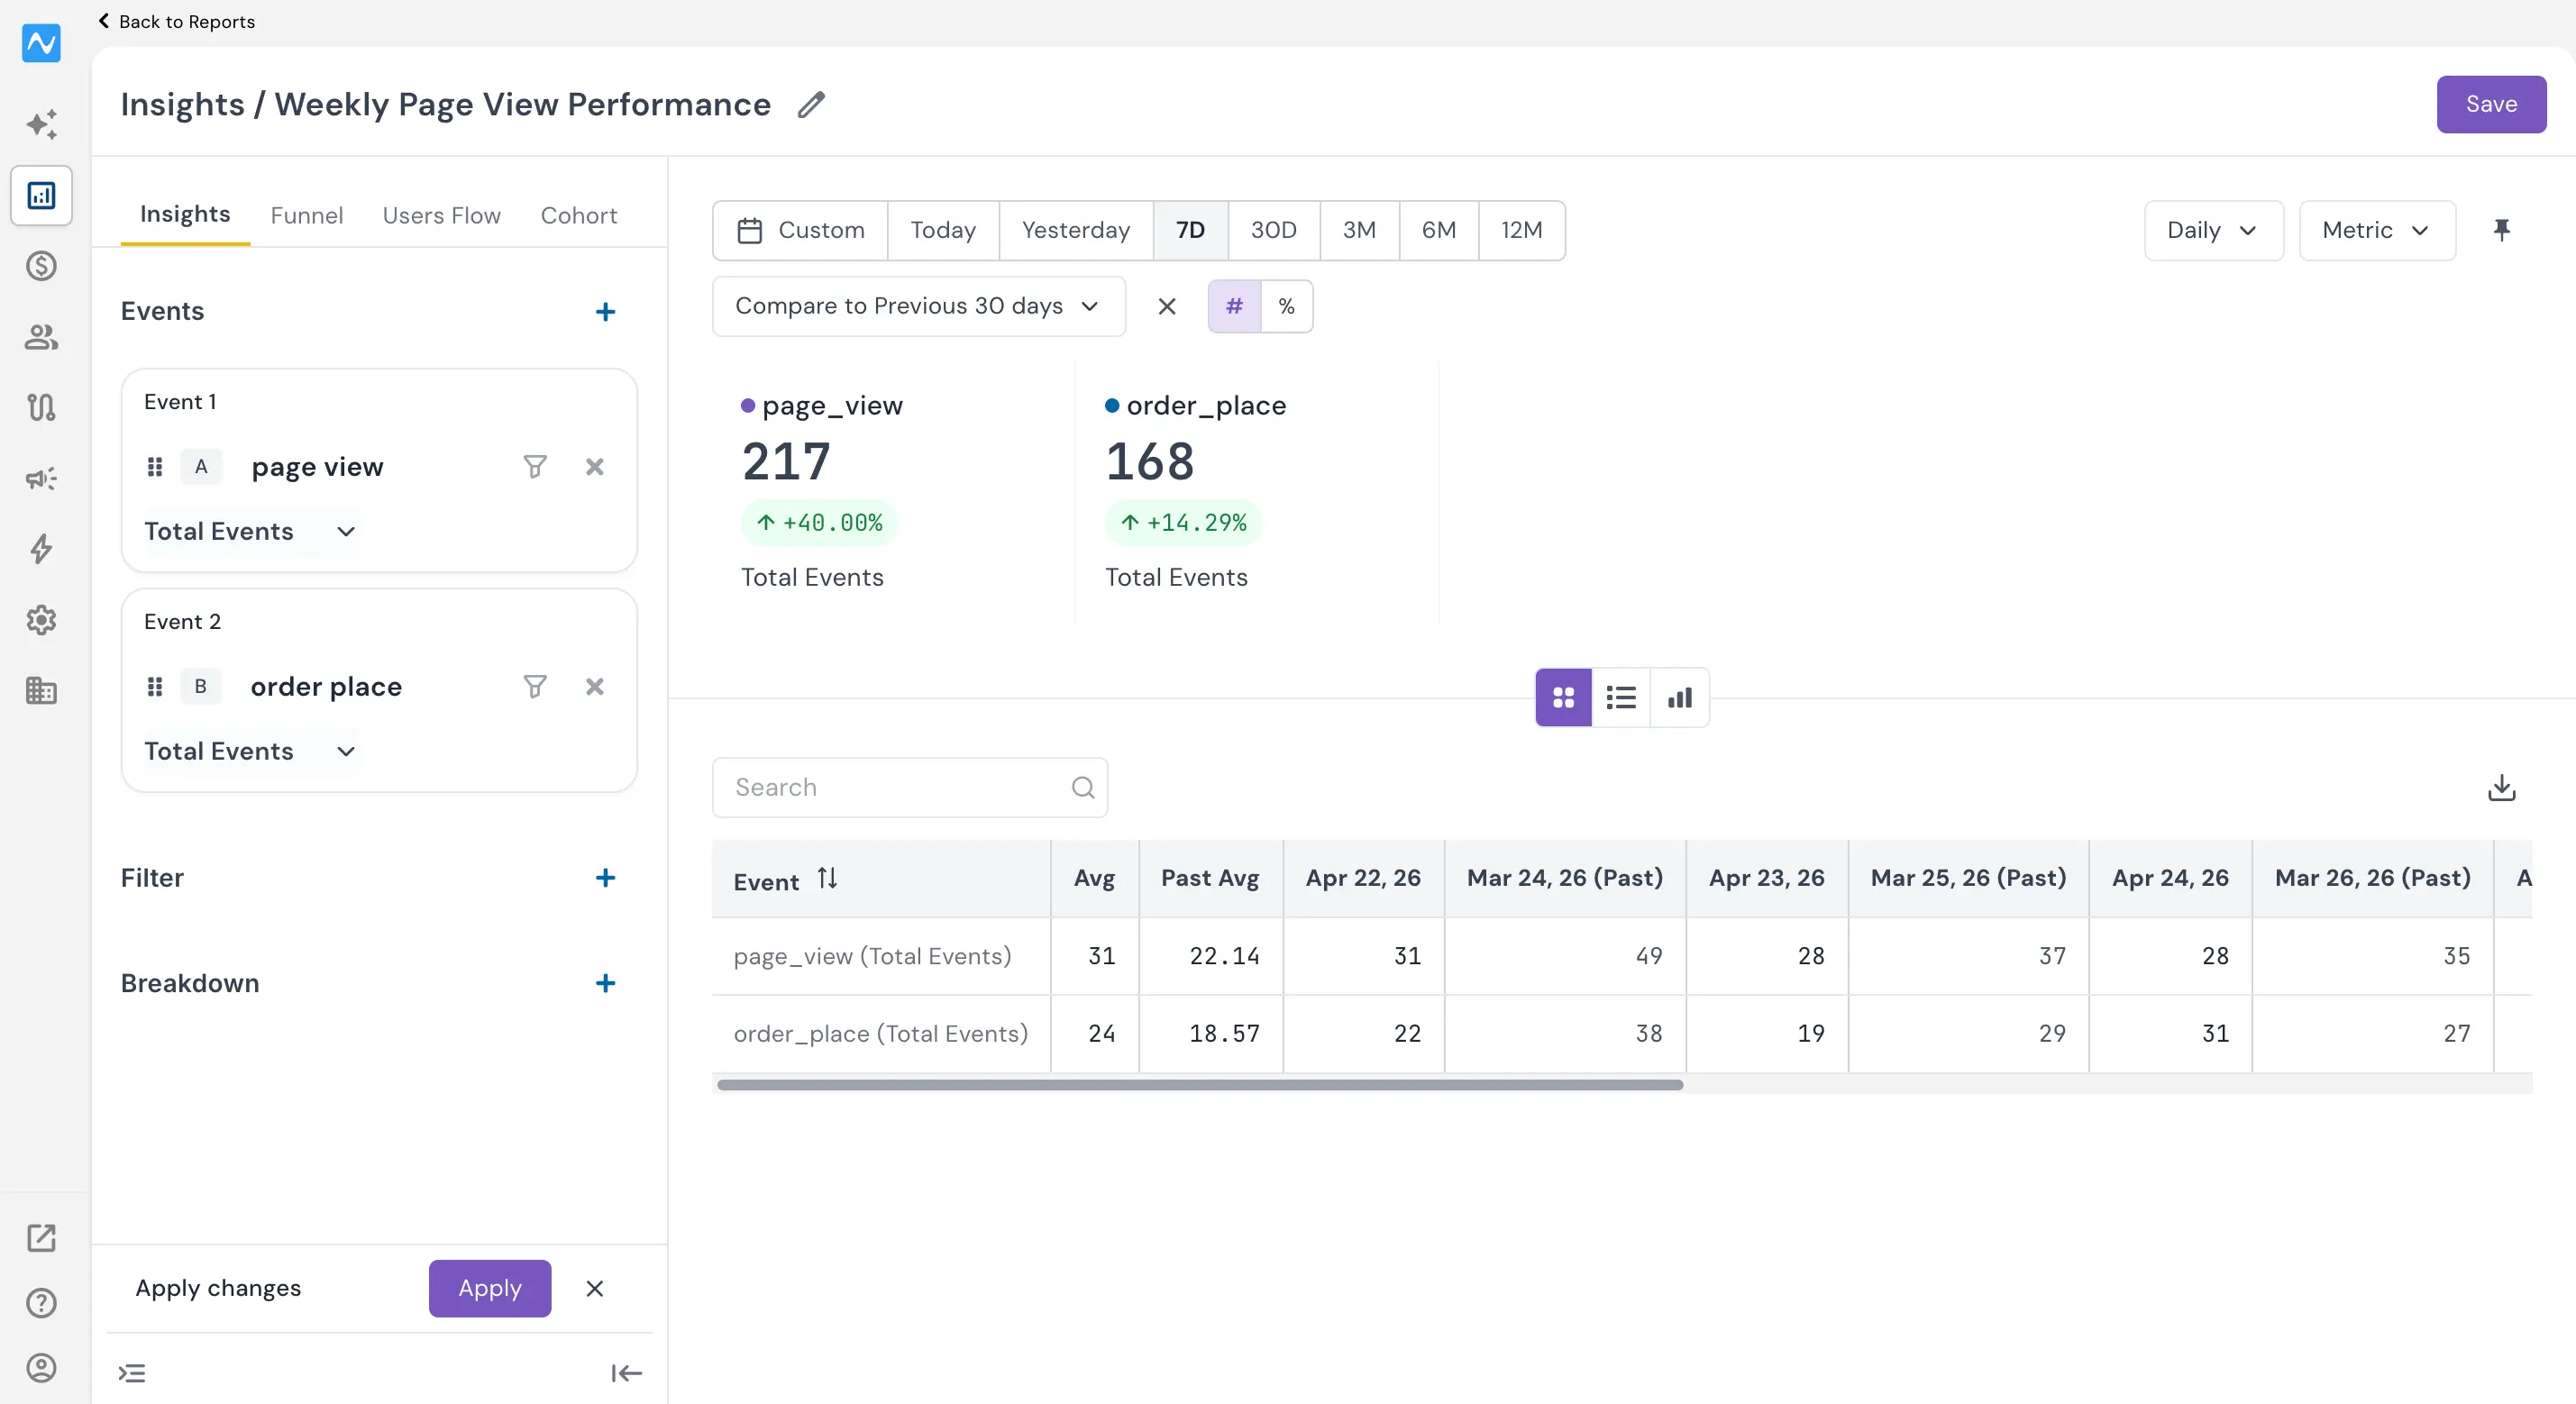
The same Compare feature works within Funnel reports as well, letting you benchmark conversion rates and drop-offs across time periods.
Problem it solves
Without built-in time comparison, teams either eyeball trends from memory or export data into spreadsheets to calculate period-over-period changes. This slows down analysis and increases the chance of errors. The Compare feature brings that context directly into the report — one click to see whether this month outperformed last month, or how a campaign launch shifted conversion volumes compared to the prior quarter — without leaving the Reports workspace.
With Compare, every Insights or Funnel report in NVECTA now doubles as a period-over-period performance benchmark.