When analysing multiple events together, you often need to see derived metrics — differences, ratios, or other calculations between events — not just the raw numbers side by side. Previously, this meant exporting data and computing these values manually. NVECTA now introduces Formula as a new event type in Insights reports, allowing you to define custom calculations across your selected events and visualise the result as an additional trend line directly within the report.
Where to find it
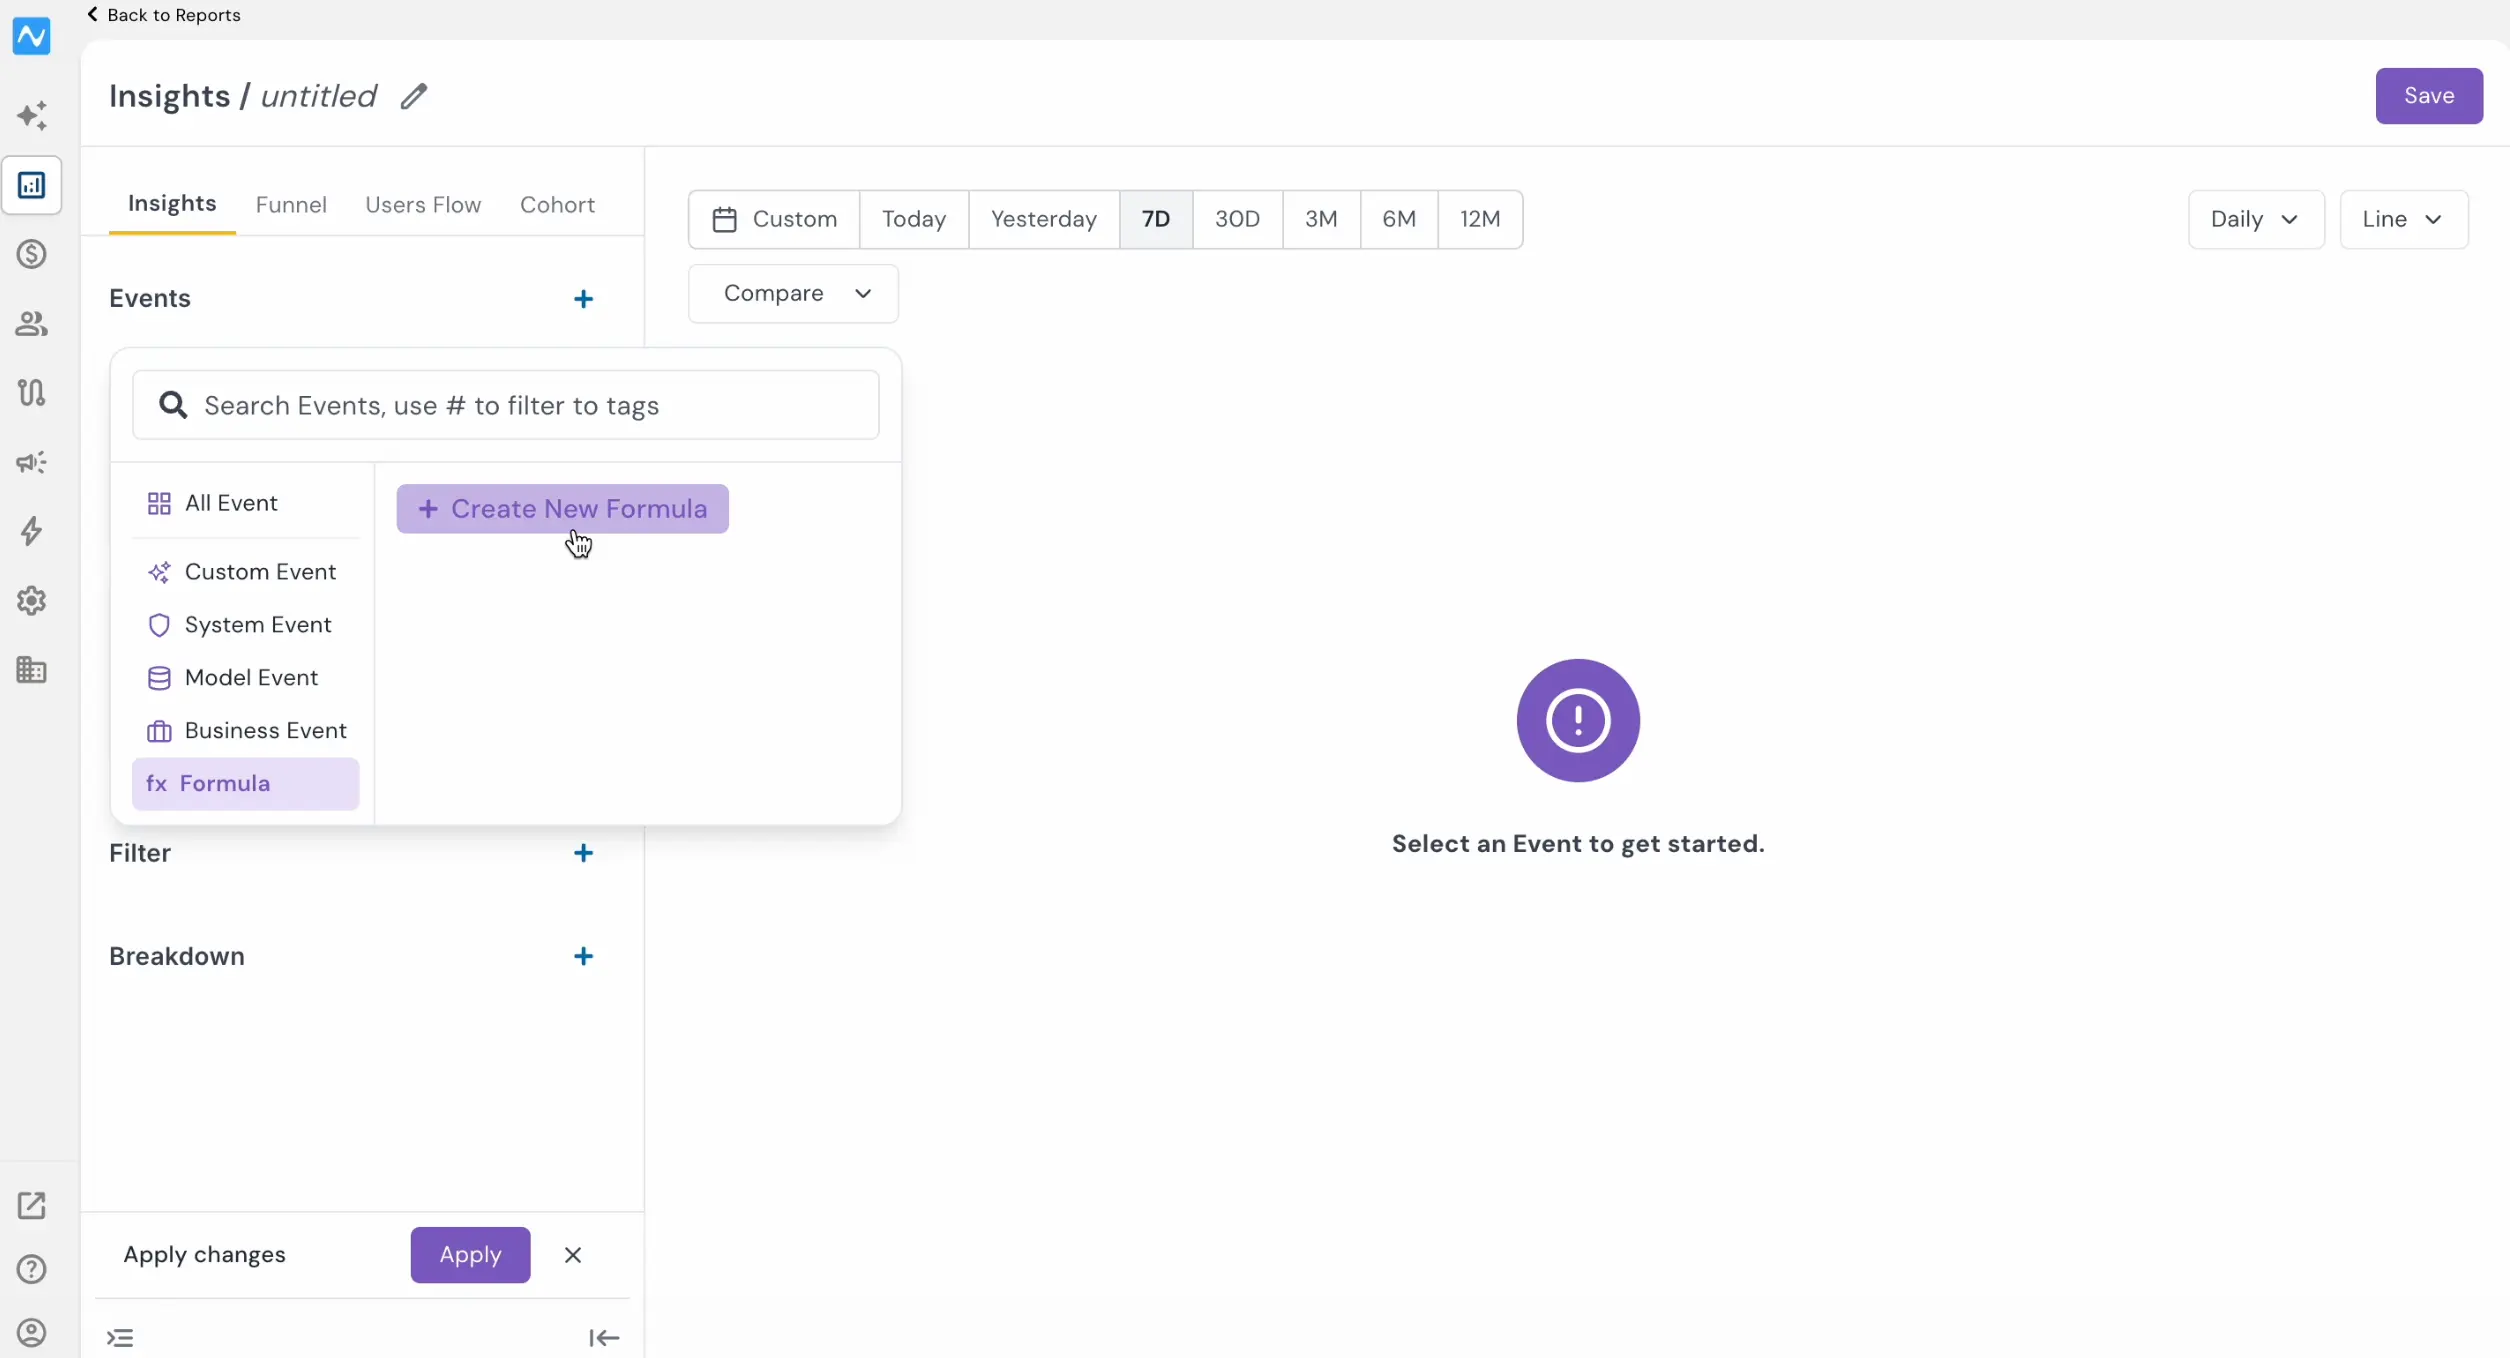
Go to Analytics → Reports and open or create an Insights report. Add two or more events to the report using the + icon next to Events. Once multiple events are added, click the + icon again and select Formula from the event category list on the left — it appears alongside All Event, Custom Event, System Event, Model Event, and Business Event. Click Create New Formula to define your expression.
If you're new to the Reports section, refer to the Introducing Reports changelog for a complete overview.
How it works
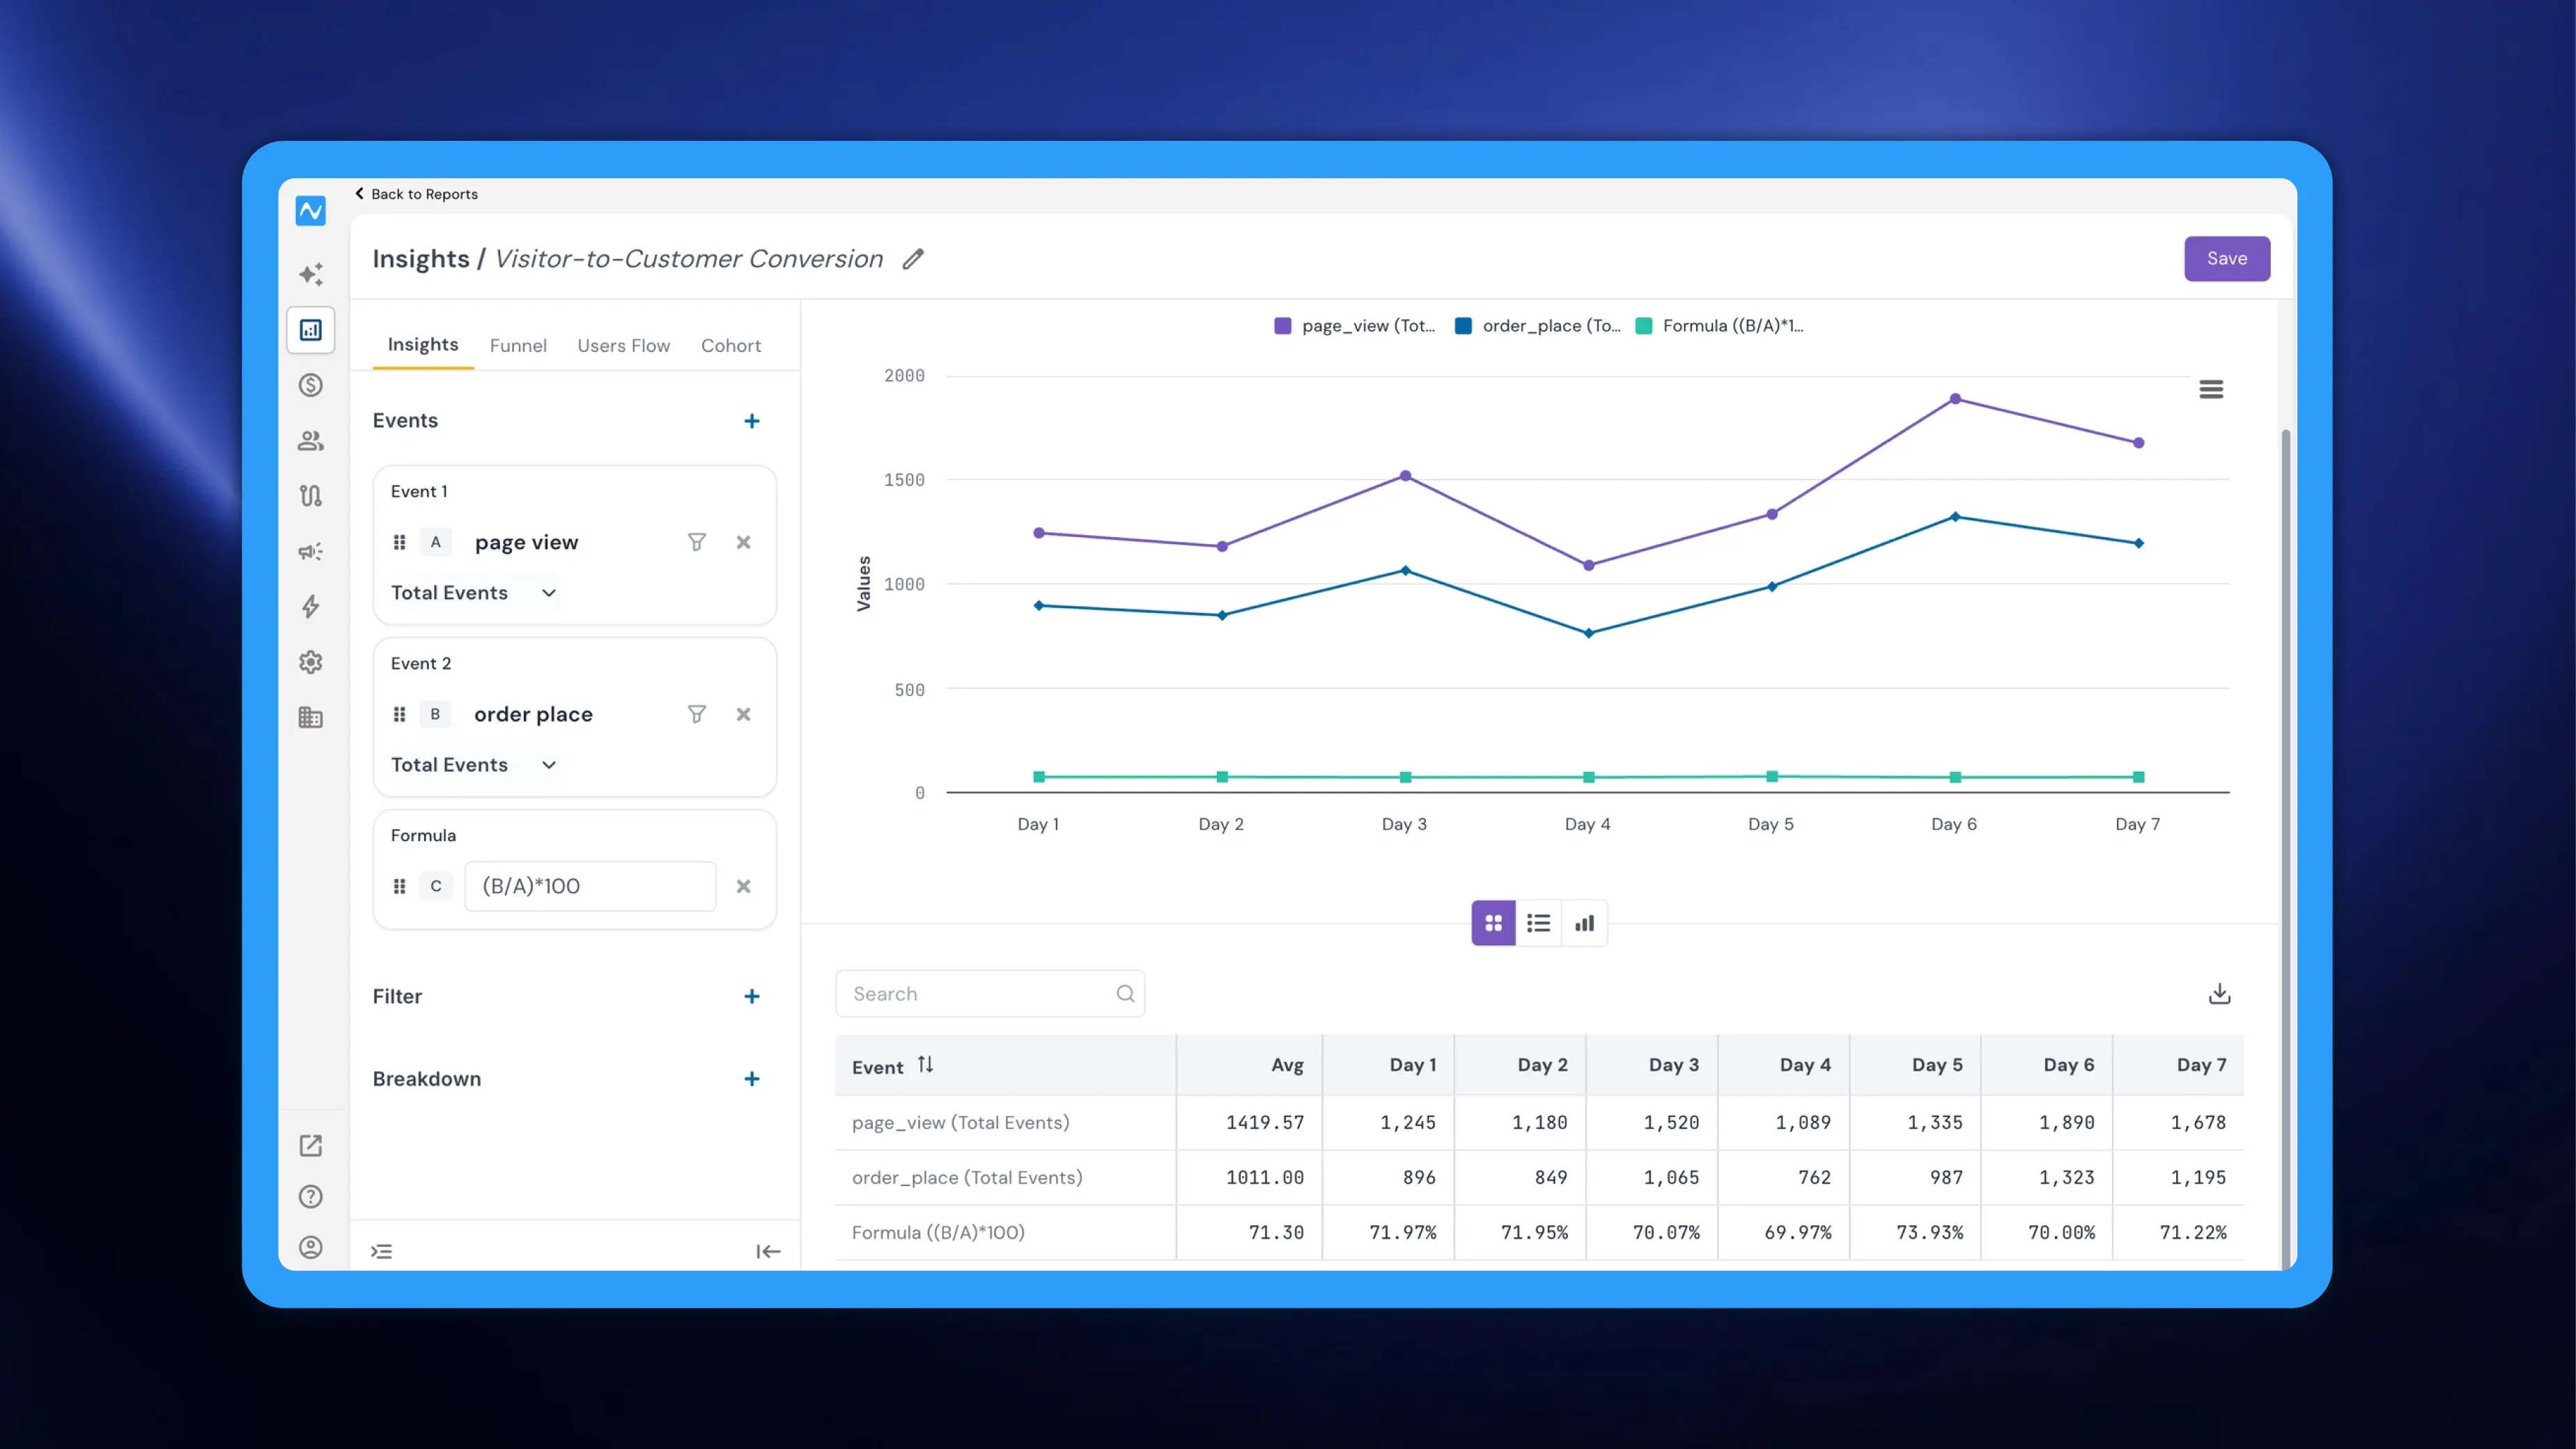
Each event in your report is automatically assigned a letter identifier — A for Event 1, B for Event 2, and so on. When you create a formula, you reference these letters to build your expression. For example, if Event A is page_view (Total Events) and Event B is order_place (Total Events), entering (B/A)*100 calculates the visitor-to-customer conversion rate as a percentage for each data point.
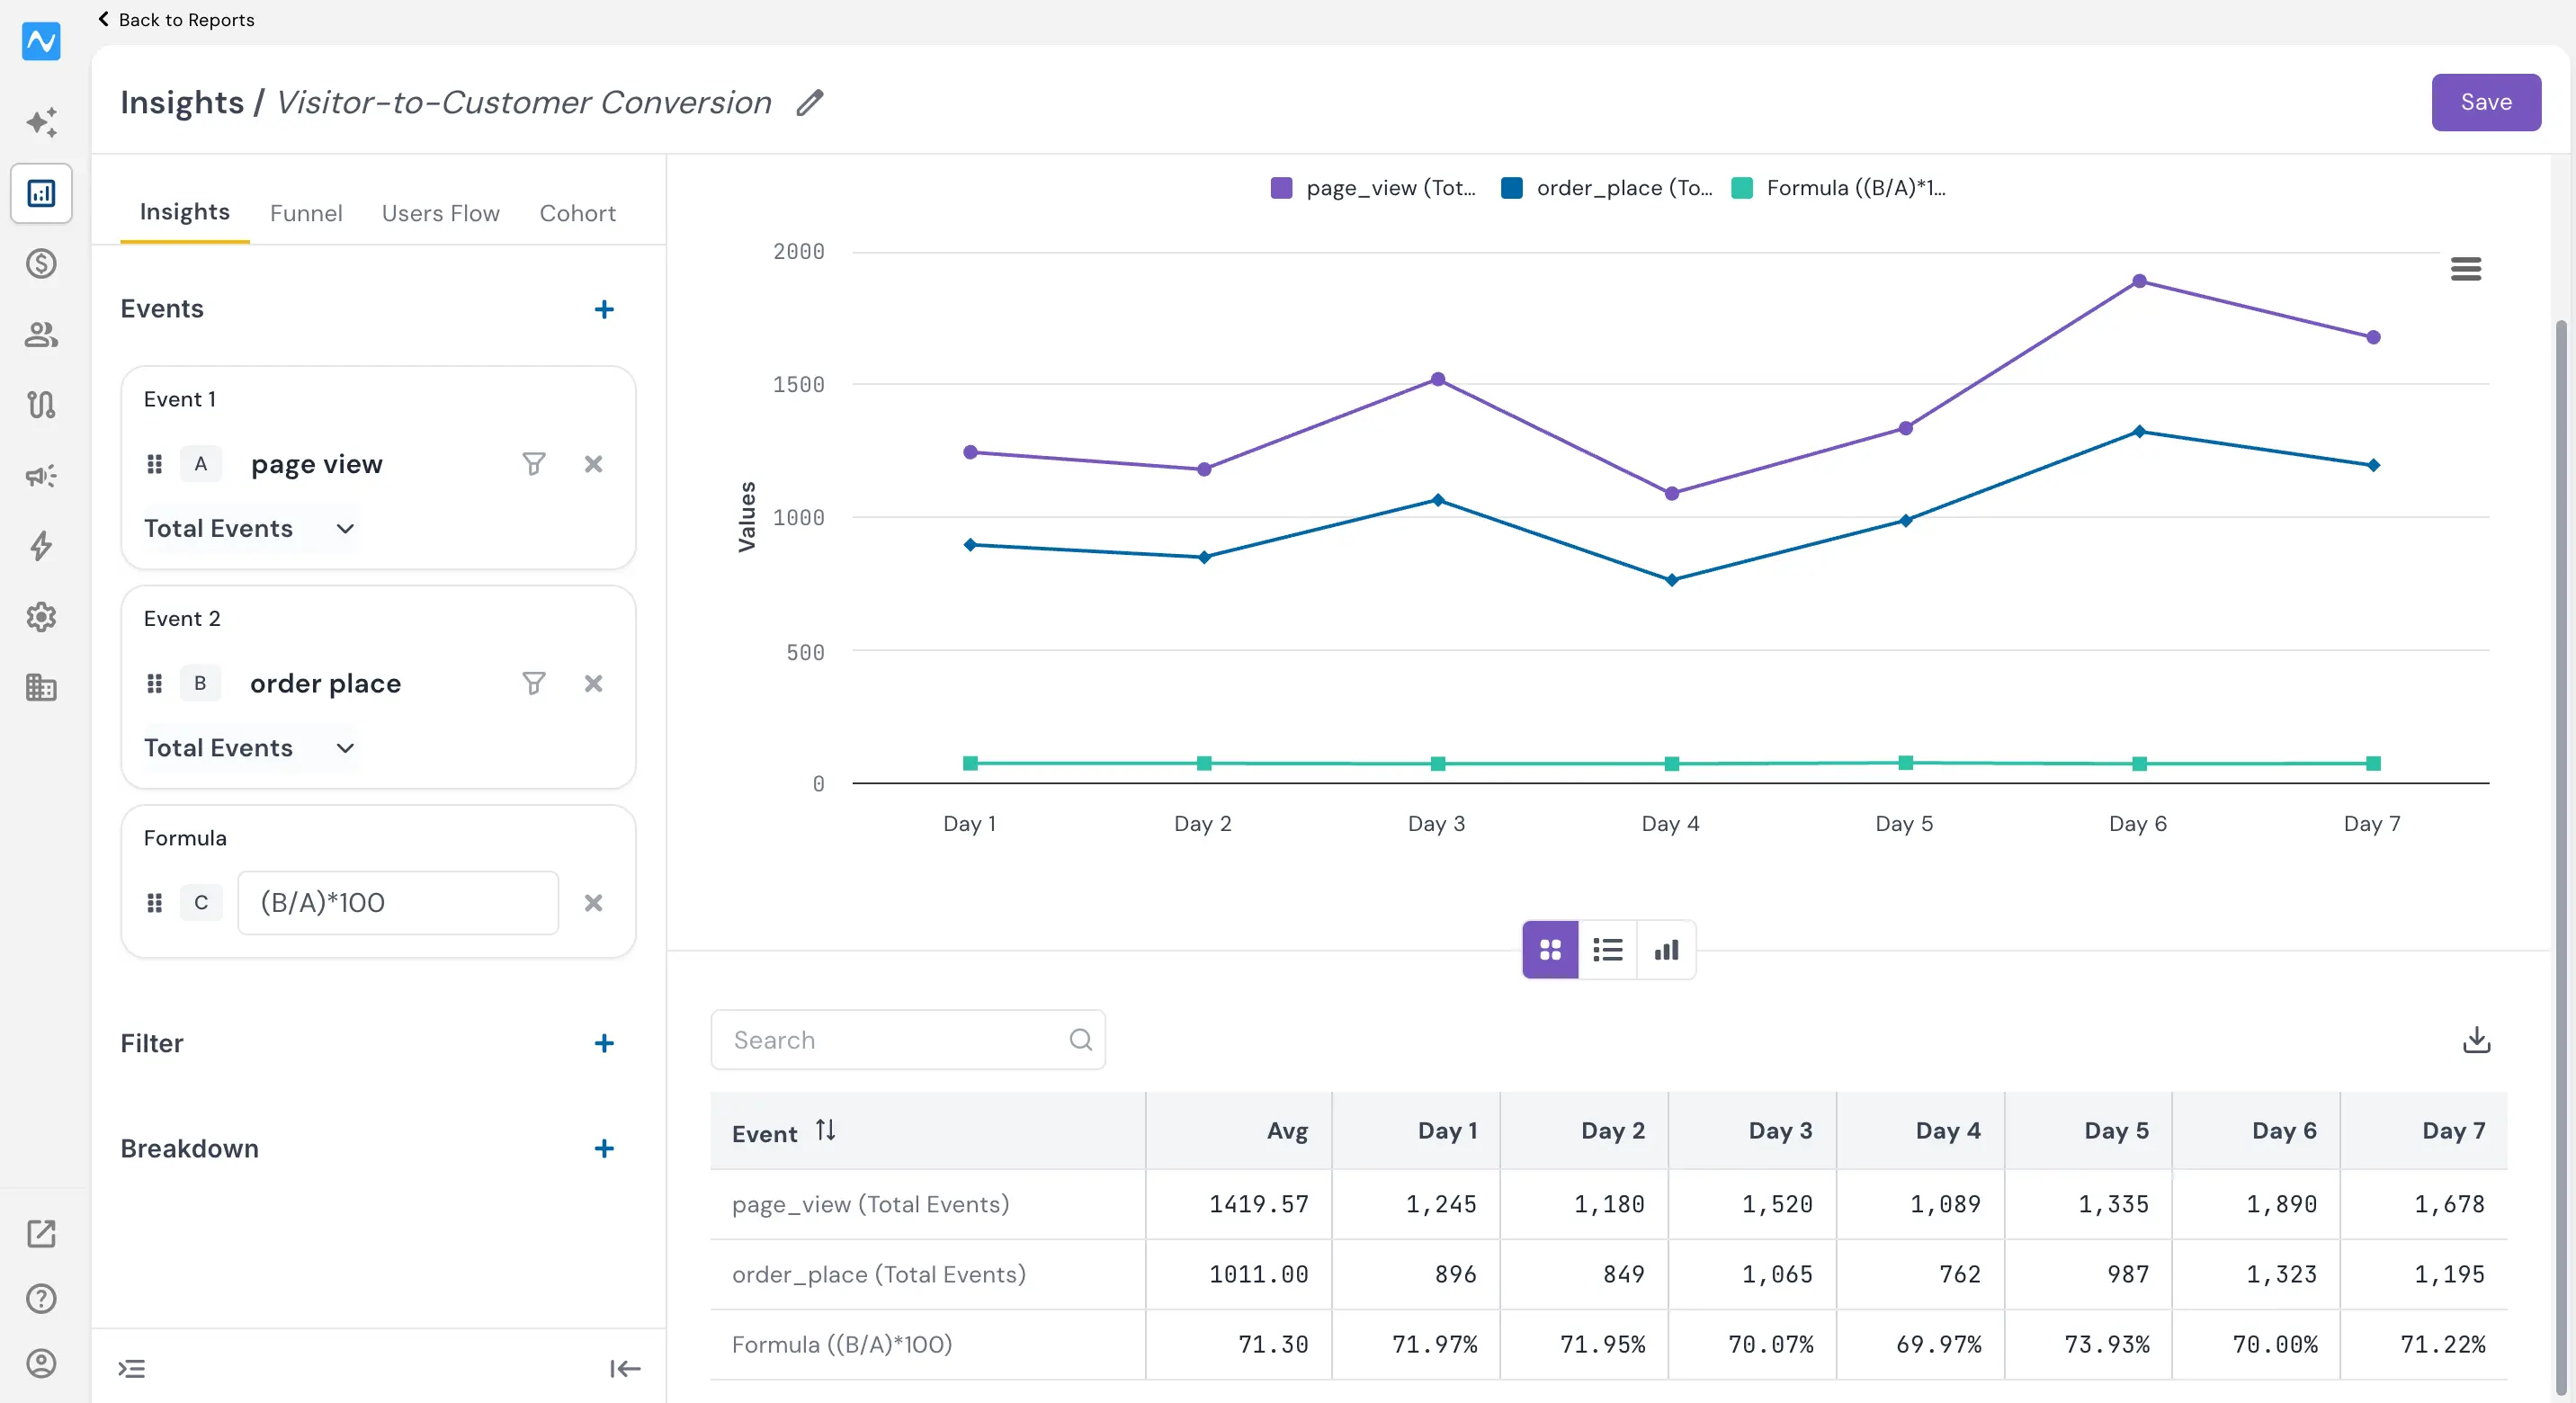
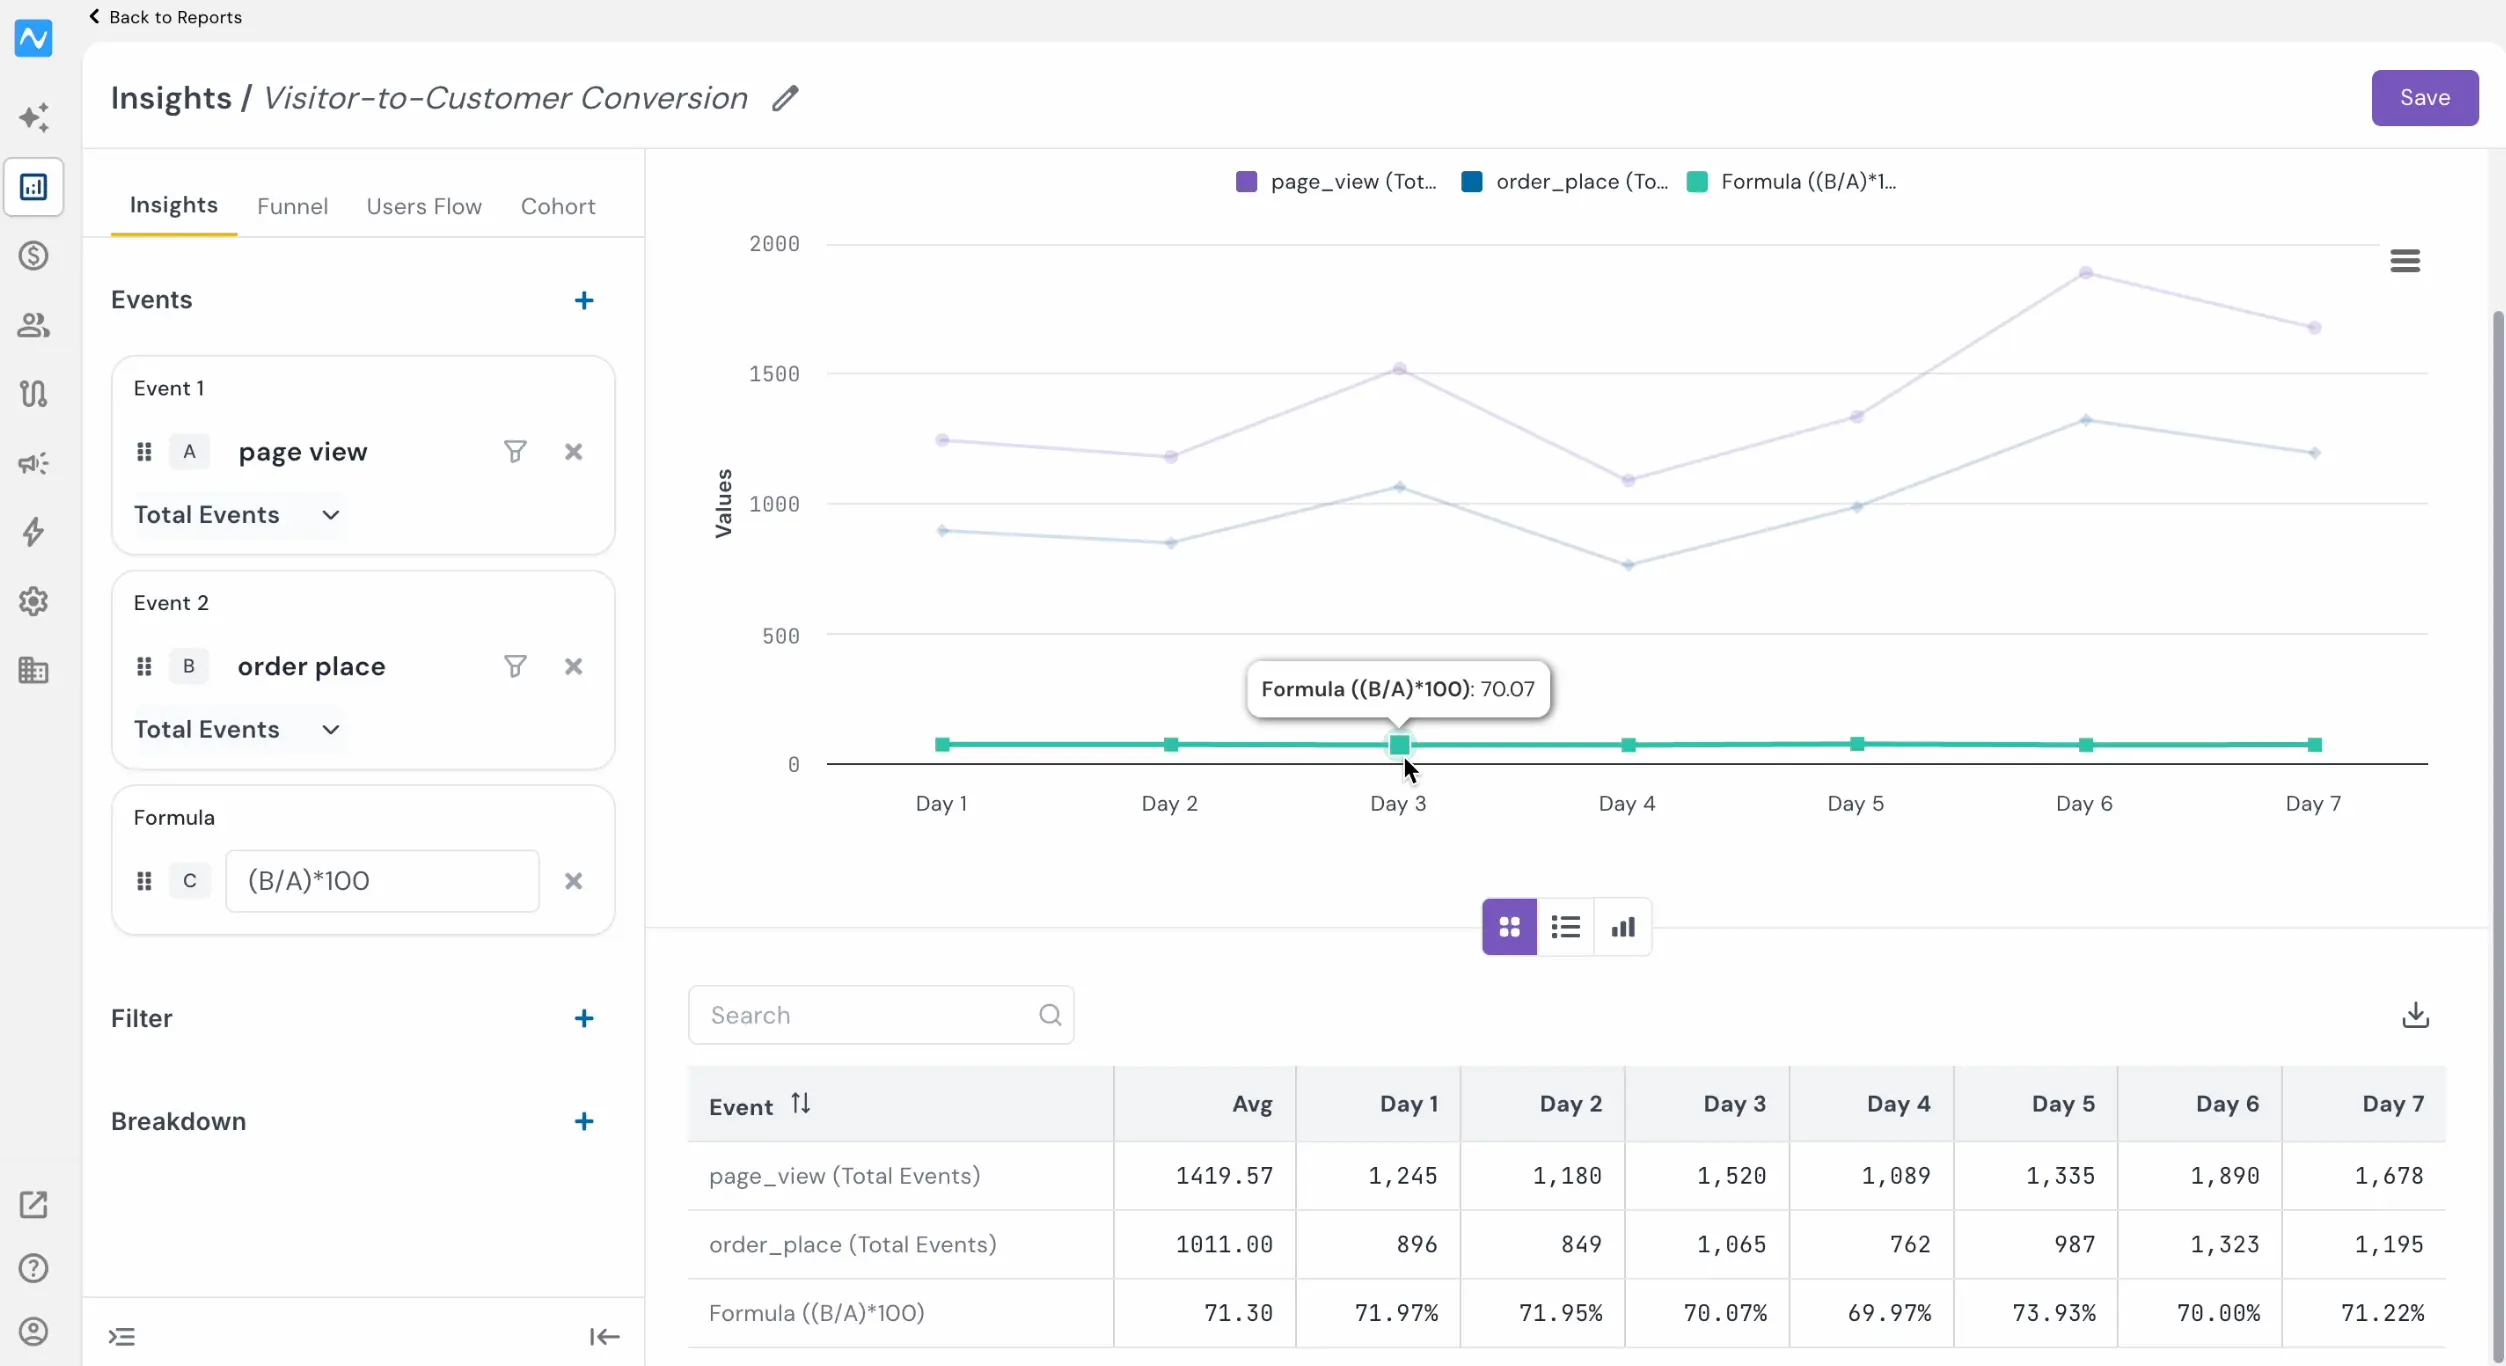
The formula result is plotted as an additional line on the chart (labelled as Formula in the legend) alongside the original event trend lines, and a corresponding row appears in the data table below. Hovering over any point on the formula line reveals the calculated value for that date.
You can use standard arithmetic operators — addition (A+B), subtraction (A-B), multiplication (A*B), and division (A/B) — to construct the metric you need.
All standard Insights controls — date filters, chart types, Compare, Filter, and Breakdown — continue to work alongside formula events.
Problem it solves
Derived metrics like conversion rates, cost per conversion, etc., are often the most actionable numbers in an analysis, yet computing them historically required spreadsheet exports or BI tool queries. Formula events bring that calculation directly into the report, keeping your analysis workflow inside NVECTA and making calculated metrics available in the same chart and table.
With Formula events, Insights reports can now surface calculated metrics in real time, turning multi-event analysis into actionable derived KPIs without leaving the platform.