Event volume is the simplest health signal NVECTA gives you. If the number of Page View, Login or Order Placed events arriving today looks nothing like the number that normally arrives, something has changed: a release dropped a tag, an SDK stopped firing, an event started firing twice, or a campaign genuinely landed. A volume alert is how you find that out on the morning it happens, rather than a week later when a report looks wrong.
Setting the alerts up is covered in User and Event Observability. This article picks up from the mail that lands in your inbox: what each field means, what the statistics behind Historical Average and Expected Range are doing, why some events are deliberately never flagged, and what to do about the ones that are.
If you are new to how events and attributes are defined in NVECTA, read Track Events - Definitions, Attributes and Events and Event configuration first.
The three volume alerts
NVECTA can watch event volume in three ways. They differ in what they cover and in how they decide that a number is wrong, which is why the mails they produce do not read the same.
| What it watches | Where it lives | How it decides |
|---|---|---|
| Every event at once, with no thresholds to maintain | Settings → Alerts, Event Occurrences on All Events | Anomaly detection, run daily |
| One event, against a number you choose | Settings → Alerts, Event Occurrences on a specific event | Increase or decrease against yesterday or the previous week, by value or percentage |
| A metric on a saved Insights report | Analytics → Insights, the … menu on an open report | Anomaly detection at 99%, 95% or 90% confidence, or a custom threshold |
Part 1 — Create an event volume alert
Option A — All-events anomaly alert
Where: Settings → Alerts
This is the alert that produces the Event Volume mail described in Part 2 .
- Go to Settings → Alerts.
- Click CREATE NEW ALERT.
- Enter an Alert name. This is the name that appears in the mail under Alert Details, so name it for what it watches: Event Volume, for example.
- In Metrics change of, select Event Occurrences.
- In the second dropdown, select All Events.
- In Alerts send to, type an email address and press Enter. Repeat for each recipient.
- Click Create.
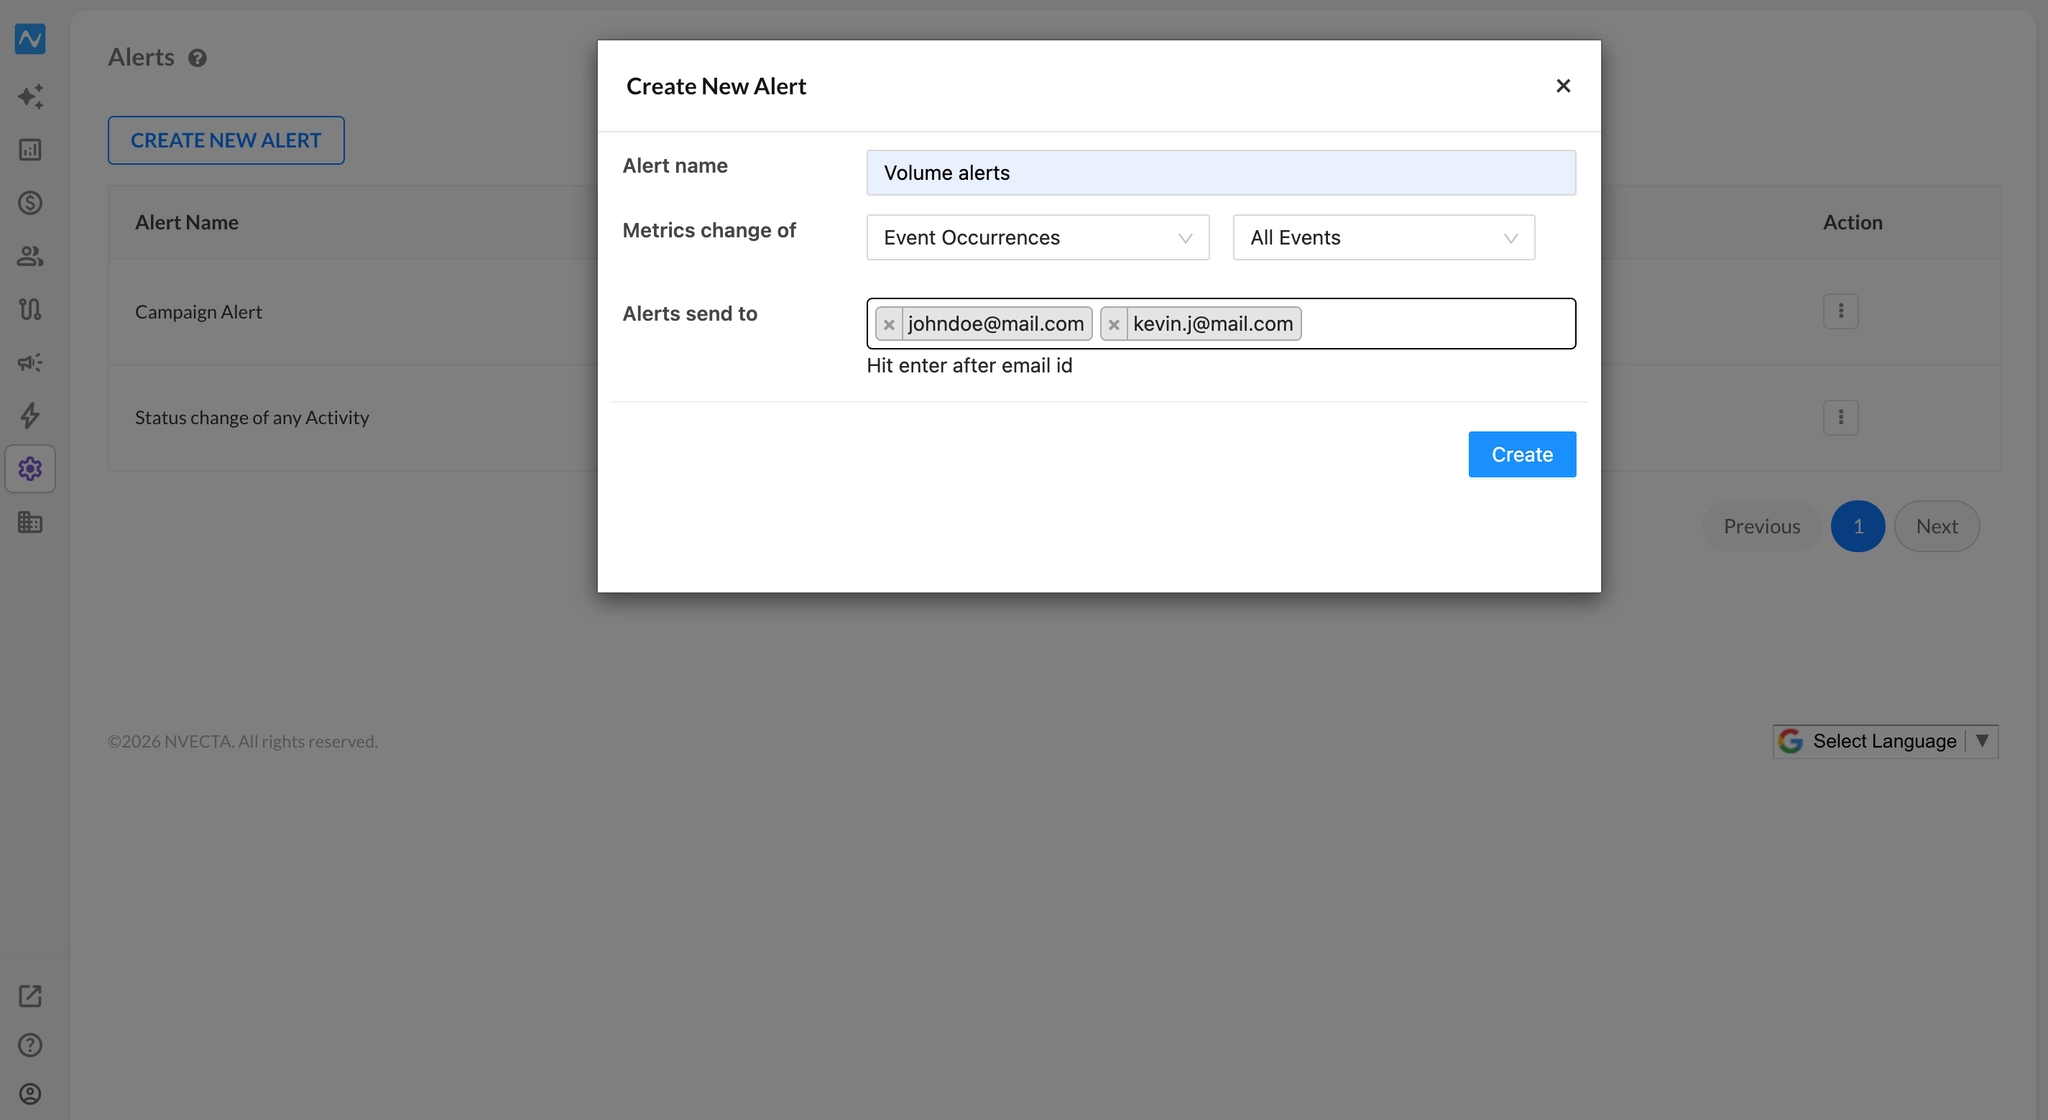
Selecting All Events removes the Frequency and Send alert if value is fields from the dialog. That is deliberate. There is no single threshold that makes sense across every event you track, so NVECTA runs this alert daily and judges each event against its own history instead. You see that reflected in the mail as Frequency: Daily and Deviation Type: Anomaly detection.
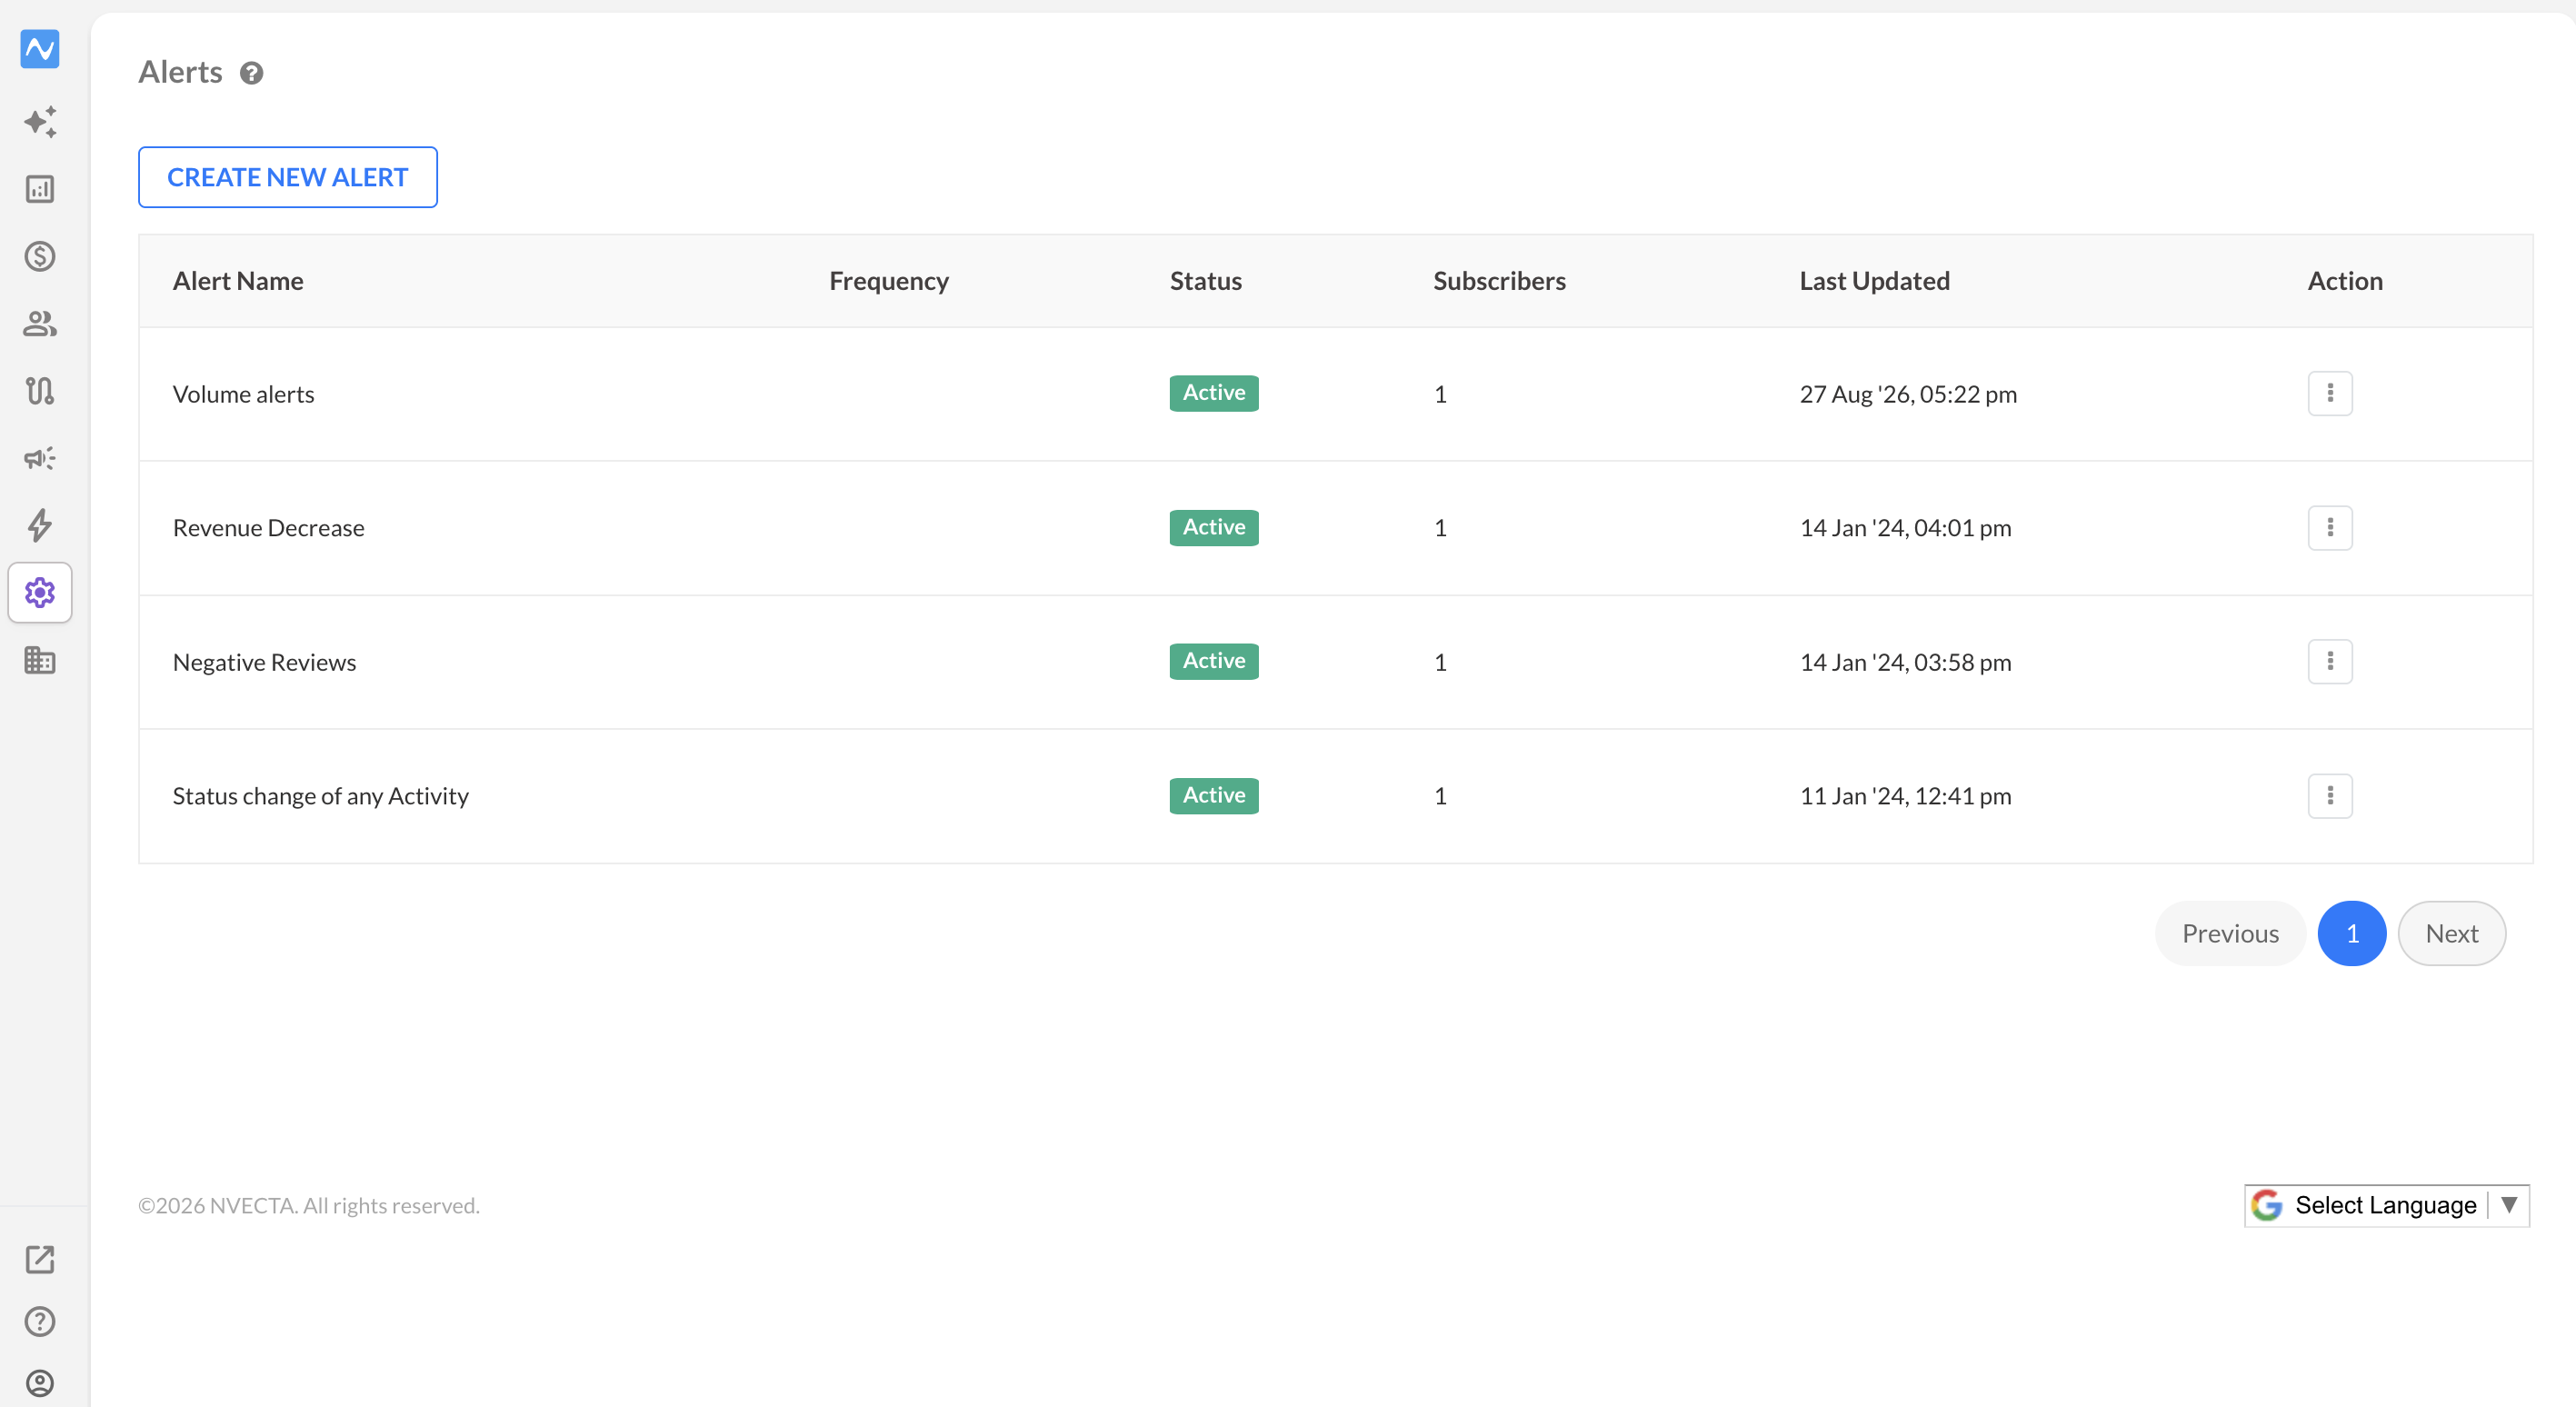
The alert is then listed on the Alerts page, where each row shows Alert Name, Frequency, Status, Subscribers, Last Updated and Action. The Action menu lets you manage it later.
Option B — Single-event volume alert
Where: Settings → Alerts
Build it the same way as above, but at step 5 pick a specific event instead of All Events. The dropdown lists All Events first, then your Custom Events.
Choosing a specific event reveals the fields the all-events alert hides:
- Filter — the funnel icon beside the event, for narrowing the alert to particular event attribute values.
- Frequency — Daily or Weekly.
- Send alert if value is — Increase or Decrease, then the comparison (From previous week by [X]% or by Absolute value of [X]) and the Value of X.
The comparison baseline follows the Frequency you chose: a daily alert compares against yesterday, a weekly alert against the previous week. Full steps for every metric type are in Monitor critical issues with automated alerts.
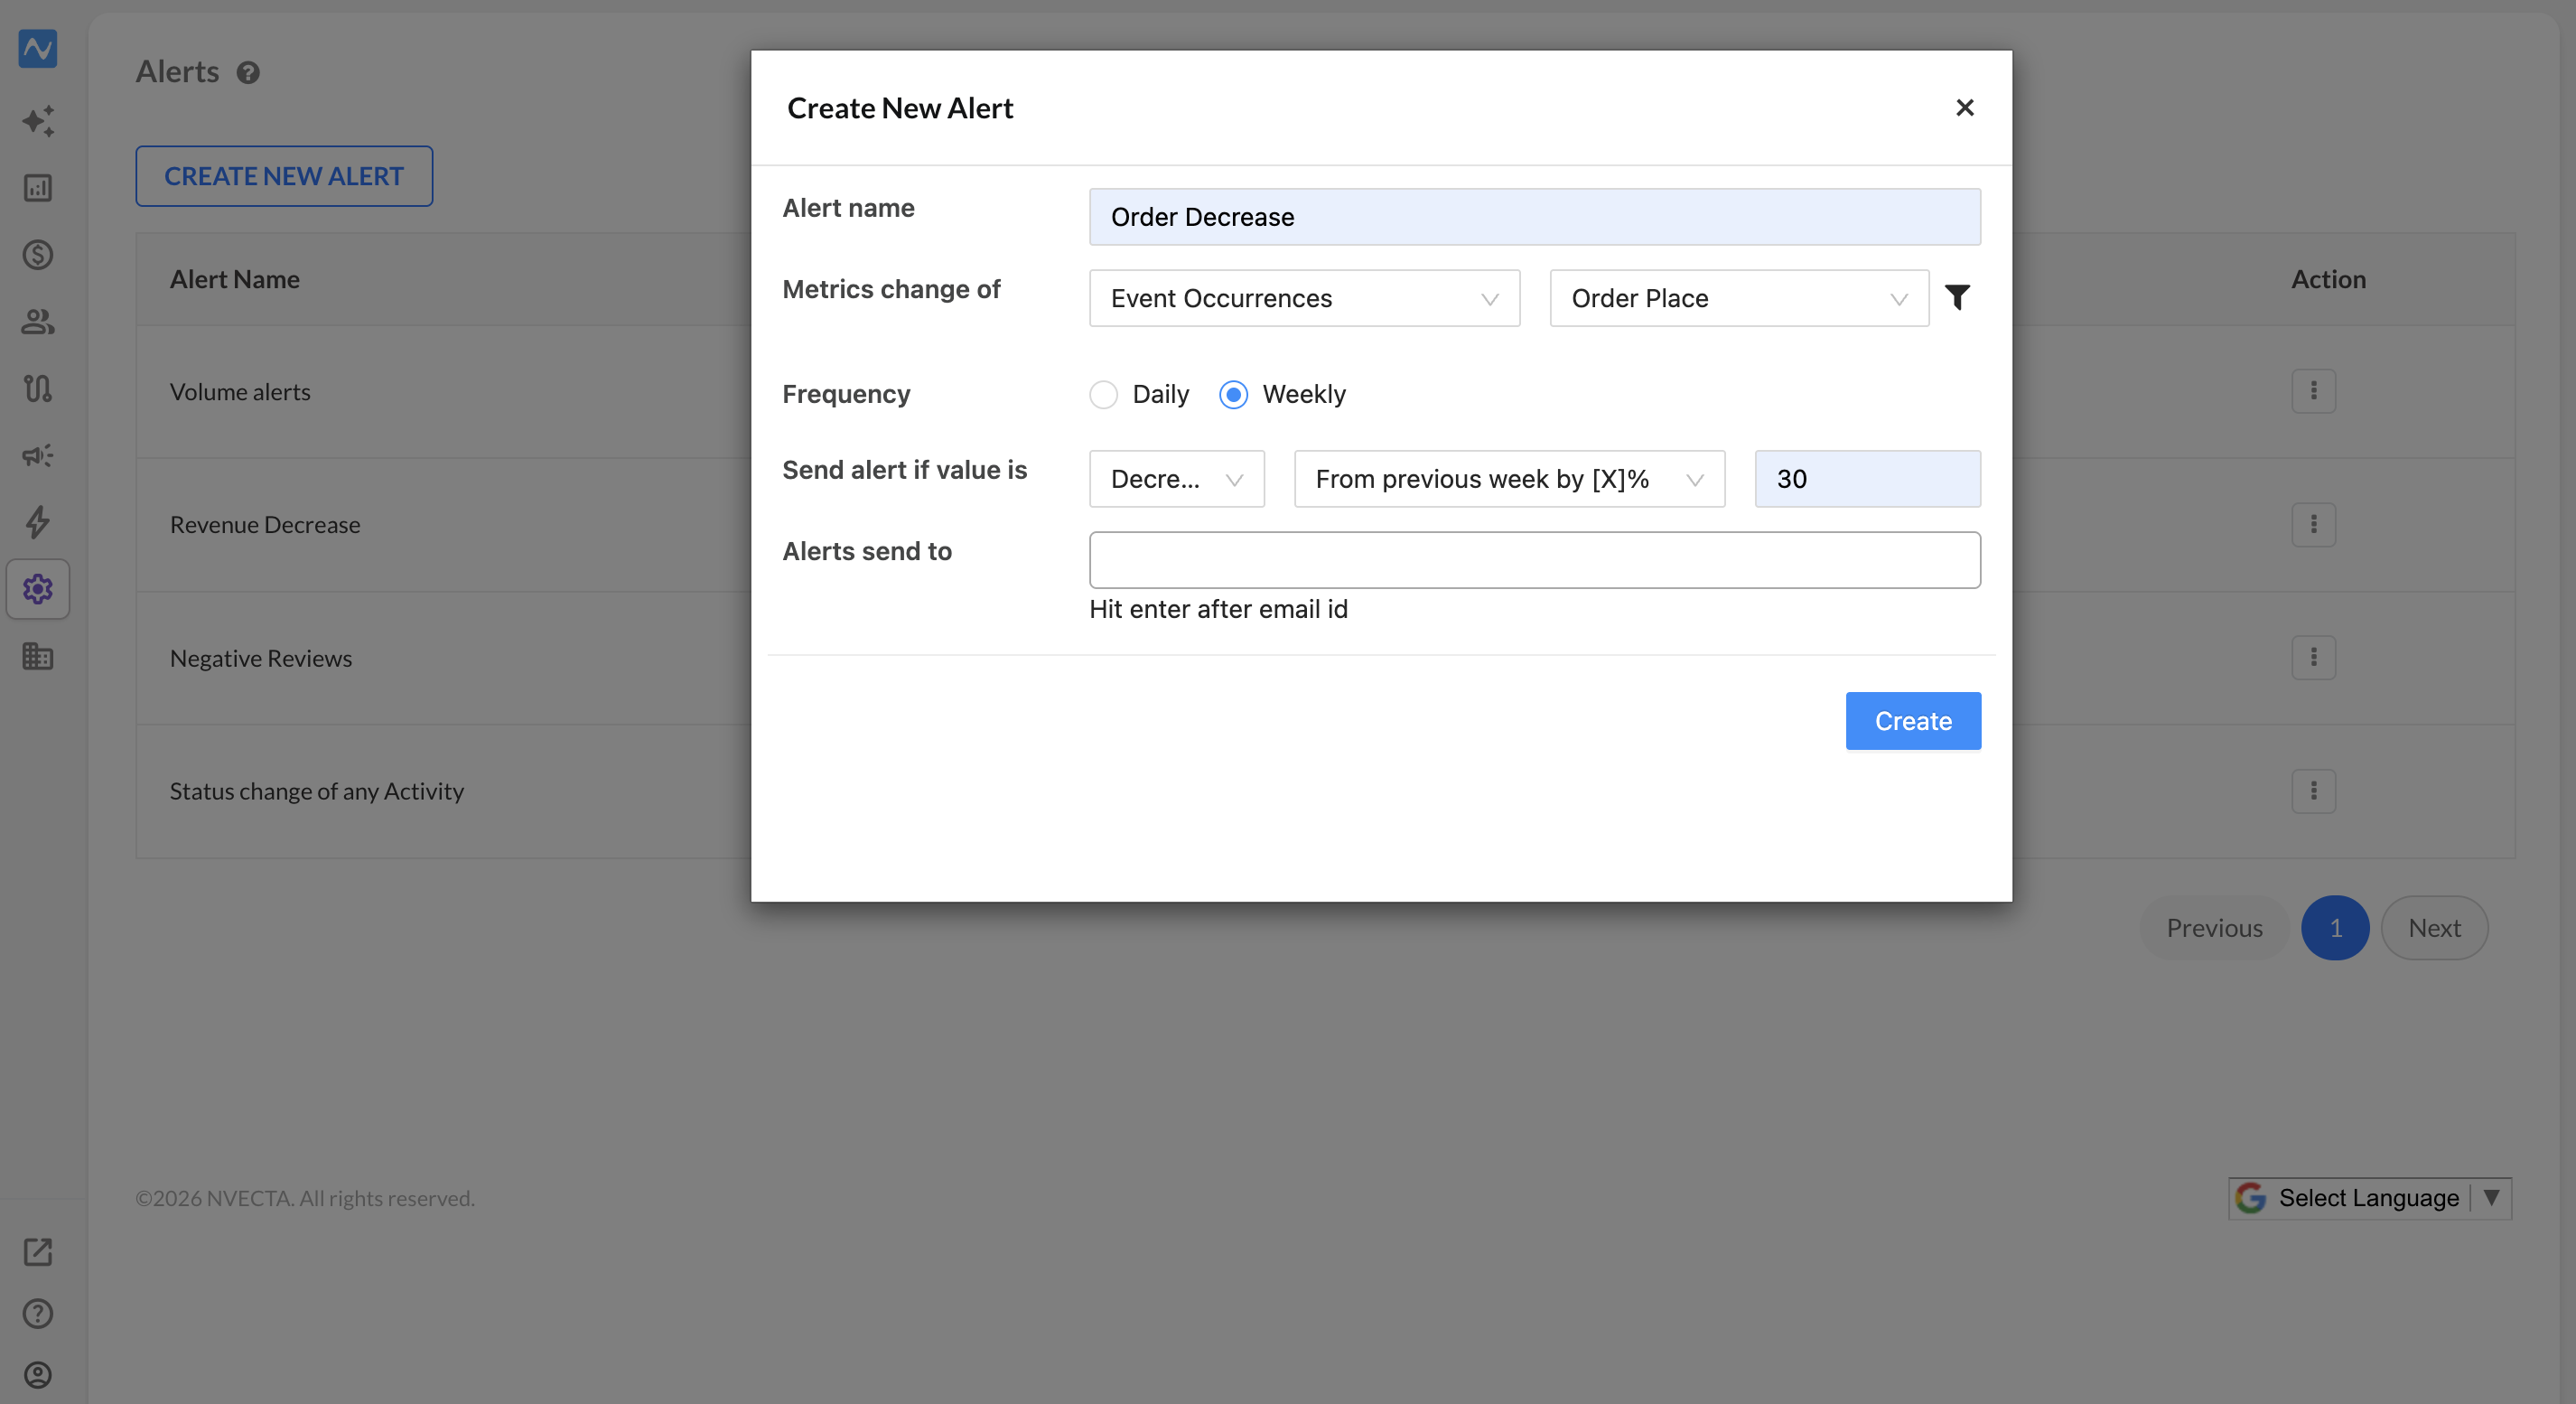
Use this when you already know what wrong looks like, such as Order Placed falling more than 30% week on week, or when you want to watch a slice of an event rather than all of it.
Option C — Alert on a saved Insights report
Where: Analytics → Insights → open a saved report → the … menu in the top right → Alert
The two alerts above watch raw event counts. To watch a metric you have already built and saved as a report, create the alert on the report itself.
The dialog offers:
- Alert name.
- Metric change of — the event on the report.
- When — Anomaly detection or Custom threshold met.
- Confidence interval, for anomaly detection only — 99%, 95% or 90%.
- Send alert if value is, for custom thresholds only. Under Absolute value: Above or Below. Under Percentage: Increase by more than or Decrease by more than. Then the value itself.
- Frequency — Daily or Weekly.
- Alerts send to — comma separated email addresses.
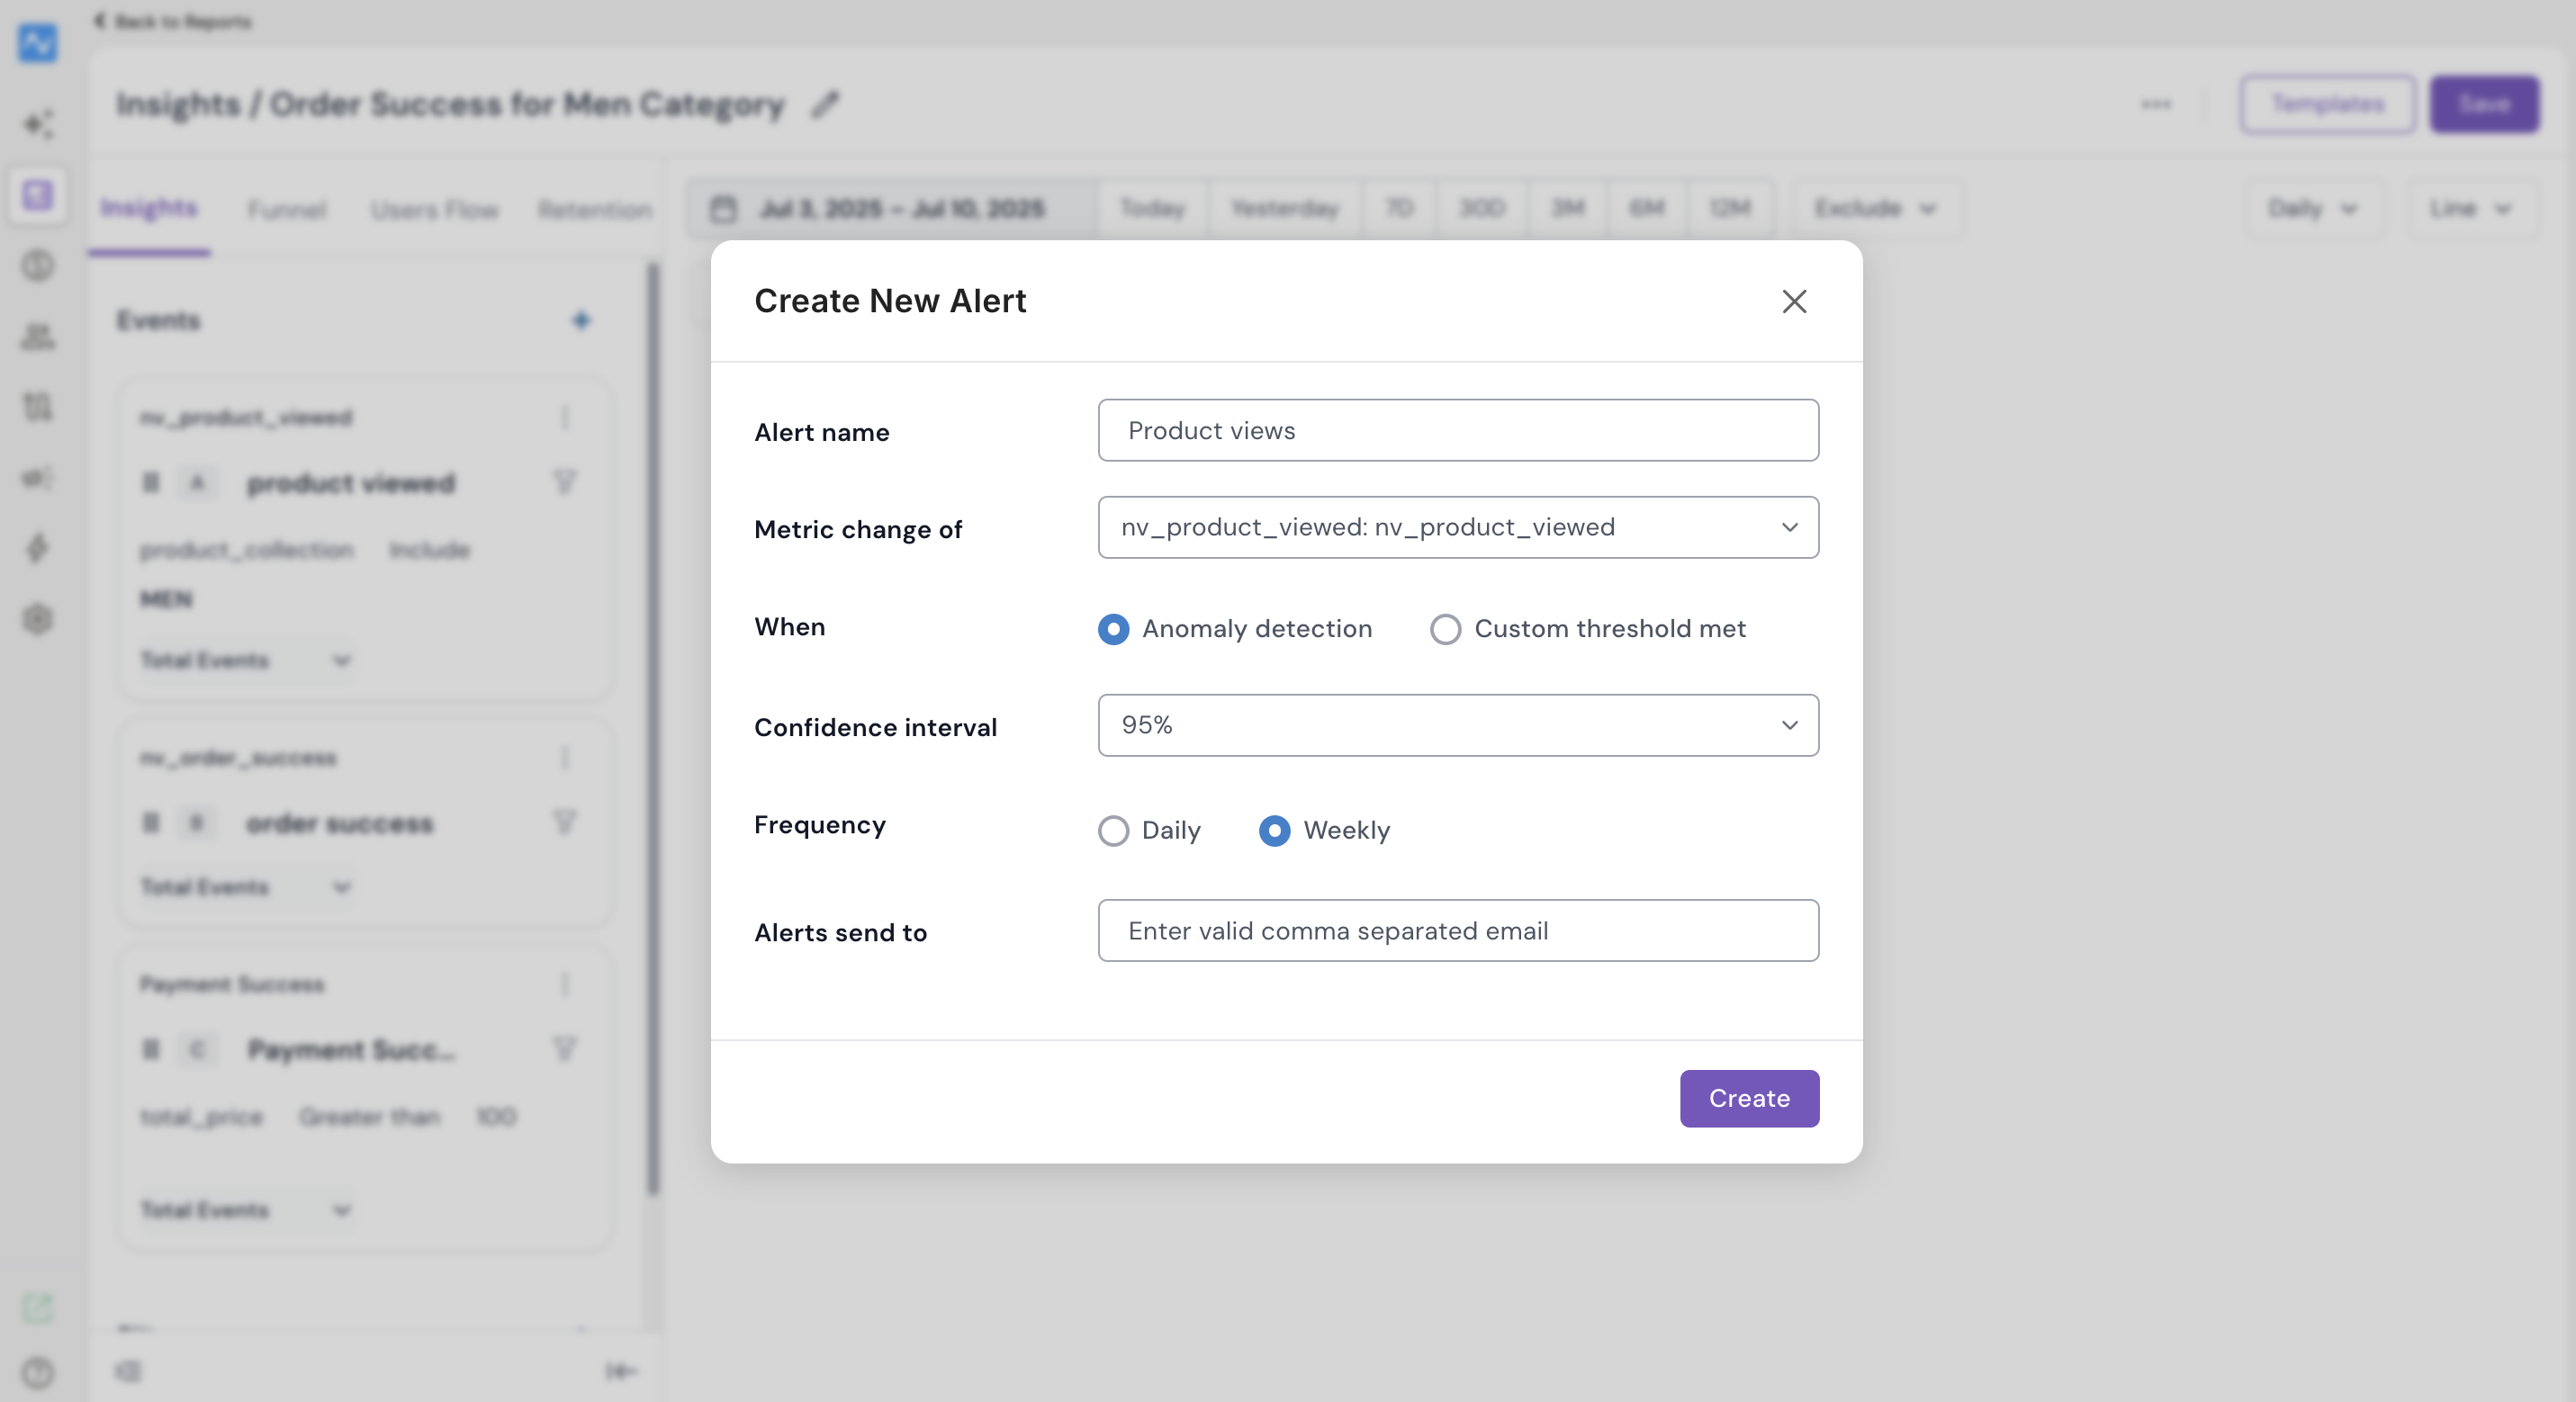
Confidence interval is the dial for how noisy the alert is. At 99% the model must be very sure before it mails you, so you get fewer alerts and fewer false ones. At 90% you get earlier warning and more noise. 95% is the default and suits most events.
Part 2 — Read the Event Volume alert mail
The subject line reads Alert Triggered: Anomaly Detected, and the banner summarises how many events were flagged and under which scope.
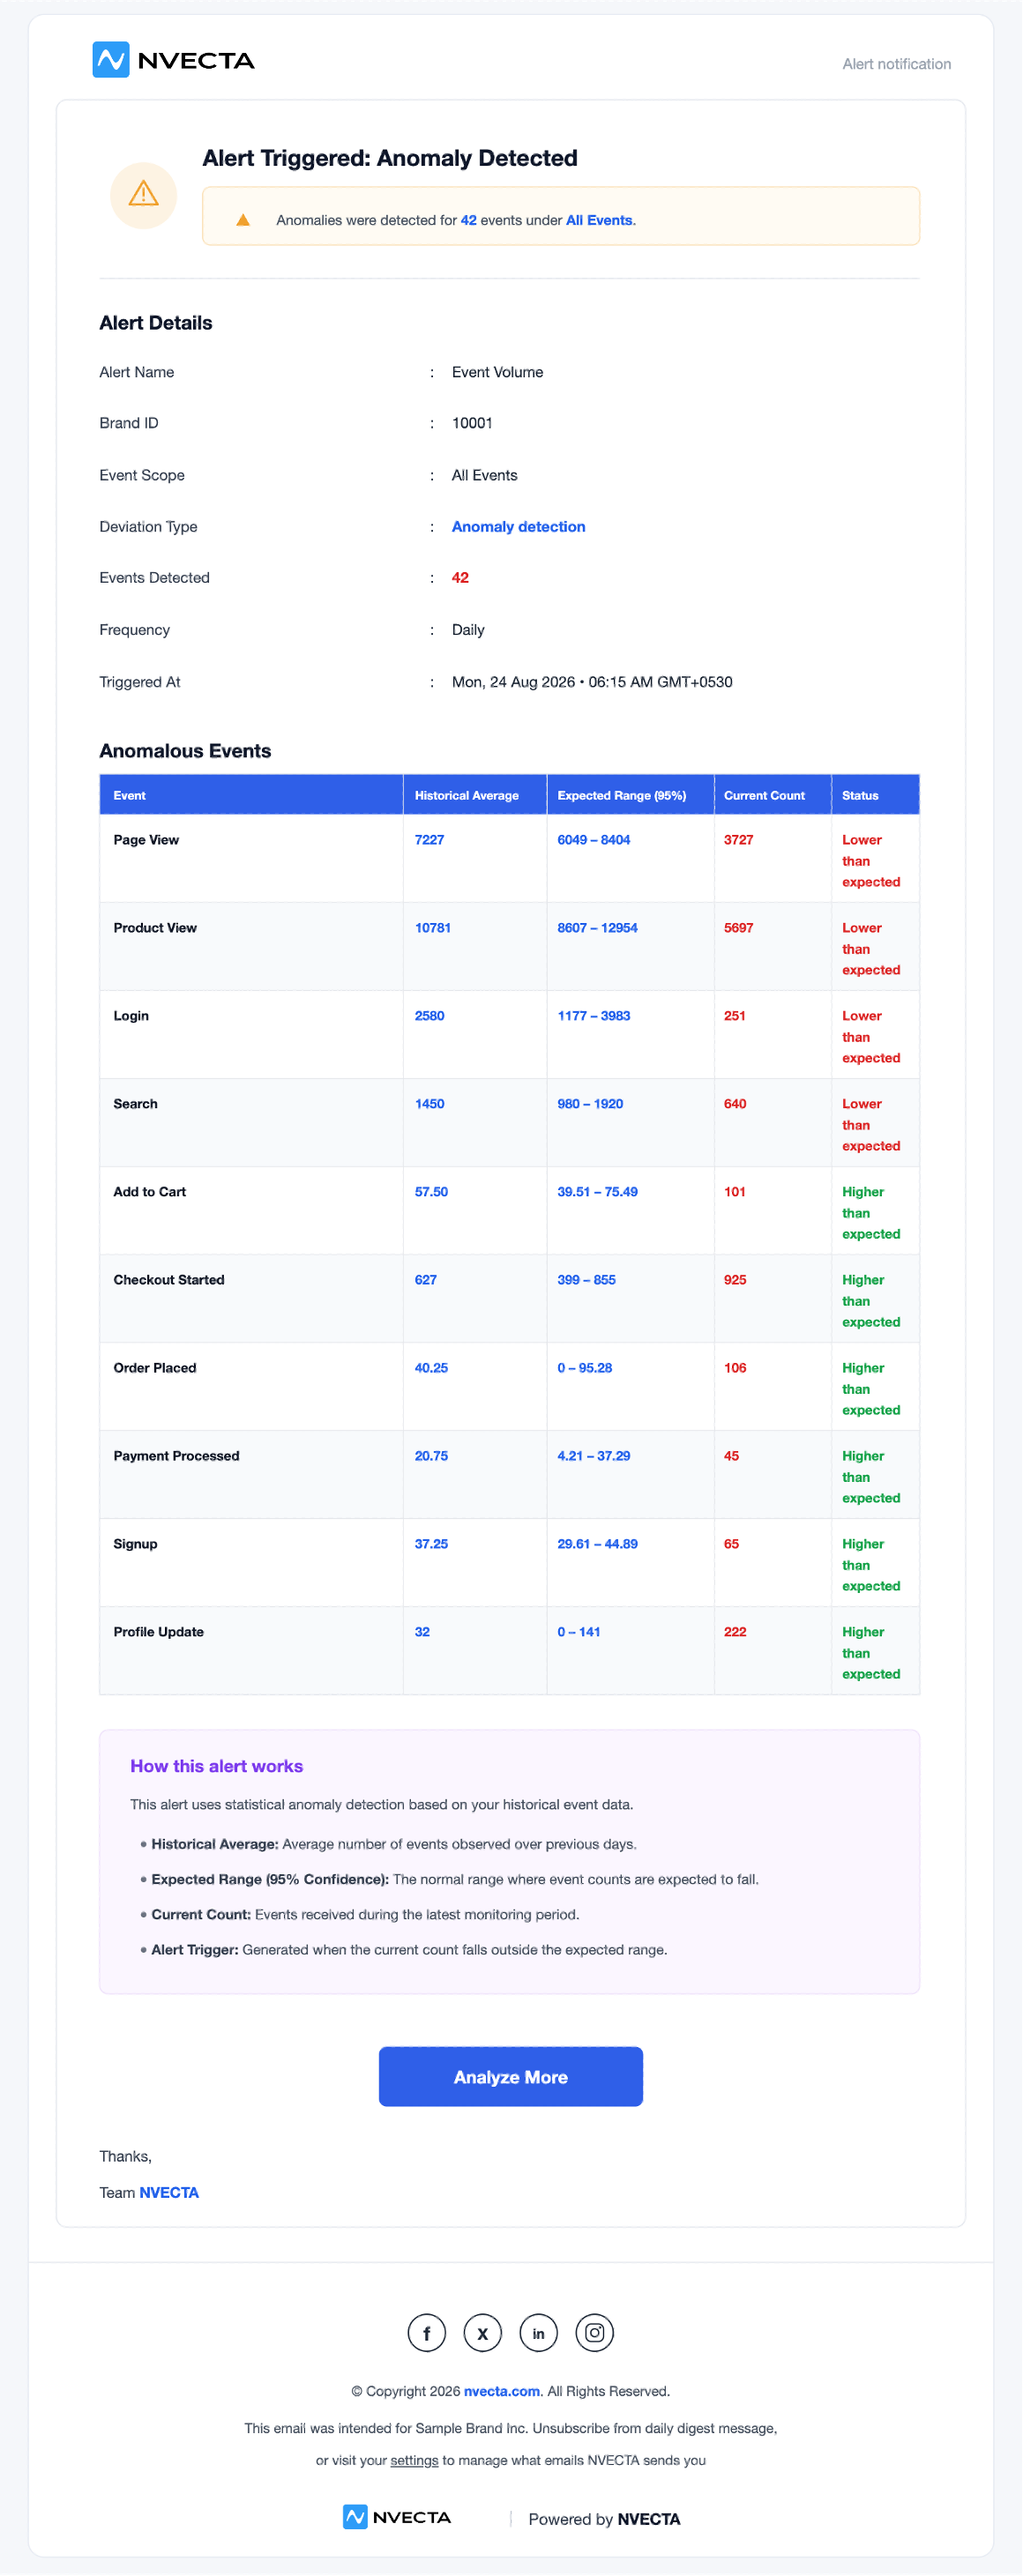
Alert Details
| Field | What it tells you |
|---|---|
| Alert Name | The name given to the alert when it was created. |
| Brand ID | Which brand the data belongs to. Quote it when you raise a ticket. |
| Event Scope | All Events, or the single event the alert watches. |
| Deviation Type | Anomaly detection, or the threshold configured on the alert. |
| Events Detected | How many events were flagged in this run. |
| Frequency | Daily or Weekly. |
| Triggered At | When the check ran. Line this up against your release log. |
Anomalous Events
This is the table that matters. For each flagged event it shows Historical Average, Expected Range (95%), Current Count, and a Status of Higher than expected or Lower than expected.
The How this alert works box below the table restates the maths, and Analyze More button opens the detail in the console.
Part 3 — What the numbers mean
- Historical Average — the average number of these events observed over previous days.
- Expected Range (90% / 95% / 99% Confidence) — the band around that average where the count should normally fall, derived from how much the event varies day to day. The confidence level sets how sure NVECTA has to be before flagging: at 99% only large deviations are flagged, at 90% smaller ones are too.
- Current Count — what actually arrived in the latest monitoring period.
- Status — set when the Current Count falls outside the Expected Range: Lower than expected below it, Higher than expected above it.
The width of the range is itself information. An event with a historical average of 7227 and a range of 6049 – 8404 is steady traffic, and a count outside it is worth investigating. An event with an average of 40.25 and a range of 0 – 95.28 swings so much day to day that even zero would be statistically normal. The model is telling you it cannot say much about that event.
Part 4 — Why some events never appear in the alert
NVECTA does not raise an anomaly alert for an event whose average daily volume is under 20. Below that level the deviation calculation stops being meaningful.
The reason is arithmetic. When an event fires a handful of times a day, one extra user, one QA session or one bot can move the count by a large percentage. Left unsuppressed, that would fill the daily mail with events nobody reports on.
What that means in practice:
- A new event will not alert until it is doing real volume. Validate a newly released event in Live Stats and Event Logs, not by waiting for a volume alert to say something.
- A genuinely low-traffic event is not covered. A niche flow or a rarely used setting will never be flagged by all events anomaly detection. If you need to watch one, use a single-event alert with your own threshold, or an alert on a saved Insights report (Part 1).
- An event that has fallen to near-zero is below the floor too. If an event stops appearing in the mail entirely, check it in the console rather than reading the absence as good news.
Part 5 — What to do when an alert fires
- Start with the events you report on. Work down the Anomalous Events table by importance, not by row order. A funnel event outside its range matters; a low-volume event drifting usually does not.
- Lower than expected on a core event usually means tracking broke. A tag removed in a release, an SDK that stopped firing, an event renamed in code but not in the panel. Check what shipped around the Triggered At timestamp.
- Higher than expected usually means an event is firing more than once, or bot and test traffic is being counted, or a campaign genuinely landed. Check the release log before you celebrate.
- A cluster moving together points upstream. If Page View, Product View, Login and Search all drop on the same day, the problem is at SDK or tag level, not in one event definition.
- Confirm in the console before you escalate by clicking the Analyse More button.
- If the hits are arriving but being rejected, this is the wrong tool. Volume alerts count what was stored. Rejected values land in Settings → Error Logs, covered in User and Event Observability and in Troubleshoot event tracking.
Part 6 — Keep the alert worth reading
- Send it to people who can act on it. An alert that only reaches an inbox nobody owns is not monitoring.
- Do not chase every row. The mail is a prompt to look, not a list of incidents.
- Re-read it after a known change. Following a deliberate release, campaign or seasonal peak, the next mail tells you whether the new level has settled.
- Pair it with validations. Volume alerts tell you counts changed. They cannot tell you the values inside those events are wrong, which is what custom validations and Error Logs are for.
Where to check what
- Counts moved across many events at once: the All Events Volume alert mail.
- One event you care about crossed a number you set: a single-event alert mail.
- A metric on a saved report moved: Insight reports alert or in Analytics → Insights.
- An event too small to be covered by anomaly detection (build your own threshold instead): a single-event alert mail.
- Hits are arriving but values are being rejected: Error logs alert or Settings → Error Logs.
Was this article helpful?
That’s Great!
Thank you for your feedback
Sorry! We couldn't be helpful
Thank you for your feedback
Feedback sent
We appreciate your effort and will try to fix the article