
User and Event Observability
Everything NVECTA does — segments, journeys, campaigns, reports — runs on the events and attributes your apps send in. User and event observability is the habit of finding out yourself when that stream changes shape or when values start getting rejected, instead of hearing about it from a colleague whose report looks wrong.
This article sets up three checks and one fix-it loop:
-
Volume alerts tell you when event counts move outside their normal range.
-
Error alerts and Error Logs tell you exactly what was rejected, and let you close the issue once it has been fixed.
-
Custom validations stop bad attribute values from being stored in the first place.
If you are new to how events and attributes are defined in NVECTA, read Track Events — Definitions, Attributes and Events and Event configuration first.
Part 1 — Set volume alerts
Where: Settings → Alerts
A volume alert watches how many events you receive and mails you when the count moves outside its usual range. It is the fastest way to learn that a release removed a tag, an SDK stopped firing, or an event suddenly started firing twice.
To create one:
-
- Go to Settings → Alerts.
-
- Click CREATE NEW ALERT.
-
- Enter an Alert name.
-
- In Metrics change of, select Event Occurrences, then set the scope in the second dropdown (All Events in the example below).
-
- In Alerts send to, type an email address and press Enter. Repeat for each recipient.
-
- Click Create.
The alert is then listed on the Alerts page, where the Action menu lets you manage it later.
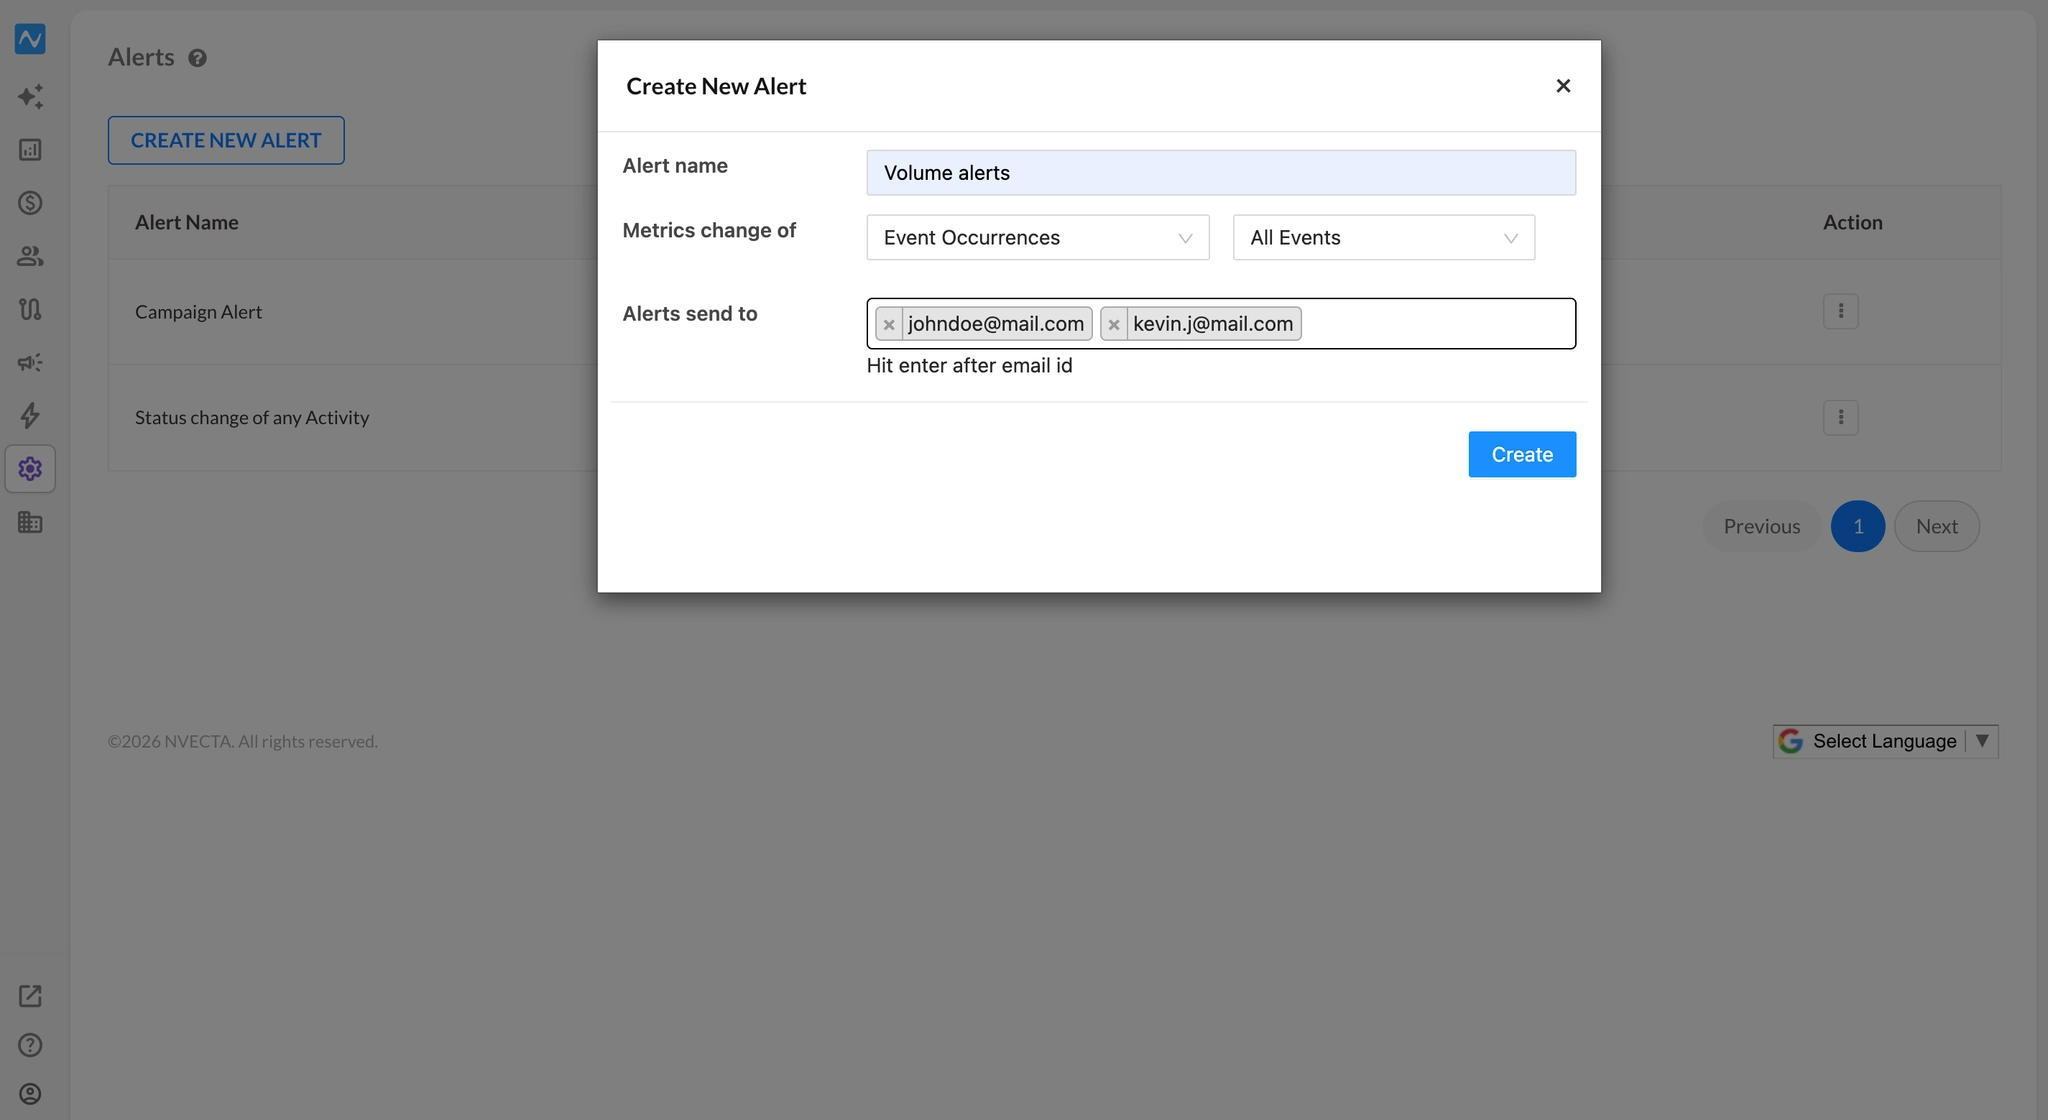
Each row on that page shows Alert Name, Frequency, Status, Subscribers, Last Updated, and Action.
Volume alerts for saved reports
The alert above watches all events volume. To watch one specific saved Insights report instead, build the alert there: Analytics → Reports → Insights, open the saved report and use the ⋯ menu in the top-right.
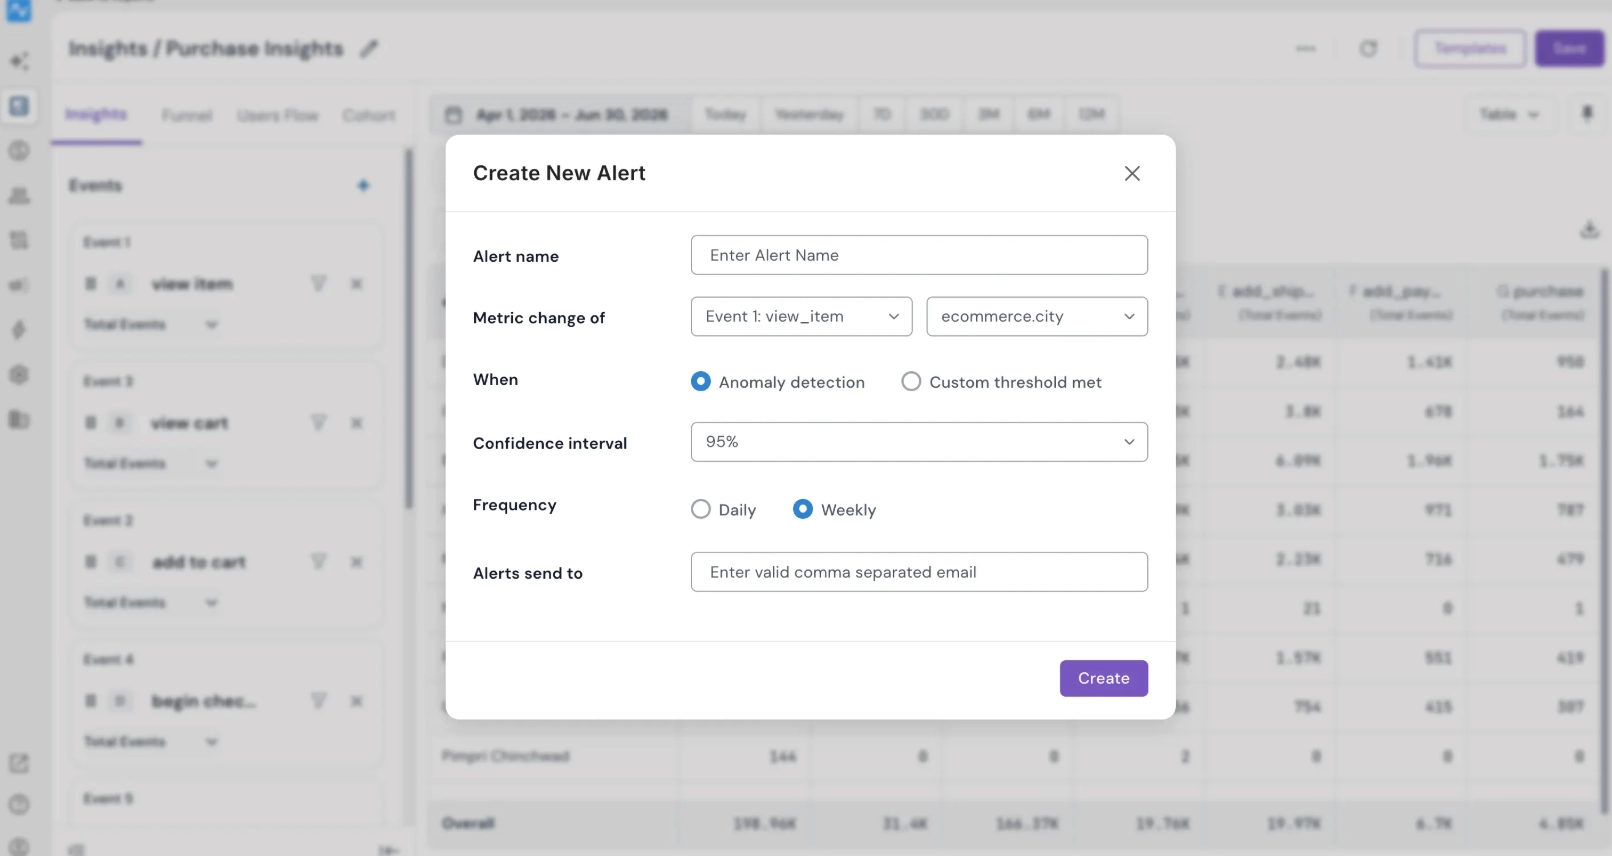
Those alerts let you pick a custom threshold or anomaly detection at a 90%, 95% or 99% confidence level, daily or weekly. Full details: Understanding Event Volume Anomaly Alerts.
Part 2 — Turn on error alerts
Where: Settings → Alerts
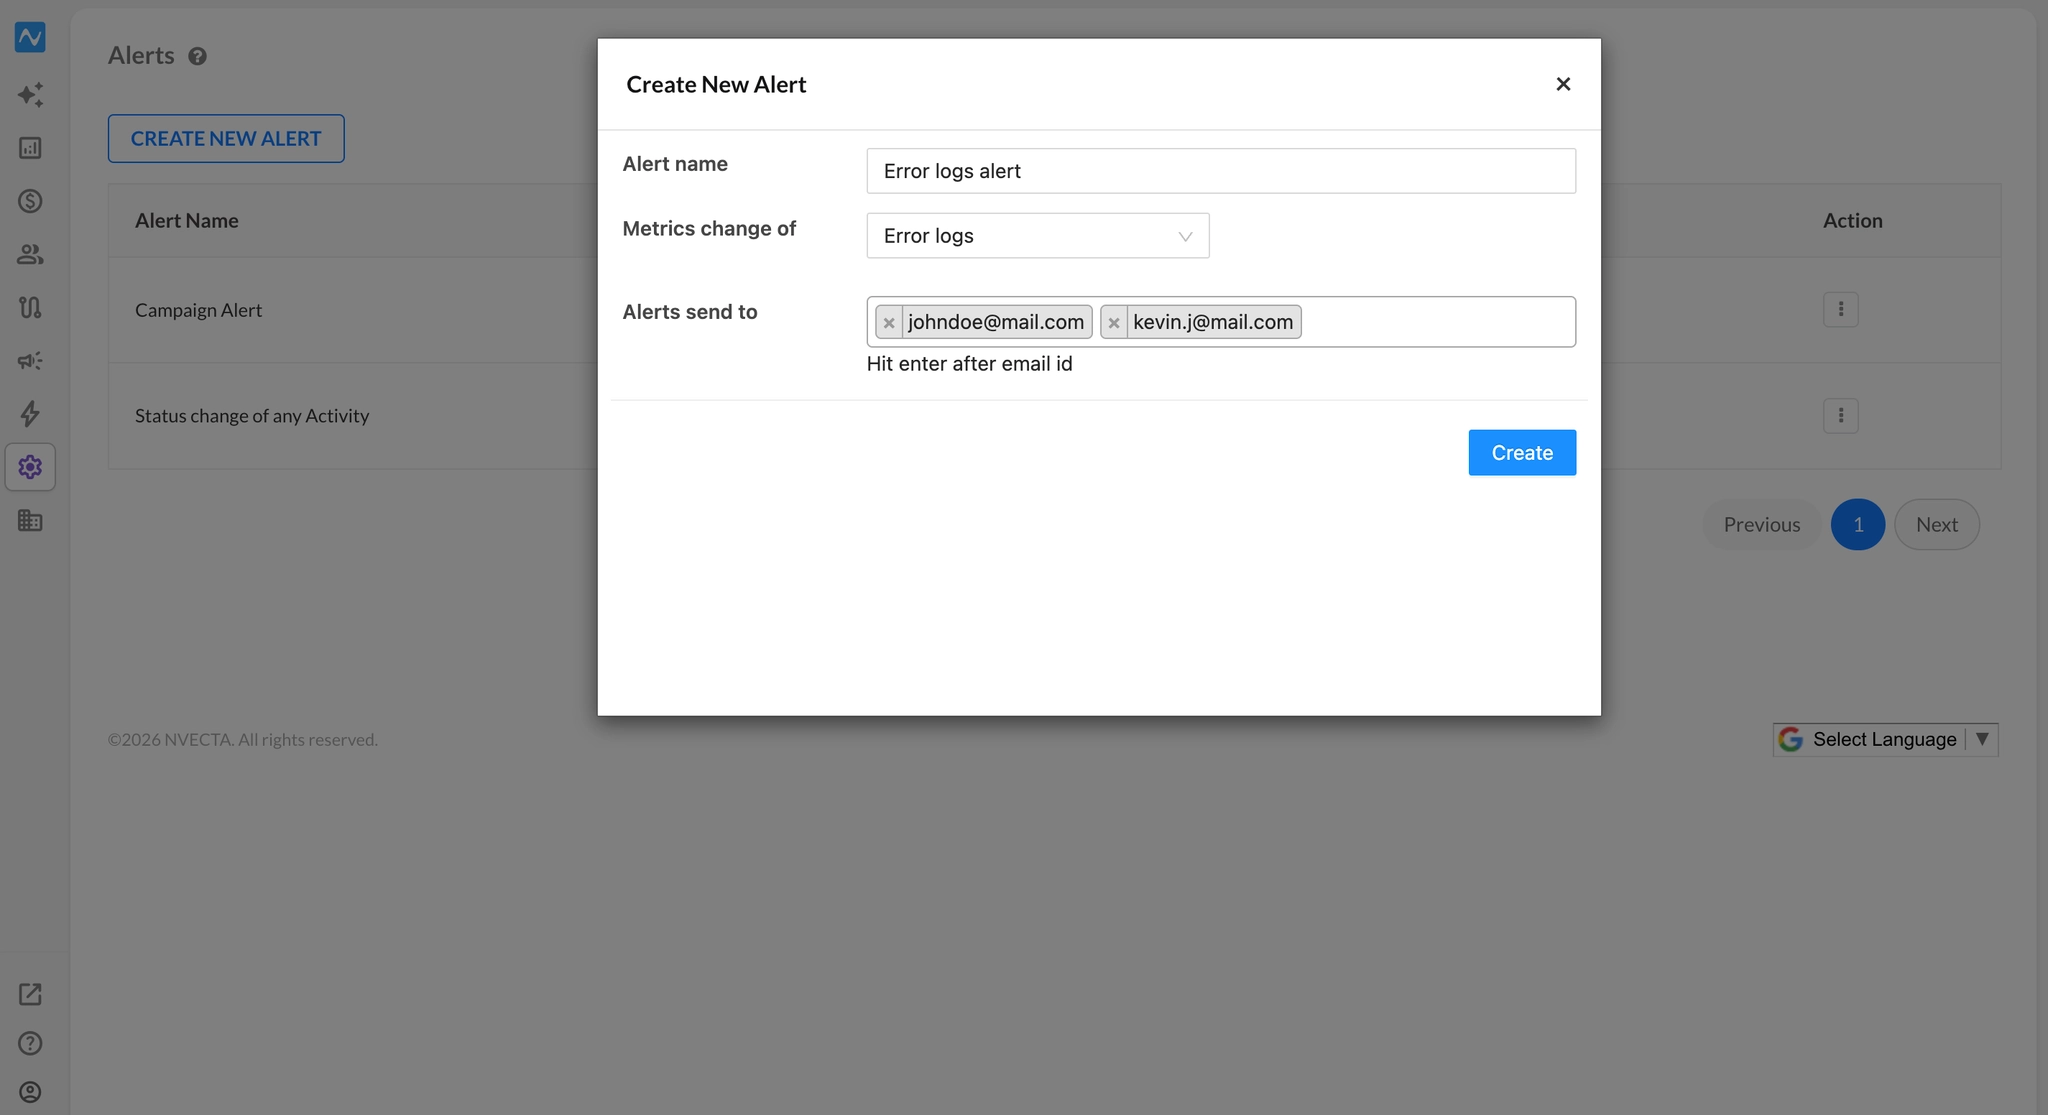
An error alert mails you when entries land in Error Logs, including the custom validation errors you set up in Part 3.
Create it exactly like the volume alert, with one change: in Metrics change of, select Error logs. Add the recipients in Alerts send to and click Create.
Part 3 — Add custom validations
Volume alerts tell you that something changed. Validations tell you what is wrong with the data itself.
Without custom rules, NVECTA still rejects hits that break the attribute's data type, and those rejections land in Error Logs. Custom validations let you go further and define what a valid value actually looks like for your organisation — a required attribute, a length range, a pattern, or a fixed list of accepted values. Anything that fails is rejected before it is stored, so reports, segments and campaigns keep running on clean data.
Event attribute validation
Where: Settings → Events → expand the event → the attribute's menu → Edit
The edit dialog is titled with the attribute name and offers:
-
Description - free text, so the next person knows what the attribute is for.
-
Required - Yes or No.
-
Data Type - shown for reference; it is fixed and cannot be changed here.
-
Min Length / Max Length - character bounds.
-
Regex ‒ a pattern the value must match.
-
Possible values ‒ a fixed list of accepted values.
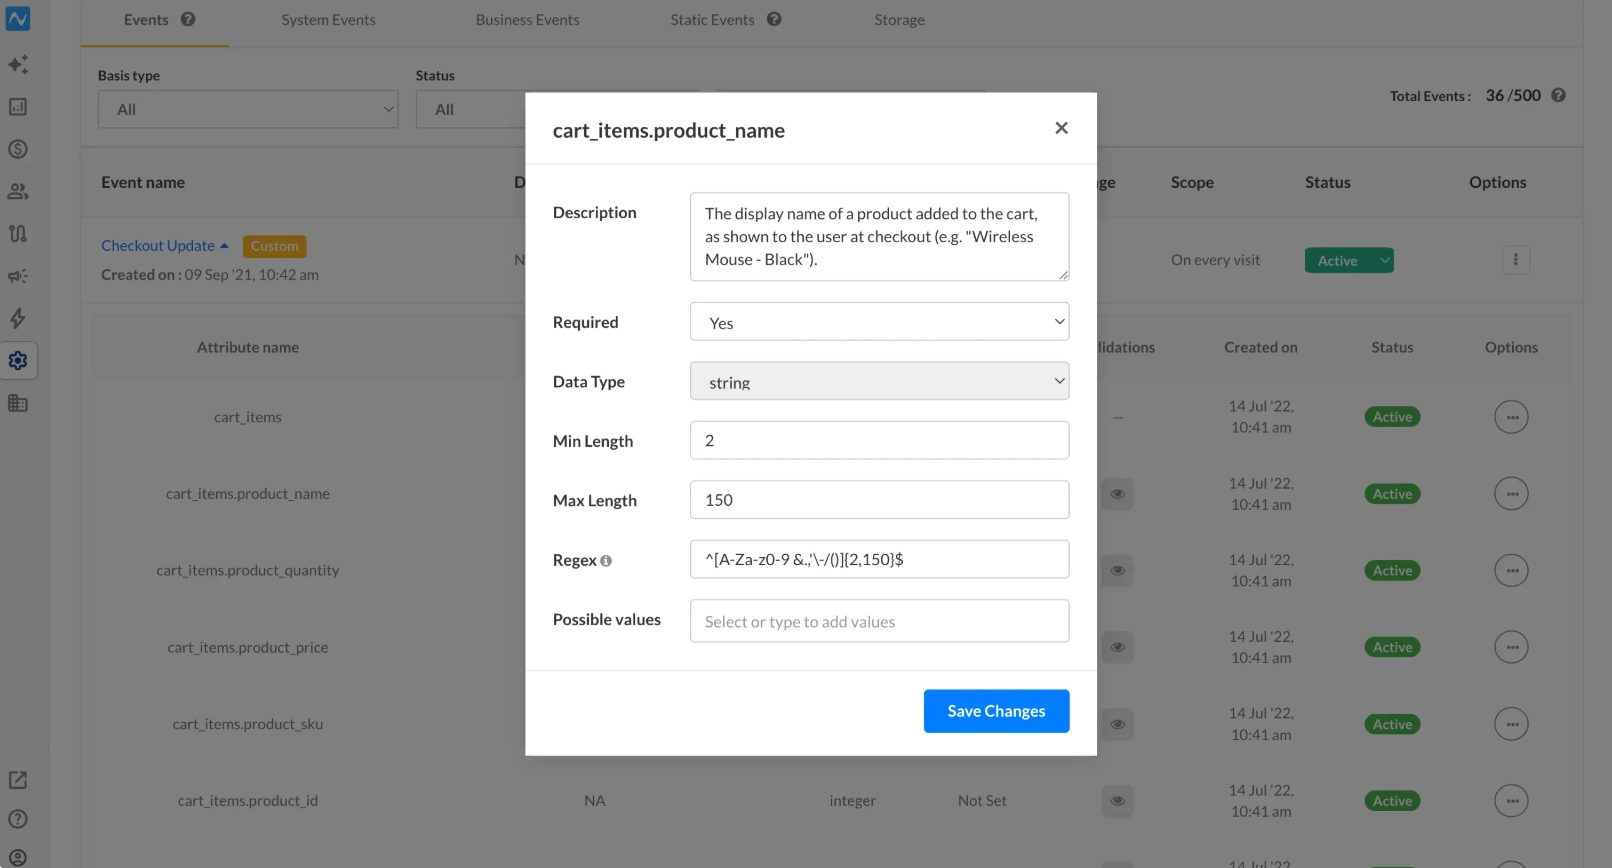
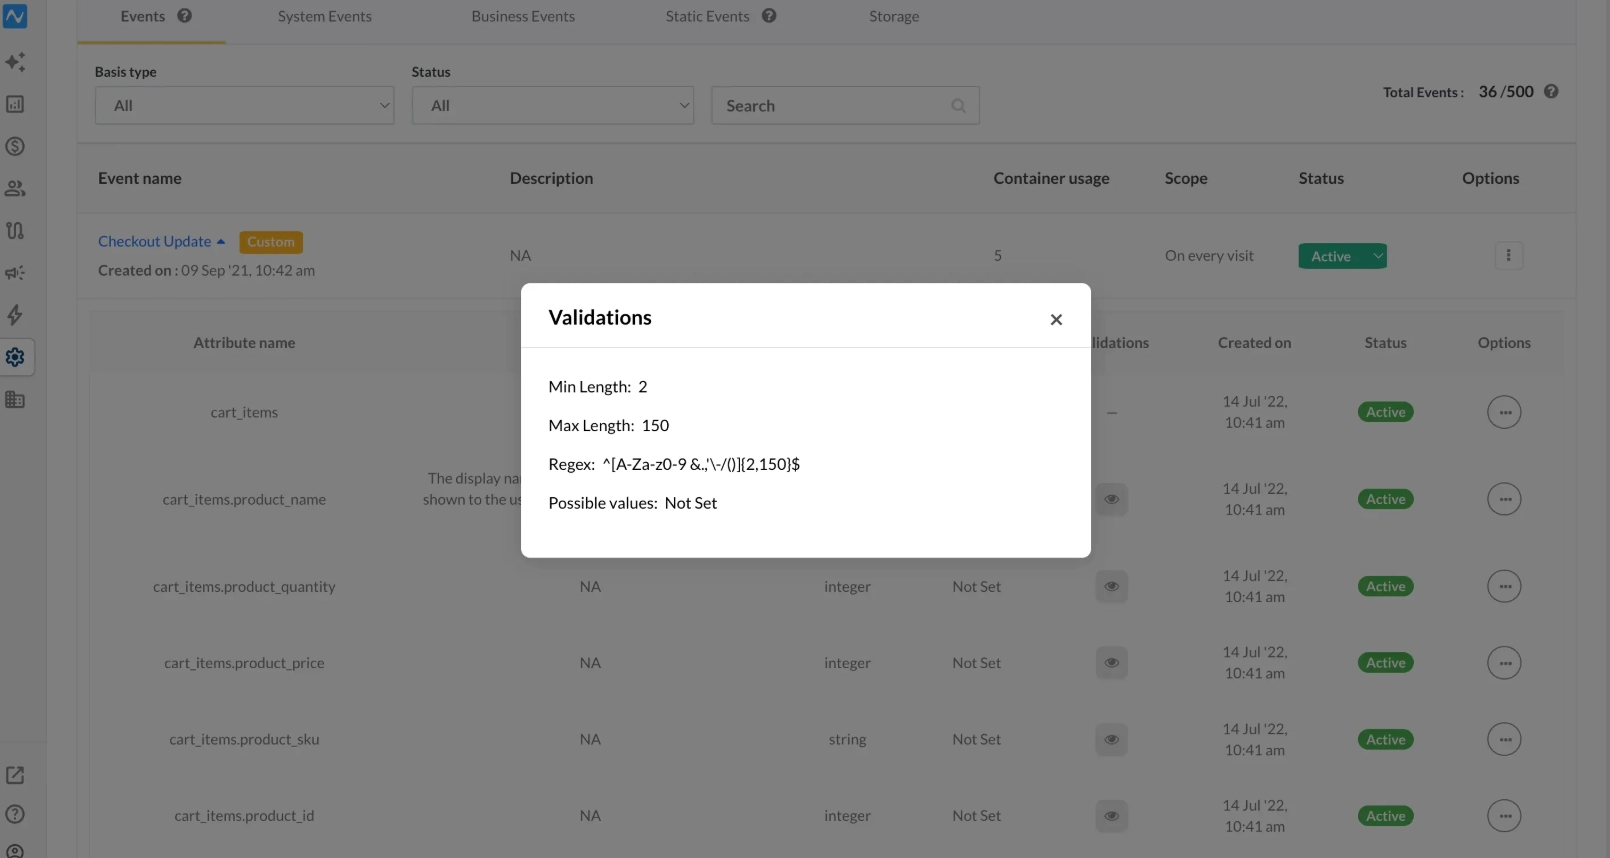
Click Save Changes. To review what is already in force, use the eye icon in the Validations column of the attribute list. The same ⋮ menu also offers Discard.
User attribute validation
Where: Settings → Users → User Attributes
The list header shows your Total Attributes count and a Search by Attribute Name box. Each row carries the attribute name, its creation date, data type, Label Name, an Is PII toggle, Status, and an Options menu.
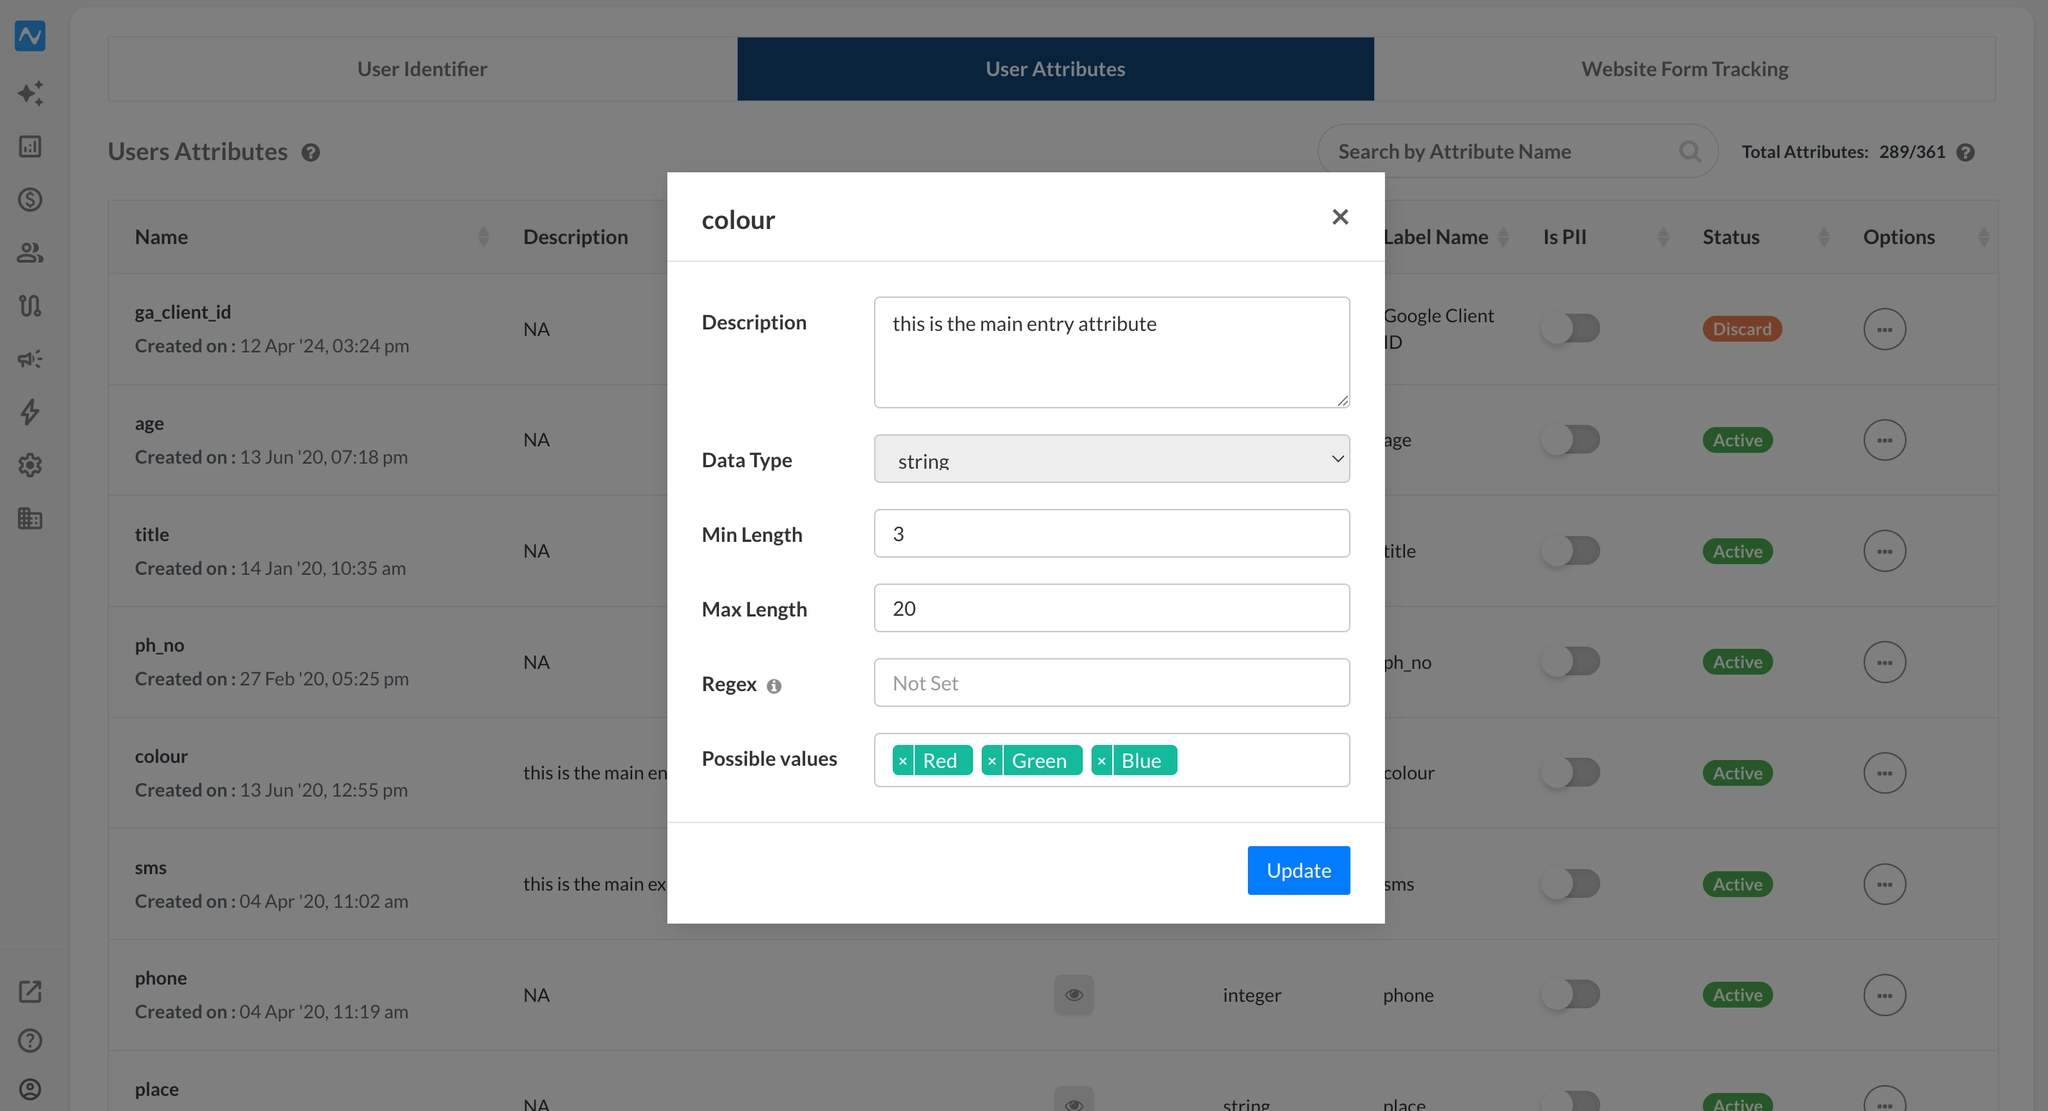
Open an attribute's edit dialog the same way. The fields you see depend on the data type — a numeric attribute such as age offers Description, Data Type, Min Value, and Max Value, then Update.
When a user or event attribute fails validation, the hit is not silently dropped and forgotten — it is recorded in Error Logs, covered in part 5.
Part 4 — Read the alert mails
Volume alert mail
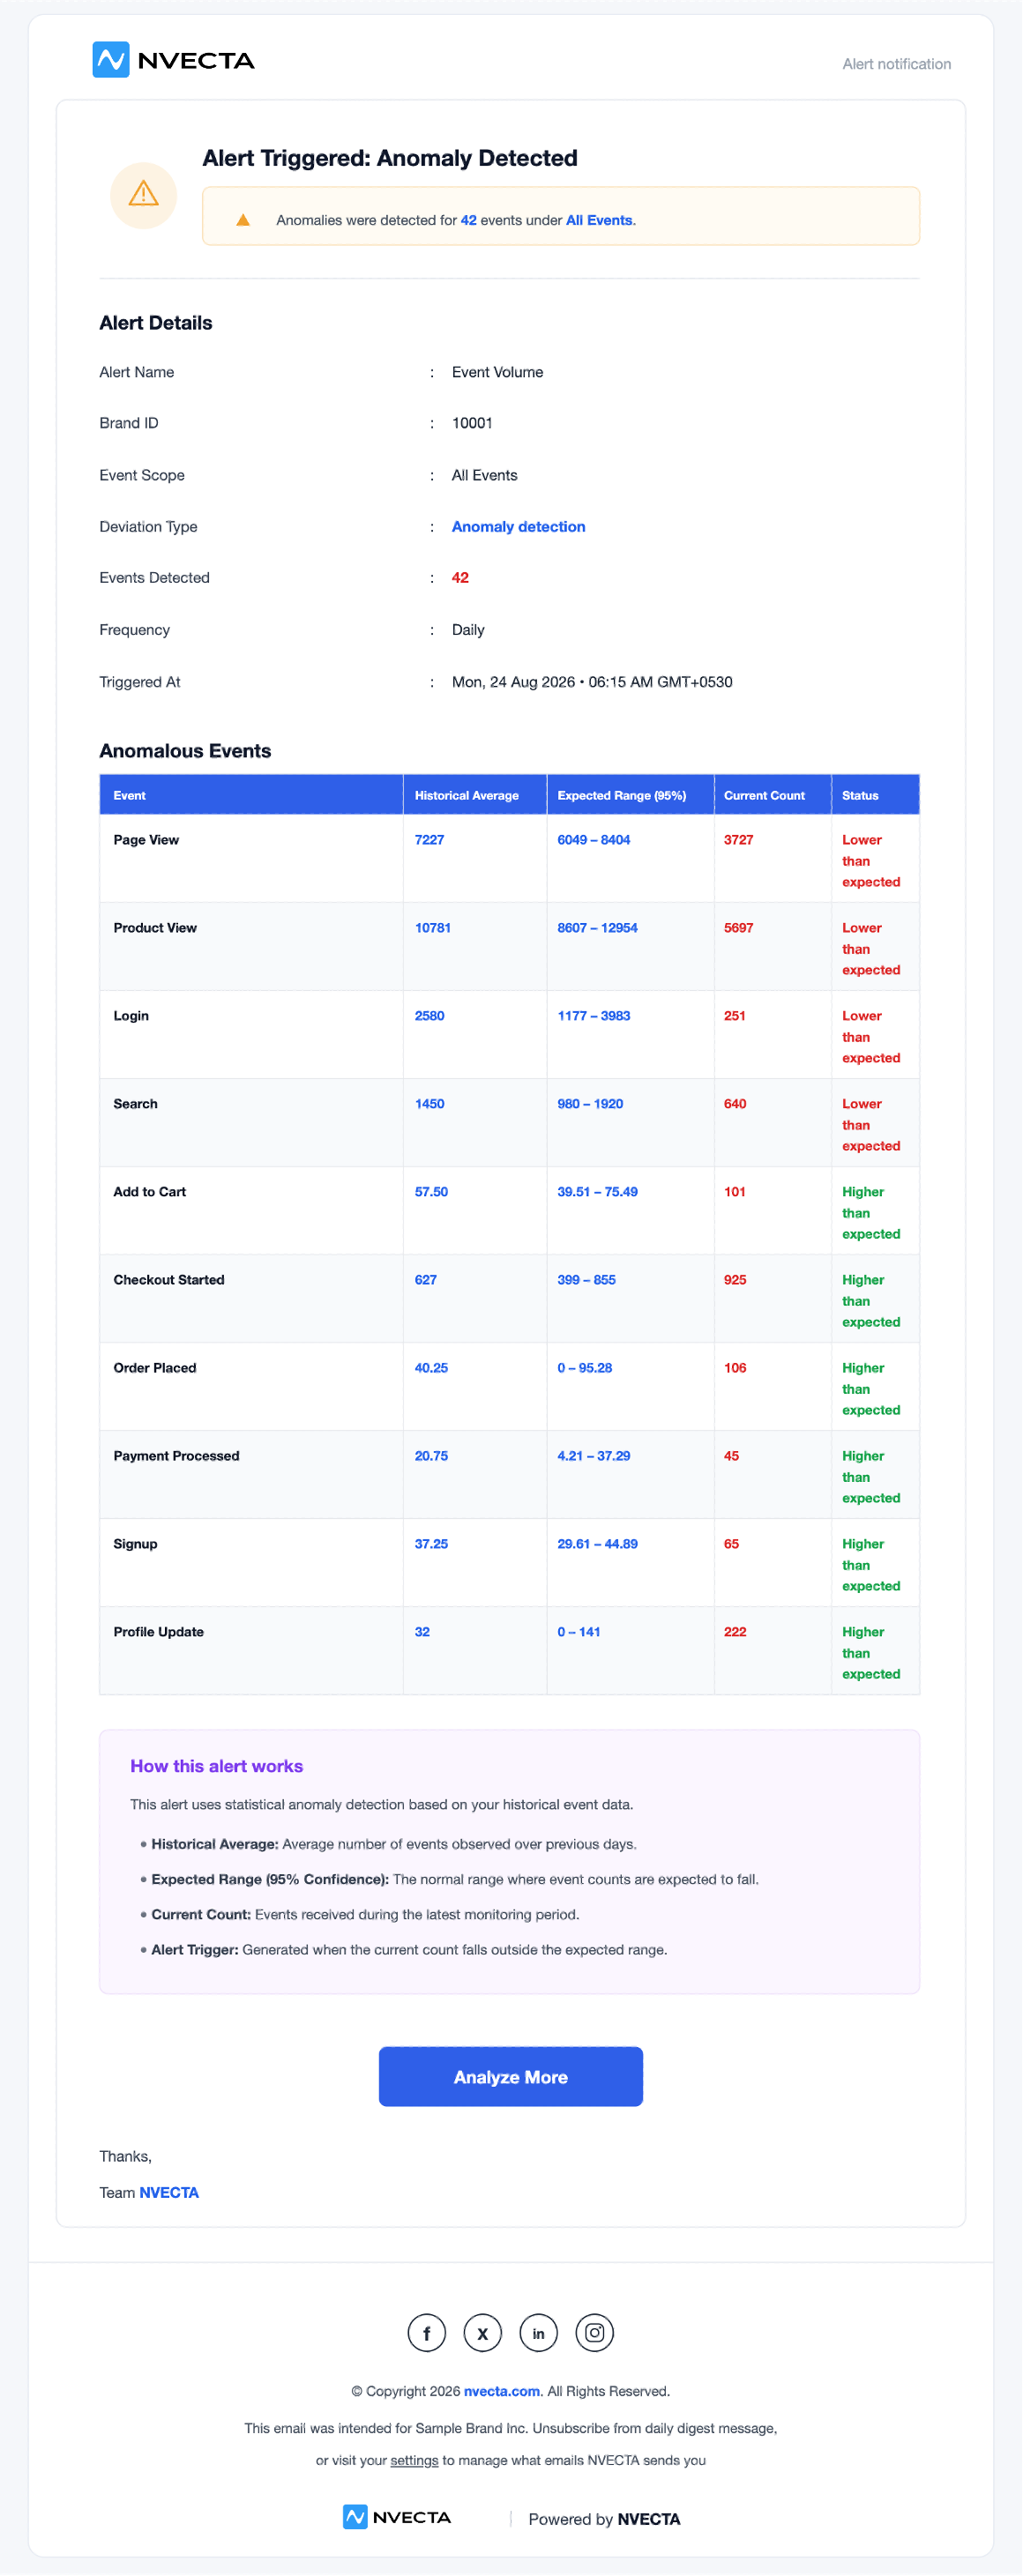
The mail's Alert Details block gives the alert name, Brand ID, event scope, deviation type, events detected, frequency and trigger time, and the Anomalous Events table lists each flagged event with its historical average, expected range (95%), current count and status. Analyse More opens the detail in the console. For a field-by-field walkthrough of this mail, see Understanding Event Volume Anomaly Alerts.
Error logs mail
What arrives depends on whether you have set custom validations:
-
With custom validations configured - the error logs mail includes your custom validation failures alongside the default errors.
-
Without them - you receive the default error logs mail only, covering errors such as data type mismatches, attribute limits, etc.
Two mails are sent:
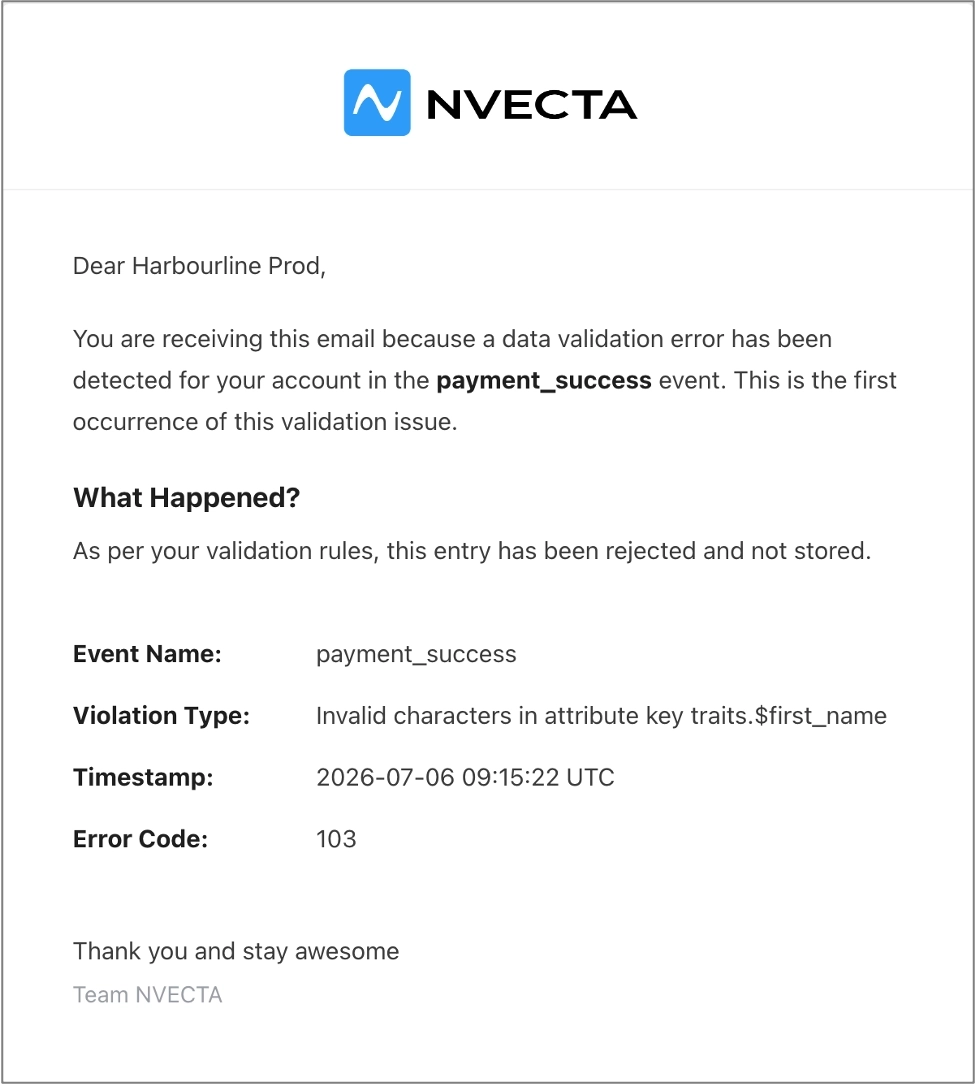
- Instant mail, on the first occurrence of each distinct error. Repeat occurrences of the same error do not resend, so a single broken release does not flood the inbox.
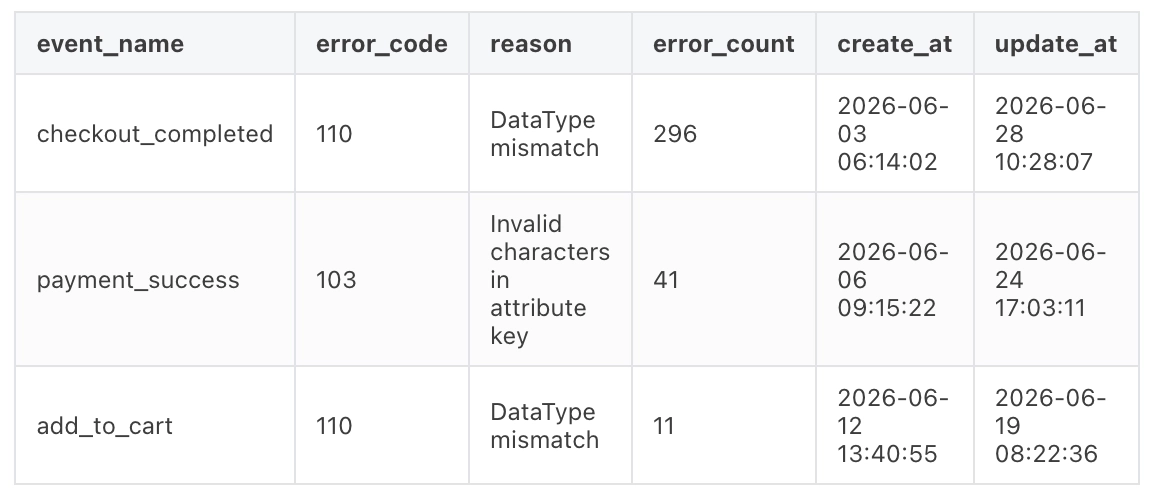
- Monthly report, on the 1st of each month, covering the previous month with a CSV attachment listing event names, error codes, reasons and error counts.
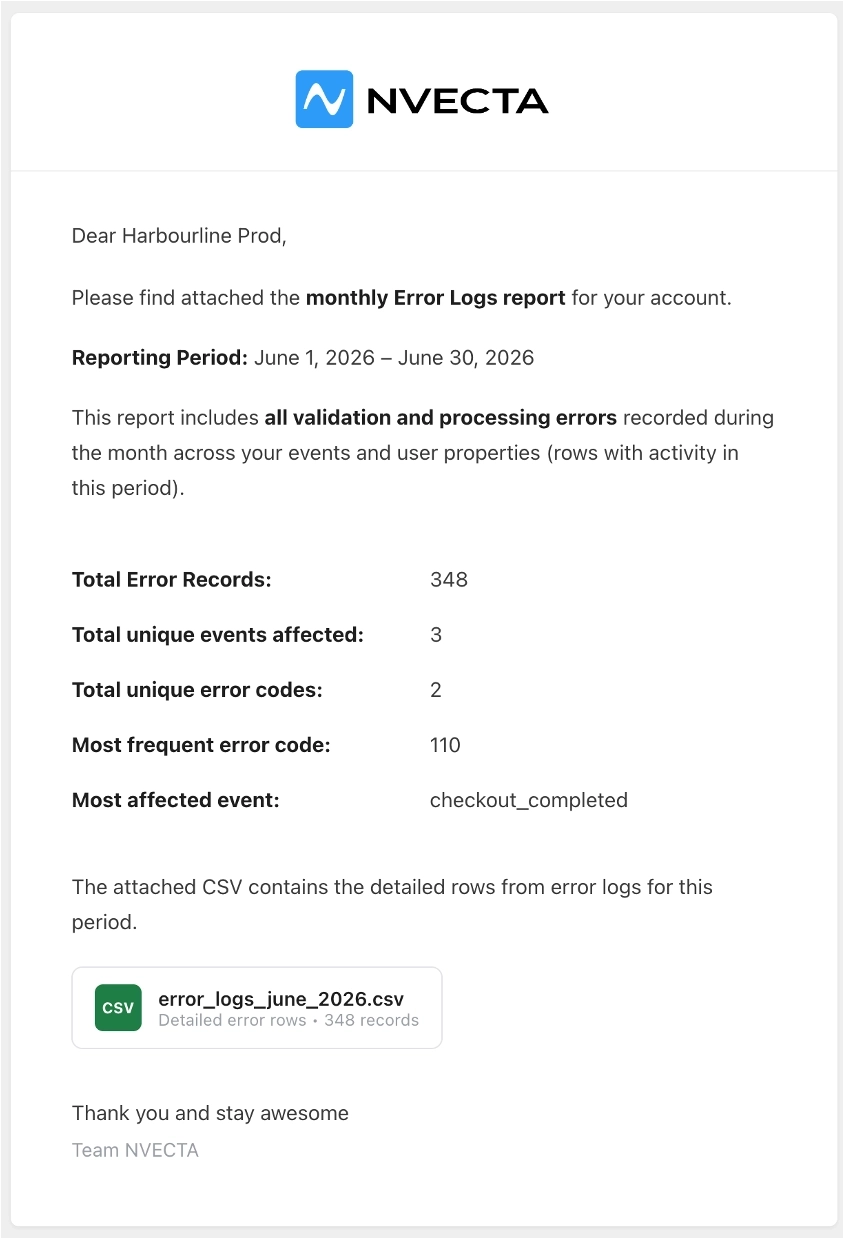
The CSV is the easiest thing to hand to a developer. Preview of the attached CSV:
Part 5 — Check the errors in Error Logs
Where: Settings → Error Logs
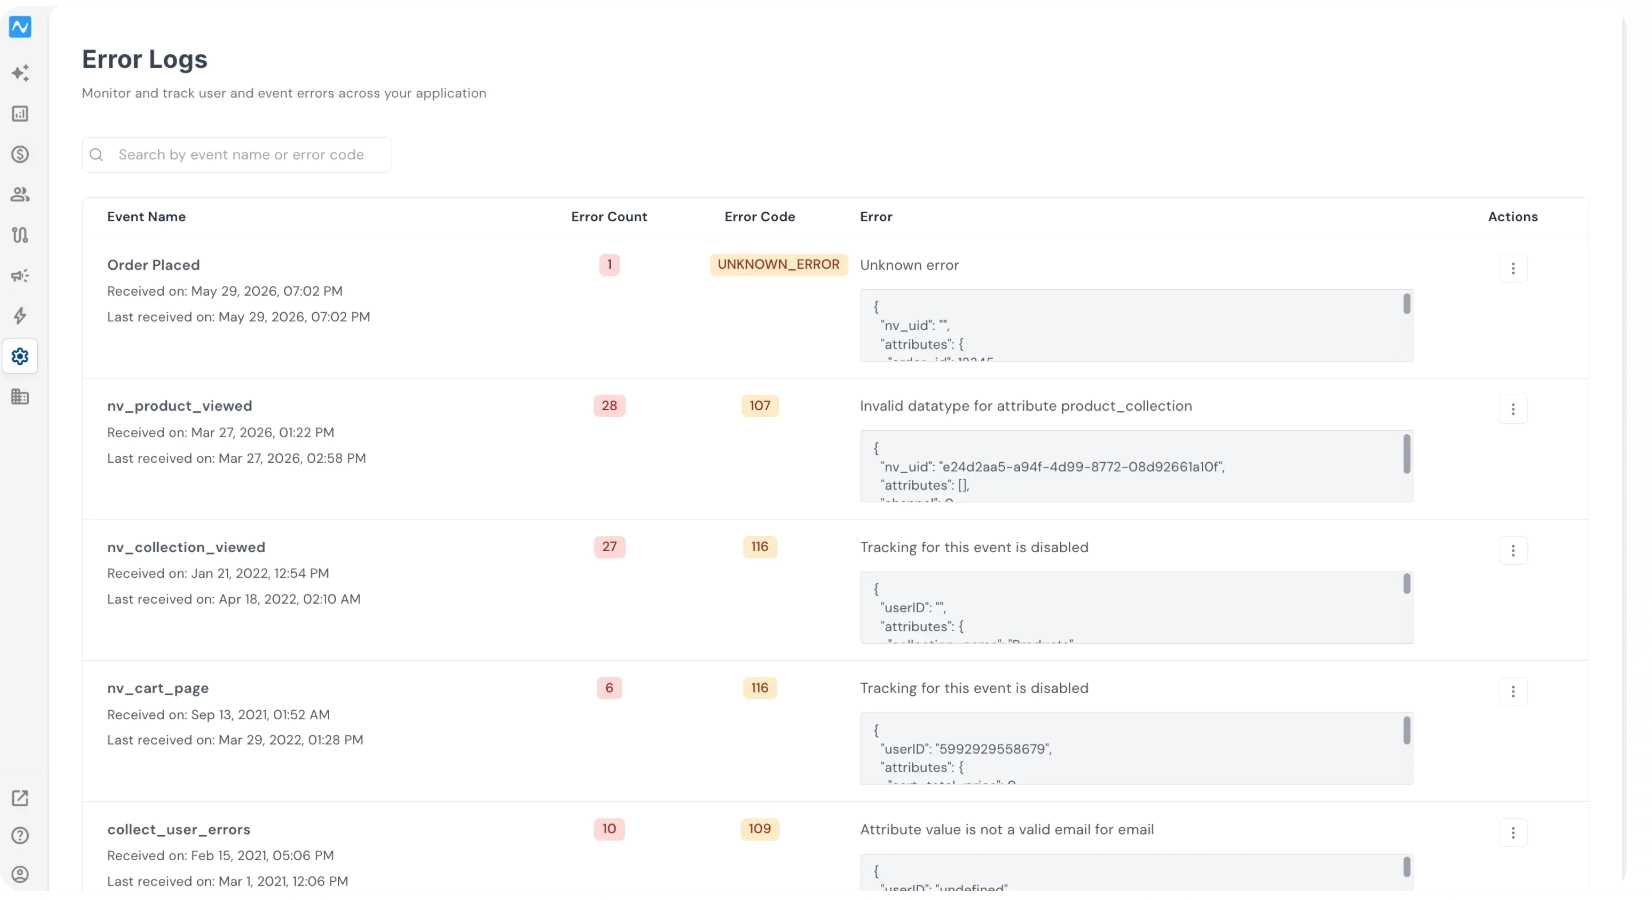
This page is the single place where every rejected hit lands. Use Search by event name or error code to narrow it down.
Each row gives you:
-
Event Name, with Received on (when the error was first seen) and Last received on (when it was last seen).
-
Error Count ‐ how many hits this error has affected.
-
Error Code - the code to quote when you raise the issue.
-
Error - the message, plus the raw payload that was rejected, so you can see the offending value in context.
-
Actions — the ⋮ menu, with Resolve and User schema.
Two habits make this list manageable:
-
Sort your attention by Error Count, not by date. An error affecting thousands of hits on a funnel event matters more than one affecting a handful.
-
Read Last received on before you raise anything. If the last occurrence is weeks old, the bug has probably already been fixed and the row is just waiting to be resolved.
Part 6 — Hand the issue to your developers
Error Logs tells you what was rejected. Only the team that owns the tracking code can tell you why.
Give them everything from the row so they do not have to guess:
-
The event name and the error code.
-
The error message in full.
-
The payload snippet from the Error column.
-
Received on and Last received on, so they can line the error up against a release.
-
The rule the attribute is supposed to satisfy - its entry in Settings → Events, or in Settings → Users → User Attributes.
Most rejections come down to a small set of causes: an attribute sent with the wrong data type, a value longer than the Max Length, a value outside Possible values, a Required attribute missing, or an attribute name in the code that does not match the one configured in the panel.
Once a fix is deployed, developers can confirm it end to end — Live Stats for real-time hits, Event Logs for attribute-level detail, and User One View for a specific profile. The steps are in Integration Code, Event, and User Validation.
Part 7 — Mark it resolved and keep watching
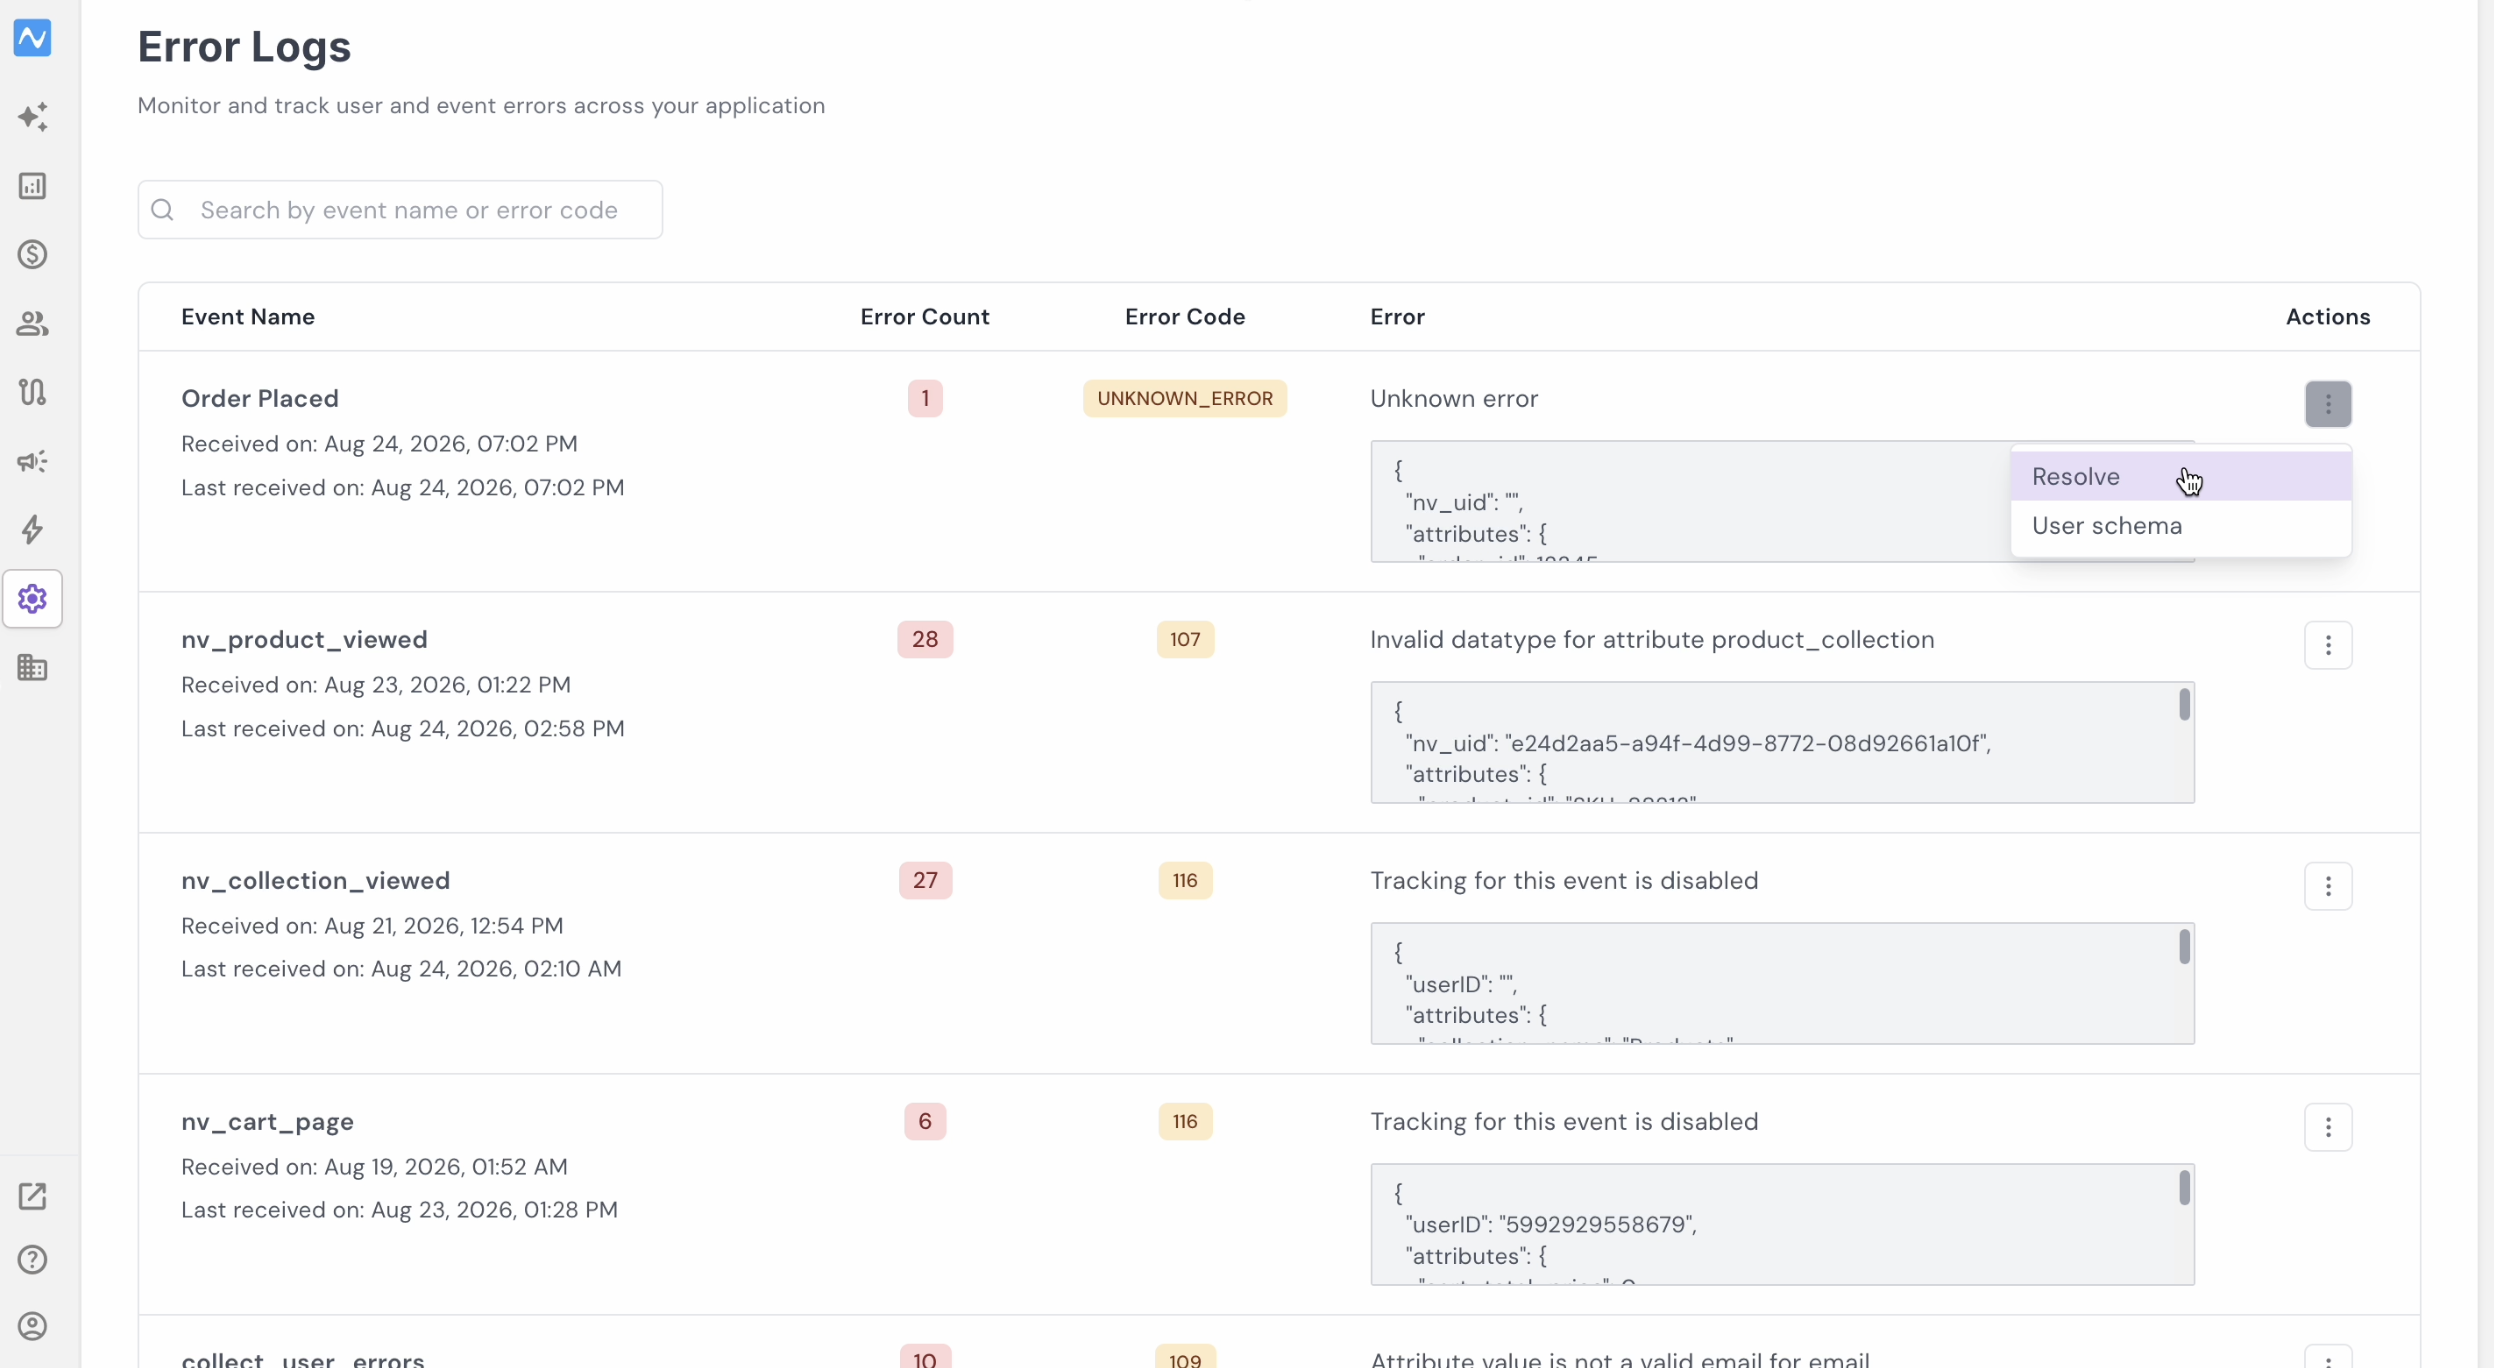
When the fix is live and you have confirmed the error has stopped arriving, open the row's ⋮ menu in Settings → Error Logs and click Resolve. That keeps the list to genuinely open problems, so the next person who opens it is looking at real work rather than history.
Then keep an eye on the stream for a few days:
-
The Error Count on the resolved error should stop climbing, and Last received on should stop moving.
-
Your volume alert mail for the affected event should come back inside its Expected Range (95%).
-
Spot-check the event in the console to confirm the corrected attribute values are arriving.
Resolving an error is a bookkeeping action, not a fix. Only mark it resolved once the corrected data is actually landing.
Where to check what
-
Event counts have moved - volume alert mail, then the event in the console.
-
Attribute values are being rejected - error logs mail, then Settings → Error Logs.
-
You want to stop bad values arriving at all - Settings → Events, or Settings → Users → User Attributes.
-
You need to prove a fix worked - Live Stats, Event Logs and User One View.
Conclusion
Volume alerts, custom validations and Error Logs are three checks on the same thing: whether the data reaching NVECTA still means what your reports assume it means. Set the two alerts once, add validations to the attributes your segments and journeys depend on, and work the Error Logs list down to zero on a regular cadence. Everything downstream — segmentation, journeys, campaign reporting — gets more trustworthy for it.
Updated about 2 months ago